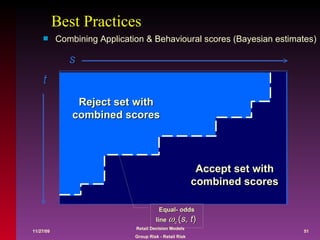
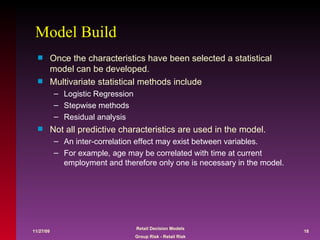
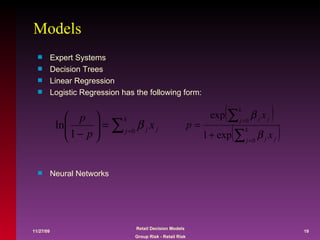
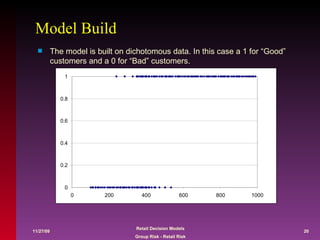
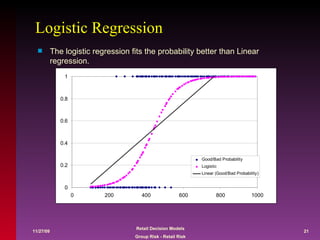
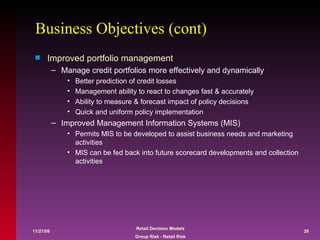
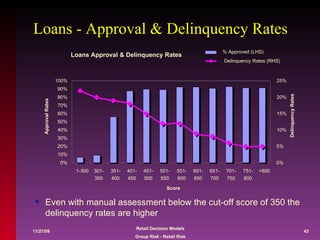
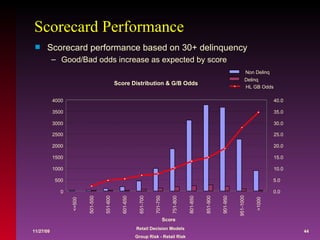
Credit Scoring Development and Methods James Marinopoulos Head of Retail Decision Model
Alan Greenspan: President, Federal Reserve Board May 1996 “… We should not forget that the basic economic function of these regulated entities (banks) is to take risk.  If we minimise risk taking in order to reduce failure rates to zero, we will, by definition, have eliminated the purpose of the banking system.”
Risk Families We are managing different groups of Risk
Retail Decision Models Responsibilities  Policy Set Group policy on Decision Models Approve Decision Model policy changes Monitor, Validate and Approve New Scorecard Developments Existing Scorecard Functionality Proposed changes to Decision Models Processes New Decision Models Systems functionality  Decision Models Systems functionality changes Governance Monitoring Undertake bank validations, reports and presentations for APRA Risk Measurement Set risk benchmarks for scorecards Risk grading models Advise Worlds best practice in Decision Models Risk related issues surrounding Decision Models
RDM Structure and Responsibilities Relationship Developments Change Requests Systems Ongoing Validations Monitoring Data Analysis
Presentation Topics Scorecard Modelling Business Objectives World Banks Monitoring Future Direction Overview of scoring
What is credit scoring? A statistical means of providing a quantifiable risk factor for a given customer or applicant. Credit scoring is a process whereby information provided is converted into numbers that are added together to arrive at a score. (“Scorecard”) The objective is to forecast future performance from past behaviour. Credit scoring developed by Fair & Isaac in early 60s Widespread acceptance in the US in early 80s and UK early 90s FICO scores make 75% of US Mortgage loan decisions Behavioural scoring accepted as more predictive than application scoring Decision Models are used in many areas of industries: Banking and Finance Insurance Retail Telecommunications
Application Scoring Application scoring is a statistical means of assessing risk at the point of application for credit  The application is scored once Application scoring is used for: Credit risk determination Loan amount approval Limit setting Credit  Decision
Behavioural Scoring Behavioural scoring is a statistical means of assessing risk for existing customers through internal behavioural data Customers/accounts scored repeatedly Behaviour scoring is used for: Authorisations Limit increase/overdraft applications Renewals/reviews Collection strategies Risk  Grading Debit   $1344. 12 Debit   $234. 01 Debit    $987.56 Debit  $6543.22 Debit   $32423.11 Total  $2556.00 Debit   $1344. 12 Debit   $234. 01 Debit    $987.56 Debit  $6543.22 Debit   $32423.11 Total  $2556.00 Debit   $1344. 12 Debit   $234. 01 Debit    $987.56 Debit  $6543.22 Debit   $32423.11 Total  $2556.00
Sample scorecard characteristics Financial   Assets  Liabilities Monthly repayment Total Monthly income Bureau No. of bureau defaults Adverse ANZ behaviour Application Purpose of loan  Deposit Security Characteristics used in scorecards are similar to those used in traditional judgemental lending, e.g.:  The difference being that attributes within these characteristics are given formal weights (scores) and added to produce a resulting score  Character Time at current employment Residential status Time at current address
Scorecard points (example) Residential status Owner Renter LWP/Other +25   -30  +10 Time in employment  (years) <2 3-4 5-6  7+ 2  10  15  25 Total monthly income 0 <$500 <$1000 <$1500 <$2000 <$3000 >$3000 0   15   25   31   37   43   48 Total defaults No Defaults   1   2+ 0   -70 -250
Other Types of Scoring Attrition Authorisations Recovery Response  Profitability Customer
Presentation Topics Overview of scoring Business Objectives World Banks Monitoring Future Direction Scorecard Modelling
Good/Bad Odds A scoring system does not individually identify a good performer from a bad performer, it classifies an applicant in a particular “Good/Bad odds” group. An applicant belonging to a 200 to 1 group, appears pretty safe and profitable. If the applicant belongs to a 4 to 1 risk group, we would no doubt find the risk unacceptable.  There is a “cut-off” point where it is not profitable for the bank to accept a certain Good to Bad ratio Based on the above, it is accepted that there will be some “bads” above the cut-off level set, and some “goods” below the cut-off level set.
'Good/Bad' Discrimination The objective of a scorecard is to have characteristics which discriminate between Good and Bad accounts with a sufficiently high probability.  Some characteristics are legally or ethically not used The score will be a measure of the probability of being a Good or Bad performer. If the scorecard is performing well then the average scores of ‘Bads’ are lower than the average scores of the ‘Goods’.
Performance Charts The Good/Bad Odds at each score can be determined and plotted onto a Performance chart 0 40 80 120 160 200 240 280 320 360 400 440 480 520 560 600 640 680 720 760 800 Score Number Of Clients Goods Bads 8 1 Graph 2 - Log Odds Performance Chart 0 5 25 128 645 3250 16400 0 40 80 120 160 200 240 280 320 360 400 440 480 520 560 600 640 680 720 760 800 Good/Bad Odds 0 2 4 6 8 10 12 14 Log GBOs (Base 2) 8 to 1 2  to 1 3
Application Scorecard Construction Flow Chart Characteristic Analysis Multivariate model build Reject Inference Statistical Analysis Customised Scorecard Product Identification File Data Availability Sampling Data Extraction/Cost Data Integrity Set cut-off Score Implementation Validation Generic Scorecard External Data Source Scorecard Vendor Outsourcing Scorecard Monitoring
Model Build Once the characteristics have been selected a statistical model can be developed. Multivariate statistical methods include  Logistic Regression Stepwise methods Residual analysis Not all predictive characteristics are used in the model. An inter-correlation effect may exist between variables.  For example, age may be correlated with time at current employment and therefore only one is necessary in the model.
Models Expert Systems Decision Trees Linear Regression Logistic Regression has the following form: Neural Networks
Model Build The model is built on dichotomous data. In this case a 1 for “Good” customers and a 0 for “Bad” customers.
Logistic Regression The logistic regression fits the probability better than Linear regression.
Reject Inference and Validation Reject Inference Reject Inference is only necessary for scorecards were there is no performance information for rejected applications Applications that are rejected must be included in the final model.  Behavioural scorecards deal only in existing customers, therefore do not require reject inference. Validation A randomly selected control group (hold out sample) or proxy portfolio to test the model.
Measures of discrimination Receiver Operating Curve (ROC) The Receiver Operating Curve is the area under the curve generated when the cumulative Bads are plotted against the cumulative goods (Lorenz Curve). Gini coefficient (G) This discrimination measure is geometrically defined as the ratio of the area A of the shaded semi-circular area to the area B of the triangle in the Lorenz diagram.  PH (percentage Good for 50% Bad) This is defined as the cumulative proportion of Goods up to the median value of the Bads.  Gini. xls
Measures of discrimination – (I) Scorecard performance can be judged on the level of discrimination Two measure that can be used are: Gini (or ROC) PH  - % of Goods below 50% of bads 1% of PH could mean an additional 3% approvals 1% of PH could mean an reduction of 0.2% bad debts Gini=0.62%
Measures of discrimination –(II) Discrimination measures should be determined for discrete attributes Chi-Squared Fico (Kullback Divergence) Based on a book by Solomon Kullback “ Information Theory and Statistics”
Issues for Successful Implementation Cultural Change Requires top management support Operational process Redesign to minimise manual intervention and maximise cost savings. Data Integrity Quality of the overall decisions, and subsequently the Portfolio, is dependant upon the accuracy of the data input.  The first time! Setting the Cut-off score correctly
Presentation Topics Overview of scoring Scorecard Modelling World Banks Monitoring Future Direction Business Objectives
Business Objectives Increase consistency of lending decisions Consistent & unbiased treatment of applicant  Customers with the same details get the same score Total management control over credit approval systems Allows for loosening or tightening of lending through credit cycles  Potential increase in approvals Reduce operating costs Increase in automated processing Improve customer service Fast and consistent decisions at application point More appropriate limit and authorisation decisions Reduction in collection actions on low risk accounts Risk based allocation of credit limits and issue terms
Business Objectives (cont) Improved portfolio management Manage credit portfolios more effectively and dynamically Better prediction of credit losses Management ability to react to changes fast & accurately  Ability to measure & forecast impact of policy decisions Quick and uniform policy implementation Improved Management Information Systems (MIS) Permits MIS to be developed to assist business needs and marketing  activities MIS can be fed back into future scorecard developments and collection activities
Presentation Topics Overview of scoring Scorecard Modelling Business Objectives Monitoring Future Direction World Banks
World Banks ANZ European Banks Banking market in Europe is restructuring Banks are merging across country boundaries UK bank visits Bank A - bank with many recent acquisitions Bank B - bank dealing with mainly credit cards Bank C - ex building society now owned by bank Bank D - large diverse bank National Australia Bank
World Banks UK Banks AUS Banks
Bureaus Fair Isaac is the main bureaus in USA “ White” and “Black” data is supplied to and from all financial institution  Fair Isaac (Equifax) and Experian are the two main bureaus in UK “ White” data is supplied to a financial institution if the supply to bureau Currently few banks supply and receive “white” data Mergers are leading most banks to look at this option Fair Isaac is trying to beat Experian in having bureau scores in the UK This is only possible when all banks supply “white” data Credit Advantage is used in Australia Provides “Black”  data only Linked with Decision Advantage (previously Equigen) Bureau scores used for ANZ Small Business We could use Dunn & Bradstreet for over $250k lending Baycorp is used in New Zealand Provides “Black”  data only Baycorp is also a collections agency NZ puts the smallest amount lost as a default Baycorp and Credit Advantage have just merged
Credit Scoring & Bureaus Around the World “We are not alone!” B B B B B B B
BASEL - The New Accord The New Accord will give banks with sophisticated risk management capabilities increased flexibility More emphasis on bank’s internal measures of risk, supervisory review and market discipline Decision support technology has an important role to play Incentivise better risk management  Data warehouses are fundamental to addressing many of the requirements SMB sector will be key  More risk sensitive Competitive equality Paul%20Russell%2013a[1] The New Basel Capital Accord Pillar 1 : Minimum capital requirement Pillar 2 : Supervisory review process Pillar 3 : Market  discipline
Pillar 1 : credit risk Internal Rating Based (IRB) approach Foundation Bank sets Probability of Default (PD) Standard Exposure At Default (EAD) Standard Loss Given Default (LGD) Advanced Banks sets PD, EAD & LGD Better recognition of credit risk mitigation techniques Behavioural scoring Internal External  Data storage
Future direction of scoring “Adaptive Control” first implemented 1985 in USA Champion/Challenger processes for determining actions based on scores Required 10 years to be widespread in US Customer Relationship Management Profitability (NIACC) Attrition Propensity to Buy (Cross Sell)  Life time revenue Recovery scorecards Operations Research Methods Simulation modelling
Presentation Topics Overview of scoring Scorecard Modelling Business Objectives World Banks Future Direction Monitoring
Monitoring Examples 1. Operation Stability Reports  The four types of front end monitoring reports: 1.1 Approval Statistics Report 1.2 Population Stability Report 1.3 System Rules Referral Report 1.4 Portfolio Statistics Report Operational statistics can be obtained as soon as an automated decision process is implemented Early warning indicators of decision functionality error and scorecard validity Should be produced by Business Units or MIS
Loan Approval/Declines by Score Approva/Declinal Rates by Score 0% 10% 20% 30% 40% 50% 60% 70% 80% 90% 100% <=500 501-550 551-600 601-650 651-700 701-750 751-800 801-850 851-900 901-950 951-1000 >1000 Score Bands Percentages Auto Declined Manually Declined Manually Approved Auto Approved
Population Stability Compare each characteristic and attribute  over time  against benchmarks Plot score distributions over time for potential change Indicates potential drift in performance  NO YES Dec-96 25% 75% Mar-97 23% 77% Jun-97 24% 76% Sep-97 22% 78% Dec-97 21% 79% Mar-98 19% 81% Jun-98 19% 81% Sep-98 22% 78% Dec-98 20% 80% Mar-99 20% 80% Jun-99 18% 82% Sep-99 18% 82% Dec-99 17% 83% Benchmarks 29% 71% Population Stability 0% 10% 20% 30% 40% 50% 60% 70% 80% 90% NO YES Dec-96 Mar-97 Jun-97 Sep-97 Dec-97 Mar-98 Jun-98 Sep-98 Dec-98 Mar-99 Jun-99 Sep-99 Dec-99
Monitoring Requirements 2. Performance Analysis The two types of back end monitoring are: 2.1 Scorecard Performance Report 2.2 Characteristic Analysis Report 2.3 Dynamic Delinquency Report Performance Analysis is undertaken once a certain level of customer maturity has been established Should be produced by BU and Group Risk
Loans - Approval & Delinquency Rates Even with manual assessment below the cut-off score of 350 the delinquency rates are higher Loans Approval & Delinquency Rates 0%  10%  20%  30%  40%  50%  60%  70%  80%  90%  100%  1-300 301- 350 351- 400 401- 450 451- 500 501- 550 551- 600 601- 650 651- 700 701- 750 751- 800 >800 Score Approval Rates 0%  5%  10%  15%  20%  25%  Delinquency Rates % Approved (LHS) Delinquency Rates (RHS)
Scorecard Performance Scorecard performance based on 30+ delinquency Good/Bad odds increase as expected by score  Score Distribution & G/B Odds 0 500 1000 1500 2000 2500 3000 3500 4000 <=500 501-550 551-600 601-650 651-700 701-750 751-800 801-850 851-900 901-950 951-1000 >1000 Score 0.0 5.0 10.0 15.0 20.0 25.0 30.0 35.0 40.0 Non Delinq Delinq HL GB Odds
Presentation Topics Overview of scoring Scorecard Modelling Business Objectives World Banks Monitoring Future Direction
Future Direction Modelling Experimental Design Champion/Challenger Strategies Hypothesis testing (uni & multi- dimensional) Quality Control Techniques Control Charts Operations Research Optimisation techniques Simulation Models Stress Testing
Conferences Fair Isaac and Experian are the two main credit scoring companies world wide Fair Isaac  (Every year, alternating in Europe and USA) Main bureau and FICO Scores in USA Equifax in UK Systems included TRIAD Conference was mainly selling FICO products and systems (but also Technical) Experian  (Every year, in Europe) Formerly CCN Systems include Transact and Hunter Conference on world wide banking, financial, telecommunications and predictive modelling usage (Business and/or Management) University of Edinburgh  (Every 2 year in Edinburgh) Very technical academic papers Proposal to run alternate years in a USA university
Three Portfolio Dimensions: Volume, Loss, and Profit low high high E [ Profit ] E [ Volume ] E [ Losses ] Low cutoffs High cutoffs
Efficient Frontiers in two dimensions OP High Cutoffs E[Volume] E[Loss] Low Cutoffs 0.6 0.0 0.2 Low Cutoffs High Cutoffs E[Profit] E[Loss] OP 0.9 0.6 0.0 0.2 0.6 High Cutoffs Low Cutoffs OP E[Volume] E[Profit] 0.6 0.2 0.2 0.9 Efficient Frontier
Improved portfolio performance OP High Cutoffs E[Volume] E[Loss] Low Cutoffs 0.6 0.0 0.2 Low Cutoffs High Cutoffs E[Profit] E[Loss] OP 0.9 0.6 0.0 0.2 0.6 High Cutoffs Low Cutoffs OP E[Volume] E[Profit] 0.6 0.2 0.2 0.9 Single Score Combined Scores Single Score Combined Scores Single Score Combined Scores Efficient Frontier
Best Practices Combining Application & Behavioural scores (Bayesian estimates) Reject set with combined scores Accept set with combined scores s t Equal- odds line   c  ( s, t )
Other Techniques Customer Relation Management Survival Analysis Multiple Indicator Multiple Cause Proportional Hazards.ppt Measuring Customer Quality.doc

Creditscore

  • 1.
    Credit Scoring Developmentand Methods James Marinopoulos Head of Retail Decision Model
  • 2.
    Alan Greenspan: President,Federal Reserve Board May 1996 “… We should not forget that the basic economic function of these regulated entities (banks) is to take risk. If we minimise risk taking in order to reduce failure rates to zero, we will, by definition, have eliminated the purpose of the banking system.”
  • 3.
    Risk Families Weare managing different groups of Risk
  • 4.
    Retail Decision ModelsResponsibilities Policy Set Group policy on Decision Models Approve Decision Model policy changes Monitor, Validate and Approve New Scorecard Developments Existing Scorecard Functionality Proposed changes to Decision Models Processes New Decision Models Systems functionality Decision Models Systems functionality changes Governance Monitoring Undertake bank validations, reports and presentations for APRA Risk Measurement Set risk benchmarks for scorecards Risk grading models Advise Worlds best practice in Decision Models Risk related issues surrounding Decision Models
  • 5.
    RDM Structure andResponsibilities Relationship Developments Change Requests Systems Ongoing Validations Monitoring Data Analysis
  • 6.
    Presentation Topics ScorecardModelling Business Objectives World Banks Monitoring Future Direction Overview of scoring
  • 7.
    What is creditscoring? A statistical means of providing a quantifiable risk factor for a given customer or applicant. Credit scoring is a process whereby information provided is converted into numbers that are added together to arrive at a score. (“Scorecard”) The objective is to forecast future performance from past behaviour. Credit scoring developed by Fair & Isaac in early 60s Widespread acceptance in the US in early 80s and UK early 90s FICO scores make 75% of US Mortgage loan decisions Behavioural scoring accepted as more predictive than application scoring Decision Models are used in many areas of industries: Banking and Finance Insurance Retail Telecommunications
  • 8.
    Application Scoring Applicationscoring is a statistical means of assessing risk at the point of application for credit The application is scored once Application scoring is used for: Credit risk determination Loan amount approval Limit setting Credit Decision
  • 9.
    Behavioural Scoring Behaviouralscoring is a statistical means of assessing risk for existing customers through internal behavioural data Customers/accounts scored repeatedly Behaviour scoring is used for: Authorisations Limit increase/overdraft applications Renewals/reviews Collection strategies Risk Grading Debit $1344. 12 Debit $234. 01 Debit $987.56 Debit $6543.22 Debit $32423.11 Total $2556.00 Debit $1344. 12 Debit $234. 01 Debit $987.56 Debit $6543.22 Debit $32423.11 Total $2556.00 Debit $1344. 12 Debit $234. 01 Debit $987.56 Debit $6543.22 Debit $32423.11 Total $2556.00
  • 10.
    Sample scorecard characteristicsFinancial Assets Liabilities Monthly repayment Total Monthly income Bureau No. of bureau defaults Adverse ANZ behaviour Application Purpose of loan Deposit Security Characteristics used in scorecards are similar to those used in traditional judgemental lending, e.g.: The difference being that attributes within these characteristics are given formal weights (scores) and added to produce a resulting score Character Time at current employment Residential status Time at current address
  • 11.
    Scorecard points (example)Residential status Owner Renter LWP/Other +25 -30 +10 Time in employment (years) <2 3-4 5-6 7+ 2 10 15 25 Total monthly income 0 <$500 <$1000 <$1500 <$2000 <$3000 >$3000 0 15 25 31 37 43 48 Total defaults No Defaults 1 2+ 0 -70 -250
  • 12.
    Other Types ofScoring Attrition Authorisations Recovery Response Profitability Customer
  • 13.
    Presentation Topics Overviewof scoring Business Objectives World Banks Monitoring Future Direction Scorecard Modelling
  • 14.
    Good/Bad Odds Ascoring system does not individually identify a good performer from a bad performer, it classifies an applicant in a particular “Good/Bad odds” group. An applicant belonging to a 200 to 1 group, appears pretty safe and profitable. If the applicant belongs to a 4 to 1 risk group, we would no doubt find the risk unacceptable. There is a “cut-off” point where it is not profitable for the bank to accept a certain Good to Bad ratio Based on the above, it is accepted that there will be some “bads” above the cut-off level set, and some “goods” below the cut-off level set.
  • 15.
    'Good/Bad' Discrimination Theobjective of a scorecard is to have characteristics which discriminate between Good and Bad accounts with a sufficiently high probability. Some characteristics are legally or ethically not used The score will be a measure of the probability of being a Good or Bad performer. If the scorecard is performing well then the average scores of ‘Bads’ are lower than the average scores of the ‘Goods’.
  • 16.
    Performance Charts TheGood/Bad Odds at each score can be determined and plotted onto a Performance chart 0 40 80 120 160 200 240 280 320 360 400 440 480 520 560 600 640 680 720 760 800 Score Number Of Clients Goods Bads 8 1 Graph 2 - Log Odds Performance Chart 0 5 25 128 645 3250 16400 0 40 80 120 160 200 240 280 320 360 400 440 480 520 560 600 640 680 720 760 800 Good/Bad Odds 0 2 4 6 8 10 12 14 Log GBOs (Base 2) 8 to 1 2 to 1 3
  • 17.
    Application Scorecard ConstructionFlow Chart Characteristic Analysis Multivariate model build Reject Inference Statistical Analysis Customised Scorecard Product Identification File Data Availability Sampling Data Extraction/Cost Data Integrity Set cut-off Score Implementation Validation Generic Scorecard External Data Source Scorecard Vendor Outsourcing Scorecard Monitoring
  • 18.
    Model Build Oncethe characteristics have been selected a statistical model can be developed. Multivariate statistical methods include Logistic Regression Stepwise methods Residual analysis Not all predictive characteristics are used in the model. An inter-correlation effect may exist between variables. For example, age may be correlated with time at current employment and therefore only one is necessary in the model.
  • 19.
    Models Expert SystemsDecision Trees Linear Regression Logistic Regression has the following form: Neural Networks
  • 20.
    Model Build Themodel is built on dichotomous data. In this case a 1 for “Good” customers and a 0 for “Bad” customers.
  • 21.
    Logistic Regression Thelogistic regression fits the probability better than Linear regression.
  • 22.
    Reject Inference andValidation Reject Inference Reject Inference is only necessary for scorecards were there is no performance information for rejected applications Applications that are rejected must be included in the final model. Behavioural scorecards deal only in existing customers, therefore do not require reject inference. Validation A randomly selected control group (hold out sample) or proxy portfolio to test the model.
  • 23.
    Measures of discriminationReceiver Operating Curve (ROC) The Receiver Operating Curve is the area under the curve generated when the cumulative Bads are plotted against the cumulative goods (Lorenz Curve). Gini coefficient (G) This discrimination measure is geometrically defined as the ratio of the area A of the shaded semi-circular area to the area B of the triangle in the Lorenz diagram. PH (percentage Good for 50% Bad) This is defined as the cumulative proportion of Goods up to the median value of the Bads. Gini. xls
  • 24.
    Measures of discrimination– (I) Scorecard performance can be judged on the level of discrimination Two measure that can be used are: Gini (or ROC) PH - % of Goods below 50% of bads 1% of PH could mean an additional 3% approvals 1% of PH could mean an reduction of 0.2% bad debts Gini=0.62%
  • 25.
    Measures of discrimination–(II) Discrimination measures should be determined for discrete attributes Chi-Squared Fico (Kullback Divergence) Based on a book by Solomon Kullback “ Information Theory and Statistics”
  • 26.
    Issues for SuccessfulImplementation Cultural Change Requires top management support Operational process Redesign to minimise manual intervention and maximise cost savings. Data Integrity Quality of the overall decisions, and subsequently the Portfolio, is dependant upon the accuracy of the data input. The first time! Setting the Cut-off score correctly
  • 27.
    Presentation Topics Overviewof scoring Scorecard Modelling World Banks Monitoring Future Direction Business Objectives
  • 28.
    Business Objectives Increaseconsistency of lending decisions Consistent & unbiased treatment of applicant Customers with the same details get the same score Total management control over credit approval systems Allows for loosening or tightening of lending through credit cycles Potential increase in approvals Reduce operating costs Increase in automated processing Improve customer service Fast and consistent decisions at application point More appropriate limit and authorisation decisions Reduction in collection actions on low risk accounts Risk based allocation of credit limits and issue terms
  • 29.
    Business Objectives (cont)Improved portfolio management Manage credit portfolios more effectively and dynamically Better prediction of credit losses Management ability to react to changes fast & accurately Ability to measure & forecast impact of policy decisions Quick and uniform policy implementation Improved Management Information Systems (MIS) Permits MIS to be developed to assist business needs and marketing activities MIS can be fed back into future scorecard developments and collection activities
  • 30.
    Presentation Topics Overviewof scoring Scorecard Modelling Business Objectives Monitoring Future Direction World Banks
  • 31.
    World Banks ANZEuropean Banks Banking market in Europe is restructuring Banks are merging across country boundaries UK bank visits Bank A - bank with many recent acquisitions Bank B - bank dealing with mainly credit cards Bank C - ex building society now owned by bank Bank D - large diverse bank National Australia Bank
  • 32.
    World Banks UKBanks AUS Banks
  • 33.
    Bureaus Fair Isaacis the main bureaus in USA “ White” and “Black” data is supplied to and from all financial institution Fair Isaac (Equifax) and Experian are the two main bureaus in UK “ White” data is supplied to a financial institution if the supply to bureau Currently few banks supply and receive “white” data Mergers are leading most banks to look at this option Fair Isaac is trying to beat Experian in having bureau scores in the UK This is only possible when all banks supply “white” data Credit Advantage is used in Australia Provides “Black” data only Linked with Decision Advantage (previously Equigen) Bureau scores used for ANZ Small Business We could use Dunn & Bradstreet for over $250k lending Baycorp is used in New Zealand Provides “Black” data only Baycorp is also a collections agency NZ puts the smallest amount lost as a default Baycorp and Credit Advantage have just merged
  • 34.
    Credit Scoring &Bureaus Around the World “We are not alone!” B B B B B B B
  • 35.
    BASEL - TheNew Accord The New Accord will give banks with sophisticated risk management capabilities increased flexibility More emphasis on bank’s internal measures of risk, supervisory review and market discipline Decision support technology has an important role to play Incentivise better risk management Data warehouses are fundamental to addressing many of the requirements SMB sector will be key More risk sensitive Competitive equality Paul%20Russell%2013a[1] The New Basel Capital Accord Pillar 1 : Minimum capital requirement Pillar 2 : Supervisory review process Pillar 3 : Market discipline
  • 36.
    Pillar 1 :credit risk Internal Rating Based (IRB) approach Foundation Bank sets Probability of Default (PD) Standard Exposure At Default (EAD) Standard Loss Given Default (LGD) Advanced Banks sets PD, EAD & LGD Better recognition of credit risk mitigation techniques Behavioural scoring Internal External Data storage
  • 37.
    Future direction ofscoring “Adaptive Control” first implemented 1985 in USA Champion/Challenger processes for determining actions based on scores Required 10 years to be widespread in US Customer Relationship Management Profitability (NIACC) Attrition Propensity to Buy (Cross Sell) Life time revenue Recovery scorecards Operations Research Methods Simulation modelling
  • 38.
    Presentation Topics Overviewof scoring Scorecard Modelling Business Objectives World Banks Future Direction Monitoring
  • 39.
    Monitoring Examples 1.Operation Stability Reports The four types of front end monitoring reports: 1.1 Approval Statistics Report 1.2 Population Stability Report 1.3 System Rules Referral Report 1.4 Portfolio Statistics Report Operational statistics can be obtained as soon as an automated decision process is implemented Early warning indicators of decision functionality error and scorecard validity Should be produced by Business Units or MIS
  • 40.
    Loan Approval/Declines byScore Approva/Declinal Rates by Score 0% 10% 20% 30% 40% 50% 60% 70% 80% 90% 100% <=500 501-550 551-600 601-650 651-700 701-750 751-800 801-850 851-900 901-950 951-1000 >1000 Score Bands Percentages Auto Declined Manually Declined Manually Approved Auto Approved
  • 41.
    Population Stability Compareeach characteristic and attribute over time against benchmarks Plot score distributions over time for potential change Indicates potential drift in performance NO YES Dec-96 25% 75% Mar-97 23% 77% Jun-97 24% 76% Sep-97 22% 78% Dec-97 21% 79% Mar-98 19% 81% Jun-98 19% 81% Sep-98 22% 78% Dec-98 20% 80% Mar-99 20% 80% Jun-99 18% 82% Sep-99 18% 82% Dec-99 17% 83% Benchmarks 29% 71% Population Stability 0% 10% 20% 30% 40% 50% 60% 70% 80% 90% NO YES Dec-96 Mar-97 Jun-97 Sep-97 Dec-97 Mar-98 Jun-98 Sep-98 Dec-98 Mar-99 Jun-99 Sep-99 Dec-99
  • 42.
    Monitoring Requirements 2.Performance Analysis The two types of back end monitoring are: 2.1 Scorecard Performance Report 2.2 Characteristic Analysis Report 2.3 Dynamic Delinquency Report Performance Analysis is undertaken once a certain level of customer maturity has been established Should be produced by BU and Group Risk
  • 43.
    Loans - Approval& Delinquency Rates Even with manual assessment below the cut-off score of 350 the delinquency rates are higher Loans Approval & Delinquency Rates 0% 10% 20% 30% 40% 50% 60% 70% 80% 90% 100% 1-300 301- 350 351- 400 401- 450 451- 500 501- 550 551- 600 601- 650 651- 700 701- 750 751- 800 >800 Score Approval Rates 0% 5% 10% 15% 20% 25% Delinquency Rates % Approved (LHS) Delinquency Rates (RHS)
  • 44.
    Scorecard Performance Scorecardperformance based on 30+ delinquency Good/Bad odds increase as expected by score Score Distribution & G/B Odds 0 500 1000 1500 2000 2500 3000 3500 4000 <=500 501-550 551-600 601-650 651-700 701-750 751-800 801-850 851-900 901-950 951-1000 >1000 Score 0.0 5.0 10.0 15.0 20.0 25.0 30.0 35.0 40.0 Non Delinq Delinq HL GB Odds
  • 45.
    Presentation Topics Overviewof scoring Scorecard Modelling Business Objectives World Banks Monitoring Future Direction
  • 46.
    Future Direction ModellingExperimental Design Champion/Challenger Strategies Hypothesis testing (uni & multi- dimensional) Quality Control Techniques Control Charts Operations Research Optimisation techniques Simulation Models Stress Testing
  • 47.
    Conferences Fair Isaacand Experian are the two main credit scoring companies world wide Fair Isaac (Every year, alternating in Europe and USA) Main bureau and FICO Scores in USA Equifax in UK Systems included TRIAD Conference was mainly selling FICO products and systems (but also Technical) Experian (Every year, in Europe) Formerly CCN Systems include Transact and Hunter Conference on world wide banking, financial, telecommunications and predictive modelling usage (Business and/or Management) University of Edinburgh (Every 2 year in Edinburgh) Very technical academic papers Proposal to run alternate years in a USA university
  • 48.
    Three Portfolio Dimensions:Volume, Loss, and Profit low high high E [ Profit ] E [ Volume ] E [ Losses ] Low cutoffs High cutoffs
  • 49.
    Efficient Frontiers intwo dimensions OP High Cutoffs E[Volume] E[Loss] Low Cutoffs 0.6 0.0 0.2 Low Cutoffs High Cutoffs E[Profit] E[Loss] OP 0.9 0.6 0.0 0.2 0.6 High Cutoffs Low Cutoffs OP E[Volume] E[Profit] 0.6 0.2 0.2 0.9 Efficient Frontier
  • 50.
    Improved portfolio performanceOP High Cutoffs E[Volume] E[Loss] Low Cutoffs 0.6 0.0 0.2 Low Cutoffs High Cutoffs E[Profit] E[Loss] OP 0.9 0.6 0.0 0.2 0.6 High Cutoffs Low Cutoffs OP E[Volume] E[Profit] 0.6 0.2 0.2 0.9 Single Score Combined Scores Single Score Combined Scores Single Score Combined Scores Efficient Frontier
  • 51.
    Best Practices CombiningApplication & Behavioural scores (Bayesian estimates) Reject set with combined scores Accept set with combined scores s t Equal- odds line  c ( s, t )
  • 52.
    Other Techniques CustomerRelation Management Survival Analysis Multiple Indicator Multiple Cause Proportional Hazards.ppt Measuring Customer Quality.doc