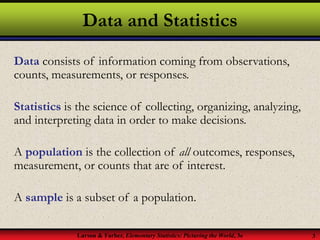
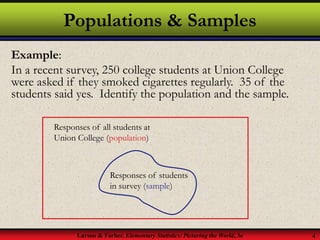
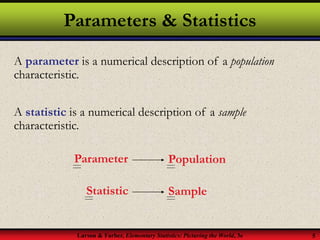
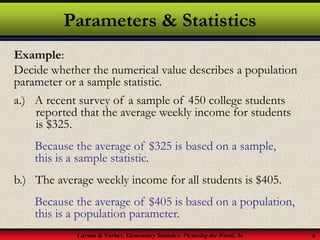
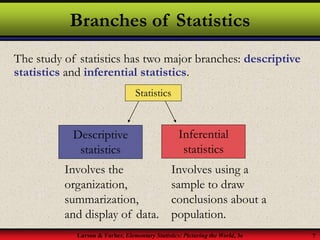
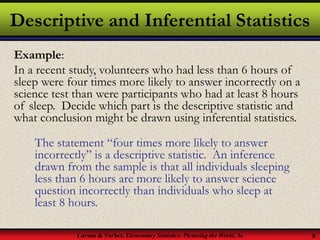
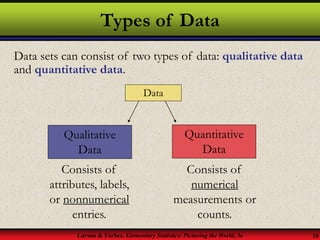
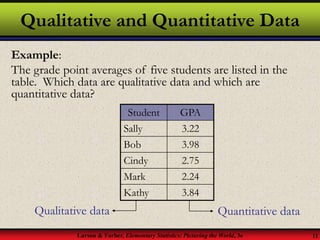
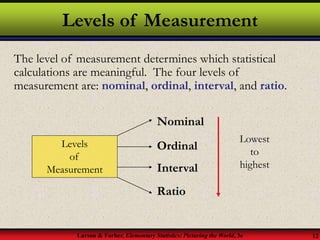
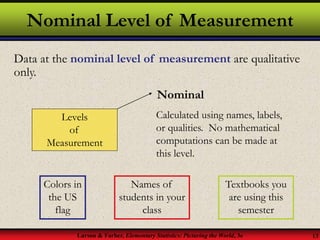
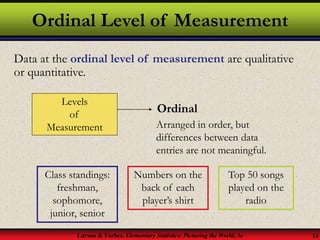
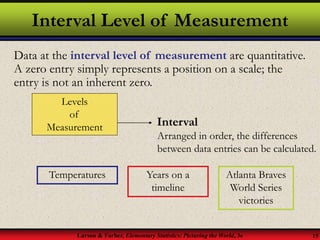
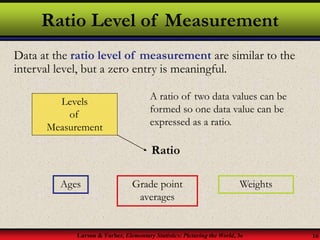
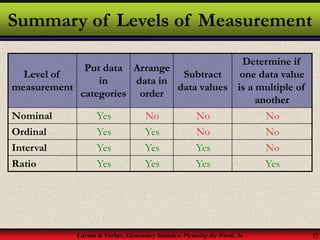
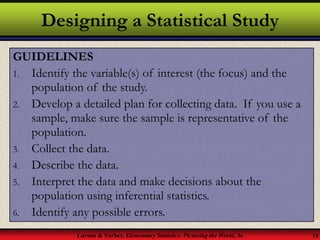
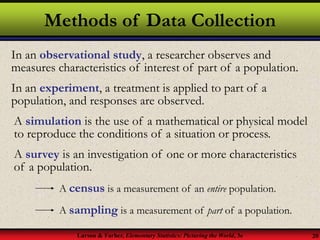
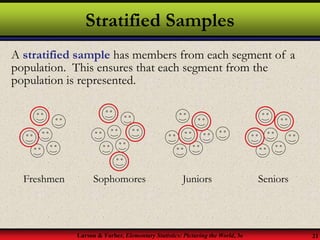
SlideShare a Scribd company logo
Introduction to Statistics
Chapter 1
§ 1.1
An Overview of
Statistics
Larson & Farber, Elementary Statistics: Picturing the World, 3e 3
Data and Statistics
Data consists of information coming from observations,
counts, measurements, or responses.
Statistics is the science of collecting, organizing, analyzing,
and interpreting data in order to make decisions.
A population is the collection of all outcomes, responses,
measurement, or counts that are of interest.
A sample is a subset of a population.
Larson & Farber, Elementary Statistics: Picturing the World, 3e 4
Populations & Samples
Example:
In a recent survey, 250 college students at Union College
were asked if they smoked cigarettes regularly. 35 of the
students said yes. Identify the population and the sample.
Responses of all students at
Union College (population)
Responses of students
in survey (sample)
Larson & Farber, Elementary Statistics: Picturing the World, 3e 5
Parameters & Statistics
A parameter is a numerical description of a population
characteristic.
A statistic is a numerical description of a sample
characteristic.
Parameter Population
Statistic Sample
Larson & Farber, Elementary Statistics: Picturing the World, 3e 6
Parameters & Statistics
Example:
Decide whether the numerical value describes a population
parameter or a sample statistic.
a.) A recent survey of a sample of 450 college students
reported that the average weekly income for students
is $325.
Because the average of $325 is based on a sample,
this is a sample statistic.
b.) The average weekly income for all students is $405.
Because the average of $405 is based on a population,
this is a population parameter.
Larson & Farber, Elementary Statistics: Picturing the World, 3e 7
Branches of Statistics
The study of statistics has two major branches: descriptive
statistics and inferential statistics.
Statistics
Descriptive
statistics
Inferential
statistics
Involves the
organization,
summarization,
and display of data.
Involves using a
sample to draw
conclusions about a
population.
Larson & Farber, Elementary Statistics: Picturing the World, 3e 8
Descriptive and Inferential Statistics
Example:
In a recent study, volunteers who had less than 6 hours of
sleep were four times more likely to answer incorrectly on a
science test than were participants who had at least 8 hours
of sleep. Decide which part is the descriptive statistic and
what conclusion might be drawn using inferential statistics.
The statement “four times more likely to answer
incorrectly” is a descriptive statistic. An inference
drawn from the sample is that all individuals sleeping
less than 6 hours are more likely to answer science
question incorrectly than individuals who sleep at
least 8 hours.
§ 1.2
Data Classification
Larson & Farber, Elementary Statistics: Picturing the World, 3e 10
Types of Data
Data sets can consist of two types of data: qualitative data
and quantitative data.
Data
Qualitative
Data
Quantitative
Data
Consists of
attributes, labels,
or nonnumerical
entries.
Consists of
numerical
measurements or
counts.
Larson & Farber, Elementary Statistics: Picturing the World, 3e 11
Qualitative and Quantitative Data
Example:
The grade point averages of five students are listed in the
table. Which data are qualitative data and which are
quantitative data?
Student GPA
Sally 3.22
Bob 3.98
Cindy 2.75
Mark 2.24
Kathy 3.84
Quantitative data
Qualitative data
Larson & Farber, Elementary Statistics: Picturing the World, 3e 12
Levels of Measurement
The level of measurement determines which statistical
calculations are meaningful. The four levels of
measurement are: nominal, ordinal, interval, and ratio.
Levels
of
Measurement
Nominal
Ordinal
Interval
Ratio
Lowest
to
highest
Larson & Farber, Elementary Statistics: Picturing the World, 3e 13
Nominal Level of Measurement
Data at the nominal level of measurement are qualitative
only.
Levels
of
Measurement
Nominal
Calculated using names, labels,
or qualities. No mathematical
computations can be made at
this level.
Colors in
the US
flag
Names of
students in your
class
Textbooks you
are using this
semester
Larson & Farber, Elementary Statistics: Picturing the World, 3e 14
Ordinal Level of Measurement
Data at the ordinal level of measurement are qualitative
or quantitative.
Levels
of
Measurement Arranged in order, but
differences between data
entries are not meaningful.
Class standings:
freshman,
sophomore,
junior, senior
Numbers on the
back of each
player’s shirt
Ordinal
Top 50 songs
played on the
radio
Larson & Farber, Elementary Statistics: Picturing the World, 3e 15
Interval Level of Measurement
Data at the interval level of measurement are quantitative.
A zero entry simply represents a position on a scale; the
entry is not an inherent zero.
Levels
of
Measurement
Arranged in order, the differences
between data entries can be calculated.
Temperatures Years on a
timeline
Interval
Atlanta Braves
World Series
victories
Larson & Farber, Elementary Statistics: Picturing the World, 3e 16
Ratio Level of Measurement
Data at the ratio level of measurement are similar to the
interval level, but a zero entry is meaningful.
Levels
of
Measurement
A ratio of two data values can be
formed so one data value can be
expressed as a ratio.
Ages Grade point
averages
Ratio
Weights
Larson & Farber, Elementary Statistics: Picturing the World, 3e 17
Summary of Levels of Measurement
No
No
No
Yes
Nominal
No
No
Yes
Yes
Ordinal
No
Yes
Yes
Yes
Interval
Yes
Yes
Yes
Yes
Ratio
Determine if
one data value
is a multiple of
another
Subtract
data values
Arrange
data in
order
Put data
in
categories
Level of
measurement
§ 1.3
Experimental Design
Larson & Farber, Elementary Statistics: Picturing the World, 3e 19
Designing a Statistical Study
GUIDELINES
1. Identify the variable(s) of interest (the focus) and the
population of the study.
2. Develop a detailed plan for collecting data. If you use a
sample, make sure the sample is representative of the
population.
3. Collect the data.
4. Describe the data.
5. Interpret the data and make decisions about the
population using inferential statistics.
6. Identify any possible errors.
Larson & Farber, Elementary Statistics: Picturing the World, 3e 20
Methods of Data Collection
In an observational study, a researcher observes and
measures characteristics of interest of part of a population.
In an experiment, a treatment is applied to part of a
population, and responses are observed.
A simulation is the use of a mathematical or physical model
to reproduce the conditions of a situation or process.
A survey is an investigation of one or more characteristics
of a population.
A census is a measurement of an entire population.
A sampling is a measurement of part of a population.
Larson & Farber, Elementary Statistics: Picturing the World, 3e 21
Stratified Samples
A stratified sample has members from each segment of a
population. This ensures that each segment from the
population is represented.
Freshmen Sophomores Juniors Seniors
Larson & Farber, Elementary Statistics: Picturing the World, 3e 22
Cluster Samples
A cluster sample has all members from randomly selected
segments of a population. This is used when the population
falls into naturally occurring subgroups.
The city of Clarksville divided into city blocks.
All members
in each
selected group
are used.
Larson & Farber, Elementary Statistics: Picturing the World, 3e 23
Systematic Samples
A systematic sample is a sample in which each member of
the population is assigned a number. A starting number is
randomly selected and sample members are selected at
regular intervals.
Every fourth member is chosen.
Larson & Farber, Elementary Statistics: Picturing the World, 3e 24
Convenience Samples
A convenience sample consists only of available members
of the population.
Example:
You are doing a study to determine the number of years of
education each teacher at your college has. Identify the sampling
technique used if you select the samples listed.
1.) You randomly select two different departments and survey each
teacher in those departments.
2.) You select only the teachers you currently have this semester.
3.) You divide the teachers up according to their department and
then choose and survey some teachers in each department. Continued.
Larson & Farber, Elementary Statistics: Picturing the World, 3e 25
Identifying the Sampling Technique
Example continued:
You are doing a study to determine the number of years of
education each teacher at your college has. Identify the sampling
technique used if you select the samples listed.
1.) This is a cluster sample because each department is a naturally
occurring subdivision.
2.) This is a convenience sample because you are using the teachers
that are readily available to you.
3.) This is a stratified sample because the teachers are divided by
department and some from each department are randomly
selected.

More Related Content

What's hot

2.1 frequency distributions, histograms, and related topics
2.1 frequency distributions, histograms, and related topics2.1 frequency distributions, histograms, and related topics
2.1 frequency distributions, histograms, and related topicsleblance
 
Percentiles and Deciles
Percentiles and DecilesPercentiles and Deciles
Percentiles and Deciles
Mary Espinar
 
Normal distribution
Normal distributionNormal distribution
Normal distribution
Sarabjeet Kaur
 
Day 1 - Measures of Position - Quartiles - Percentiles - ZScores-BoxPlots 2.6...
Day 1 - Measures of Position - Quartiles - Percentiles - ZScores-BoxPlots 2.6...Day 1 - Measures of Position - Quartiles - Percentiles - ZScores-BoxPlots 2.6...
Day 1 - Measures of Position - Quartiles - Percentiles - ZScores-BoxPlots 2.6...
rich_26
 
Basic Descriptive statistics
Basic Descriptive statisticsBasic Descriptive statistics
Basic Descriptive statistics
Ajendra Sharma
 
Chapter 4 260110 044531
Chapter 4 260110 044531Chapter 4 260110 044531
Chapter 4 260110 044531
guest25d353
 
Normal Probability Distribution
Normal Probability DistributionNormal Probability Distribution
Normal Probability Distributionmandalina landy
 
Sampling and Sampling Distributions
Sampling and Sampling DistributionsSampling and Sampling Distributions
Sampling and Sampling Distributions
Jessa Albit
 
Mean Mode & Median
Mean Mode & MedianMean Mode & Median
Mean Mode & Median
Home
 
Z score presnetation
Z score presnetationZ score presnetation
Z score presnetationCarlo Magno
 
Box And Whisker Plots
Box And Whisker PlotsBox And Whisker Plots
Box And Whisker PlotsWendiBrown
 
Frequency distribution
Frequency distributionFrequency distribution
Frequency distribution
metnashikiom2011-13
 
Z scores lecture chapter 2 and 4
Z scores lecture chapter 2 and 4Z scores lecture chapter 2 and 4
Z scores lecture chapter 2 and 4Karen Price
 
Measures of central tendency
Measures of central tendencyMeasures of central tendency
Measures of central tendency
Chie Pegollo
 
Variance and standard deviation
Variance and standard deviationVariance and standard deviation
Variance and standard deviationAmrit Swaroop
 
Normal distribution
Normal distributionNormal distribution
Normal distribution
Roqui Gonzaga
 
Stattistic ii - mode, median, mean
Stattistic ii - mode, median, meanStattistic ii - mode, median, mean
Stattistic ii - mode, median, meanamsy1224
 
Inferential statistics
Inferential statisticsInferential statistics
Inferential statistics
Ashok Kulkarni
 
Sec 3.1 measures of center
Sec 3.1 measures of center  Sec 3.1 measures of center
Sec 3.1 measures of center
Long Beach City College
 

What's hot (20)

2.1 frequency distributions, histograms, and related topics
2.1 frequency distributions, histograms, and related topics2.1 frequency distributions, histograms, and related topics
2.1 frequency distributions, histograms, and related topics
 
Percentiles and Deciles
Percentiles and DecilesPercentiles and Deciles
Percentiles and Deciles
 
Normal distribution
Normal distributionNormal distribution
Normal distribution
 
Day 1 - Measures of Position - Quartiles - Percentiles - ZScores-BoxPlots 2.6...
Day 1 - Measures of Position - Quartiles - Percentiles - ZScores-BoxPlots 2.6...Day 1 - Measures of Position - Quartiles - Percentiles - ZScores-BoxPlots 2.6...
Day 1 - Measures of Position - Quartiles - Percentiles - ZScores-BoxPlots 2.6...
 
Basic Descriptive statistics
Basic Descriptive statisticsBasic Descriptive statistics
Basic Descriptive statistics
 
Chapter 4 260110 044531
Chapter 4 260110 044531Chapter 4 260110 044531
Chapter 4 260110 044531
 
Normal Probability Distribution
Normal Probability DistributionNormal Probability Distribution
Normal Probability Distribution
 
Sampling and Sampling Distributions
Sampling and Sampling DistributionsSampling and Sampling Distributions
Sampling and Sampling Distributions
 
Mean Mode & Median
Mean Mode & MedianMean Mode & Median
Mean Mode & Median
 
Z score presnetation
Z score presnetationZ score presnetation
Z score presnetation
 
Box And Whisker Plots
Box And Whisker PlotsBox And Whisker Plots
Box And Whisker Plots
 
Frequency distribution
Frequency distributionFrequency distribution
Frequency distribution
 
Z scores lecture chapter 2 and 4
Z scores lecture chapter 2 and 4Z scores lecture chapter 2 and 4
Z scores lecture chapter 2 and 4
 
Measures of central tendency
Measures of central tendencyMeasures of central tendency
Measures of central tendency
 
Variance and standard deviation
Variance and standard deviationVariance and standard deviation
Variance and standard deviation
 
Normal distribution
Normal distributionNormal distribution
Normal distribution
 
Stattistic ii - mode, median, mean
Stattistic ii - mode, median, meanStattistic ii - mode, median, mean
Stattistic ii - mode, median, mean
 
Inferential statistics
Inferential statisticsInferential statistics
Inferential statistics
 
The normal distribution
The normal distributionThe normal distribution
The normal distribution
 
Sec 3.1 measures of center
Sec 3.1 measures of center  Sec 3.1 measures of center
Sec 3.1 measures of center
 

Similar to lfstat3e_ppt_01_rev.ppt

chapter1IntroductiontoStatistics.ppt
chapter1IntroductiontoStatistics.pptchapter1IntroductiontoStatistics.ppt
chapter1IntroductiontoStatistics.ppt
MohamedSahal16
 
Chapter 1 biostat
Chapter 1 biostatChapter 1 biostat
Chapter 1 biostat
ayanle maigag
 
Statistics
StatisticsStatistics
Statistics
AreehaRana
 
1.3 Experimental Design
1.3 Experimental Design1.3 Experimental Design
1.3 Experimental Designleblance
 
Chapter 1 introduction to statistics
Chapter 1 introduction to statisticsChapter 1 introduction to statistics
Chapter 1 introduction to statistics
John Carlo Catacutan
 
1.1 An Overview of Statistics
1.1 An Overview of Statistics1.1 An Overview of Statistics
1.1 An Overview of Statisticsleblance
 
introduction to statistical theory
introduction to statistical theoryintroduction to statistical theory
introduction to statistical theory
Unsa Shakir
 
Collecting Quantitative Datafinished
Collecting Quantitative DatafinishedCollecting Quantitative Datafinished
Collecting Quantitative Datafinishedzainab85
 
Data analysis presentation by Jameel Ahmed Qureshi
Data analysis presentation by Jameel Ahmed QureshiData analysis presentation by Jameel Ahmed Qureshi
Data analysis presentation by Jameel Ahmed Qureshi
Jameel Ahmed Qureshi
 
Day 1 - Introduction-To-Statistics.pptx
Day 1 - Introduction-To-Statistics.pptxDay 1 - Introduction-To-Statistics.pptx
Day 1 - Introduction-To-Statistics.pptx
MJGamboa2
 
Stat11t chapter1
Stat11t chapter1Stat11t chapter1
Stat11t chapter1
raylenepotter
 
Stat11t Chapter1
Stat11t Chapter1Stat11t Chapter1
Stat11t Chapter1gueste87a4f
 
practical reporting.pptx
practical reporting.pptxpractical reporting.pptx
practical reporting.pptx
primoboymante
 
BASIC STATISTICAL TREATMENT IN RESEARCH.pptx
BASIC STATISTICAL TREATMENT IN RESEARCH.pptxBASIC STATISTICAL TREATMENT IN RESEARCH.pptx
BASIC STATISTICAL TREATMENT IN RESEARCH.pptx
ardrianmalangen2
 
Statistics lesson 1
Statistics   lesson 1Statistics   lesson 1
Statistics lesson 1Katrina Mae
 
Statistics lesson 1
Statistics   lesson 1Statistics   lesson 1
Statistics lesson 1
Katrina Mae
 
Data analysis powerpoint
Data analysis powerpointData analysis powerpoint
Data analysis powerpointjamiebrandon
 
Introduction To Statistics
Introduction To StatisticsIntroduction To Statistics
Introduction To Statisticsalbertlaporte
 

Similar to lfstat3e_ppt_01_rev.ppt (20)

chapter1IntroductiontoStatistics.ppt
chapter1IntroductiontoStatistics.pptchapter1IntroductiontoStatistics.ppt
chapter1IntroductiontoStatistics.ppt
 
Chapter 1 biostat
Chapter 1 biostatChapter 1 biostat
Chapter 1 biostat
 
Statistics
StatisticsStatistics
Statistics
 
1.3 Experimental Design
1.3 Experimental Design1.3 Experimental Design
1.3 Experimental Design
 
Chapter 1 introduction to statistics
Chapter 1 introduction to statisticsChapter 1 introduction to statistics
Chapter 1 introduction to statistics
 
1.1 An Overview of Statistics
1.1 An Overview of Statistics1.1 An Overview of Statistics
1.1 An Overview of Statistics
 
introduction to statistical theory
introduction to statistical theoryintroduction to statistical theory
introduction to statistical theory
 
Collecting Quantitative Datafinished
Collecting Quantitative DatafinishedCollecting Quantitative Datafinished
Collecting Quantitative Datafinished
 
Data analysis presentation by Jameel Ahmed Qureshi
Data analysis presentation by Jameel Ahmed QureshiData analysis presentation by Jameel Ahmed Qureshi
Data analysis presentation by Jameel Ahmed Qureshi
 
Lect1
Lect1Lect1
Lect1
 
Day 1 - Introduction-To-Statistics.pptx
Day 1 - Introduction-To-Statistics.pptxDay 1 - Introduction-To-Statistics.pptx
Day 1 - Introduction-To-Statistics.pptx
 
Statistics
StatisticsStatistics
Statistics
 
Stat11t chapter1
Stat11t chapter1Stat11t chapter1
Stat11t chapter1
 
Stat11t Chapter1
Stat11t Chapter1Stat11t Chapter1
Stat11t Chapter1
 
practical reporting.pptx
practical reporting.pptxpractical reporting.pptx
practical reporting.pptx
 
BASIC STATISTICAL TREATMENT IN RESEARCH.pptx
BASIC STATISTICAL TREATMENT IN RESEARCH.pptxBASIC STATISTICAL TREATMENT IN RESEARCH.pptx
BASIC STATISTICAL TREATMENT IN RESEARCH.pptx
 
Statistics lesson 1
Statistics   lesson 1Statistics   lesson 1
Statistics lesson 1
 
Statistics lesson 1
Statistics   lesson 1Statistics   lesson 1
Statistics lesson 1
 
Data analysis powerpoint
Data analysis powerpointData analysis powerpoint
Data analysis powerpoint
 
Introduction To Statistics
Introduction To StatisticsIntroduction To Statistics
Introduction To Statistics
 

Recently uploaded

The Impact of Artificial Intelligence on Modern Society.pdf
The Impact of Artificial Intelligence on Modern Society.pdfThe Impact of Artificial Intelligence on Modern Society.pdf
The Impact of Artificial Intelligence on Modern Society.pdf
ssuser3e63fc
 
'Guidance and counselling- role of Psychologist in Guidance and Counselling.
'Guidance and counselling- role of Psychologist in Guidance and Counselling.'Guidance and counselling- role of Psychologist in Guidance and Counselling.
'Guidance and counselling- role of Psychologist in Guidance and Counselling.
PaviBangera
 
Transferable Skills - Your Roadmap - Part 1 and 2 - Dirk Spencer Senior Recru...
Transferable Skills - Your Roadmap - Part 1 and 2 - Dirk Spencer Senior Recru...Transferable Skills - Your Roadmap - Part 1 and 2 - Dirk Spencer Senior Recru...
Transferable Skills - Your Roadmap - Part 1 and 2 - Dirk Spencer Senior Recru...
Dirk Spencer Corporate Recruiter LION
 
一比一原版(TMU毕业证)多伦多都会大学毕业证如何办理
一比一原版(TMU毕业证)多伦多都会大学毕业证如何办理一比一原版(TMU毕业证)多伦多都会大学毕业证如何办理
一比一原版(TMU毕业证)多伦多都会大学毕业证如何办理
yuhofha
 
Personal Brand exploration KE.pdf for assignment
Personal Brand exploration KE.pdf for assignmentPersonal Brand exploration KE.pdf for assignment
Personal Brand exploration KE.pdf for assignment
ragingokie
 
一比一原版(UVic毕业证)维多利亚大学毕业证如何办理
一比一原版(UVic毕业证)维多利亚大学毕业证如何办理一比一原版(UVic毕业证)维多利亚大学毕业证如何办理
一比一原版(UVic毕业证)维多利亚大学毕业证如何办理
pxyhy
 
DIGITAL MARKETING COURSE IN CHENNAI.pptx
DIGITAL MARKETING COURSE IN CHENNAI.pptxDIGITAL MARKETING COURSE IN CHENNAI.pptx
DIGITAL MARKETING COURSE IN CHENNAI.pptx
FarzanaRbcomcs
 
How to create an effective K-POC tutorial
How to create an effective K-POC tutorialHow to create an effective K-POC tutorial
How to create an effective K-POC tutorial
vencislavkaaa
 
How to Master LinkedIn for Career and Business
How to Master LinkedIn for Career and BusinessHow to Master LinkedIn for Career and Business
How to Master LinkedIn for Career and Business
ideatoipo
 
Digital Marketing Training In Bangalore
Digital  Marketing Training In BangaloreDigital  Marketing Training In Bangalore
Digital Marketing Training In Bangalore
nidm599
 
Resumes, Cover Letters, and Applying Online
Resumes, Cover Letters, and Applying OnlineResumes, Cover Letters, and Applying Online
Resumes, Cover Letters, and Applying Online
Bruce Bennett
 
How Mentoring Elevates Your PM Career | PMI Silver Spring Chapter
How Mentoring Elevates Your PM Career | PMI Silver Spring ChapterHow Mentoring Elevates Your PM Career | PMI Silver Spring Chapter
How Mentoring Elevates Your PM Career | PMI Silver Spring Chapter
Hector Del Castillo, CPM, CPMM
 
一比一原版(QU毕业证)皇后大学毕业证如何办理
一比一原版(QU毕业证)皇后大学毕业证如何办理一比一原版(QU毕业证)皇后大学毕业证如何办理
一比一原版(QU毕业证)皇后大学毕业证如何办理
yuhofha
 
labb123456789123456789123456789123456789
labb123456789123456789123456789123456789labb123456789123456789123456789123456789
labb123456789123456789123456789123456789
Ghh
 
原版制作(RMIT毕业证书)墨尔本皇家理工大学毕业证在读证明一模一样
原版制作(RMIT毕业证书)墨尔本皇家理工大学毕业证在读证明一模一样原版制作(RMIT毕业证书)墨尔本皇家理工大学毕业证在读证明一模一样
原版制作(RMIT毕业证书)墨尔本皇家理工大学毕业证在读证明一模一样
atwvhyhm
 
Midterm Contract Law and Adminstration.pptx
Midterm Contract Law and Adminstration.pptxMidterm Contract Law and Adminstration.pptx
Midterm Contract Law and Adminstration.pptx
Sheldon Byron
 
Exploring Career Paths in Cybersecurity for Technical Communicators
Exploring Career Paths in Cybersecurity for Technical CommunicatorsExploring Career Paths in Cybersecurity for Technical Communicators
Exploring Career Paths in Cybersecurity for Technical Communicators
Ben Woelk, CISSP, CPTC
 
Luke Royak's Personal Brand Exploration!
Luke Royak's Personal Brand Exploration!Luke Royak's Personal Brand Exploration!
Luke Royak's Personal Brand Exploration!
LukeRoyak
 
Andrea Kate Portfolio Presentation.pdf
Andrea Kate  Portfolio  Presentation.pdfAndrea Kate  Portfolio  Presentation.pdf
Andrea Kate Portfolio Presentation.pdf
andreakaterasco
 
Full Sail_Morales_Michael_SMM_2024-05.pptx
Full Sail_Morales_Michael_SMM_2024-05.pptxFull Sail_Morales_Michael_SMM_2024-05.pptx
Full Sail_Morales_Michael_SMM_2024-05.pptx
mmorales2173
 

Recently uploaded (20)

The Impact of Artificial Intelligence on Modern Society.pdf
The Impact of Artificial Intelligence on Modern Society.pdfThe Impact of Artificial Intelligence on Modern Society.pdf
The Impact of Artificial Intelligence on Modern Society.pdf
 
'Guidance and counselling- role of Psychologist in Guidance and Counselling.
'Guidance and counselling- role of Psychologist in Guidance and Counselling.'Guidance and counselling- role of Psychologist in Guidance and Counselling.
'Guidance and counselling- role of Psychologist in Guidance and Counselling.
 
Transferable Skills - Your Roadmap - Part 1 and 2 - Dirk Spencer Senior Recru...
Transferable Skills - Your Roadmap - Part 1 and 2 - Dirk Spencer Senior Recru...Transferable Skills - Your Roadmap - Part 1 and 2 - Dirk Spencer Senior Recru...
Transferable Skills - Your Roadmap - Part 1 and 2 - Dirk Spencer Senior Recru...
 
一比一原版(TMU毕业证)多伦多都会大学毕业证如何办理
一比一原版(TMU毕业证)多伦多都会大学毕业证如何办理一比一原版(TMU毕业证)多伦多都会大学毕业证如何办理
一比一原版(TMU毕业证)多伦多都会大学毕业证如何办理
 
Personal Brand exploration KE.pdf for assignment
Personal Brand exploration KE.pdf for assignmentPersonal Brand exploration KE.pdf for assignment
Personal Brand exploration KE.pdf for assignment
 
一比一原版(UVic毕业证)维多利亚大学毕业证如何办理
一比一原版(UVic毕业证)维多利亚大学毕业证如何办理一比一原版(UVic毕业证)维多利亚大学毕业证如何办理
一比一原版(UVic毕业证)维多利亚大学毕业证如何办理
 
DIGITAL MARKETING COURSE IN CHENNAI.pptx
DIGITAL MARKETING COURSE IN CHENNAI.pptxDIGITAL MARKETING COURSE IN CHENNAI.pptx
DIGITAL MARKETING COURSE IN CHENNAI.pptx
 
How to create an effective K-POC tutorial
How to create an effective K-POC tutorialHow to create an effective K-POC tutorial
How to create an effective K-POC tutorial
 
How to Master LinkedIn for Career and Business
How to Master LinkedIn for Career and BusinessHow to Master LinkedIn for Career and Business
How to Master LinkedIn for Career and Business
 
Digital Marketing Training In Bangalore
Digital  Marketing Training In BangaloreDigital  Marketing Training In Bangalore
Digital Marketing Training In Bangalore
 
Resumes, Cover Letters, and Applying Online
Resumes, Cover Letters, and Applying OnlineResumes, Cover Letters, and Applying Online
Resumes, Cover Letters, and Applying Online
 
How Mentoring Elevates Your PM Career | PMI Silver Spring Chapter
How Mentoring Elevates Your PM Career | PMI Silver Spring ChapterHow Mentoring Elevates Your PM Career | PMI Silver Spring Chapter
How Mentoring Elevates Your PM Career | PMI Silver Spring Chapter
 
一比一原版(QU毕业证)皇后大学毕业证如何办理
一比一原版(QU毕业证)皇后大学毕业证如何办理一比一原版(QU毕业证)皇后大学毕业证如何办理
一比一原版(QU毕业证)皇后大学毕业证如何办理
 
labb123456789123456789123456789123456789
labb123456789123456789123456789123456789labb123456789123456789123456789123456789
labb123456789123456789123456789123456789
 
原版制作(RMIT毕业证书)墨尔本皇家理工大学毕业证在读证明一模一样
原版制作(RMIT毕业证书)墨尔本皇家理工大学毕业证在读证明一模一样原版制作(RMIT毕业证书)墨尔本皇家理工大学毕业证在读证明一模一样
原版制作(RMIT毕业证书)墨尔本皇家理工大学毕业证在读证明一模一样
 
Midterm Contract Law and Adminstration.pptx
Midterm Contract Law and Adminstration.pptxMidterm Contract Law and Adminstration.pptx
Midterm Contract Law and Adminstration.pptx
 
Exploring Career Paths in Cybersecurity for Technical Communicators
Exploring Career Paths in Cybersecurity for Technical CommunicatorsExploring Career Paths in Cybersecurity for Technical Communicators
Exploring Career Paths in Cybersecurity for Technical Communicators
 
Luke Royak's Personal Brand Exploration!
Luke Royak's Personal Brand Exploration!Luke Royak's Personal Brand Exploration!
Luke Royak's Personal Brand Exploration!
 
Andrea Kate Portfolio Presentation.pdf
Andrea Kate  Portfolio  Presentation.pdfAndrea Kate  Portfolio  Presentation.pdf
Andrea Kate Portfolio Presentation.pdf
 
Full Sail_Morales_Michael_SMM_2024-05.pptx
Full Sail_Morales_Michael_SMM_2024-05.pptxFull Sail_Morales_Michael_SMM_2024-05.pptx
Full Sail_Morales_Michael_SMM_2024-05.pptx
 

lfstat3e_ppt_01_rev.ppt

  • 2. § 1.1 An Overview of Statistics
  • 3. Larson & Farber, Elementary Statistics: Picturing the World, 3e 3 Data and Statistics Data consists of information coming from observations, counts, measurements, or responses. Statistics is the science of collecting, organizing, analyzing, and interpreting data in order to make decisions. A population is the collection of all outcomes, responses, measurement, or counts that are of interest. A sample is a subset of a population.
  • 4. Larson & Farber, Elementary Statistics: Picturing the World, 3e 4 Populations & Samples Example: In a recent survey, 250 college students at Union College were asked if they smoked cigarettes regularly. 35 of the students said yes. Identify the population and the sample. Responses of all students at Union College (population) Responses of students in survey (sample)
  • 5. Larson & Farber, Elementary Statistics: Picturing the World, 3e 5 Parameters & Statistics A parameter is a numerical description of a population characteristic. A statistic is a numerical description of a sample characteristic. Parameter Population Statistic Sample
  • 6. Larson & Farber, Elementary Statistics: Picturing the World, 3e 6 Parameters & Statistics Example: Decide whether the numerical value describes a population parameter or a sample statistic. a.) A recent survey of a sample of 450 college students reported that the average weekly income for students is $325. Because the average of $325 is based on a sample, this is a sample statistic. b.) The average weekly income for all students is $405. Because the average of $405 is based on a population, this is a population parameter.
  • 7. Larson & Farber, Elementary Statistics: Picturing the World, 3e 7 Branches of Statistics The study of statistics has two major branches: descriptive statistics and inferential statistics. Statistics Descriptive statistics Inferential statistics Involves the organization, summarization, and display of data. Involves using a sample to draw conclusions about a population.
  • 8. Larson & Farber, Elementary Statistics: Picturing the World, 3e 8 Descriptive and Inferential Statistics Example: In a recent study, volunteers who had less than 6 hours of sleep were four times more likely to answer incorrectly on a science test than were participants who had at least 8 hours of sleep. Decide which part is the descriptive statistic and what conclusion might be drawn using inferential statistics. The statement “four times more likely to answer incorrectly” is a descriptive statistic. An inference drawn from the sample is that all individuals sleeping less than 6 hours are more likely to answer science question incorrectly than individuals who sleep at least 8 hours.
  • 10. Larson & Farber, Elementary Statistics: Picturing the World, 3e 10 Types of Data Data sets can consist of two types of data: qualitative data and quantitative data. Data Qualitative Data Quantitative Data Consists of attributes, labels, or nonnumerical entries. Consists of numerical measurements or counts.
  • 11. Larson & Farber, Elementary Statistics: Picturing the World, 3e 11 Qualitative and Quantitative Data Example: The grade point averages of five students are listed in the table. Which data are qualitative data and which are quantitative data? Student GPA Sally 3.22 Bob 3.98 Cindy 2.75 Mark 2.24 Kathy 3.84 Quantitative data Qualitative data
  • 12. Larson & Farber, Elementary Statistics: Picturing the World, 3e 12 Levels of Measurement The level of measurement determines which statistical calculations are meaningful. The four levels of measurement are: nominal, ordinal, interval, and ratio. Levels of Measurement Nominal Ordinal Interval Ratio Lowest to highest
  • 13. Larson & Farber, Elementary Statistics: Picturing the World, 3e 13 Nominal Level of Measurement Data at the nominal level of measurement are qualitative only. Levels of Measurement Nominal Calculated using names, labels, or qualities. No mathematical computations can be made at this level. Colors in the US flag Names of students in your class Textbooks you are using this semester
  • 14. Larson & Farber, Elementary Statistics: Picturing the World, 3e 14 Ordinal Level of Measurement Data at the ordinal level of measurement are qualitative or quantitative. Levels of Measurement Arranged in order, but differences between data entries are not meaningful. Class standings: freshman, sophomore, junior, senior Numbers on the back of each player’s shirt Ordinal Top 50 songs played on the radio
  • 15. Larson & Farber, Elementary Statistics: Picturing the World, 3e 15 Interval Level of Measurement Data at the interval level of measurement are quantitative. A zero entry simply represents a position on a scale; the entry is not an inherent zero. Levels of Measurement Arranged in order, the differences between data entries can be calculated. Temperatures Years on a timeline Interval Atlanta Braves World Series victories
  • 16. Larson & Farber, Elementary Statistics: Picturing the World, 3e 16 Ratio Level of Measurement Data at the ratio level of measurement are similar to the interval level, but a zero entry is meaningful. Levels of Measurement A ratio of two data values can be formed so one data value can be expressed as a ratio. Ages Grade point averages Ratio Weights
  • 17. Larson & Farber, Elementary Statistics: Picturing the World, 3e 17 Summary of Levels of Measurement No No No Yes Nominal No No Yes Yes Ordinal No Yes Yes Yes Interval Yes Yes Yes Yes Ratio Determine if one data value is a multiple of another Subtract data values Arrange data in order Put data in categories Level of measurement
  • 19. Larson & Farber, Elementary Statistics: Picturing the World, 3e 19 Designing a Statistical Study GUIDELINES 1. Identify the variable(s) of interest (the focus) and the population of the study. 2. Develop a detailed plan for collecting data. If you use a sample, make sure the sample is representative of the population. 3. Collect the data. 4. Describe the data. 5. Interpret the data and make decisions about the population using inferential statistics. 6. Identify any possible errors.
  • 20. Larson & Farber, Elementary Statistics: Picturing the World, 3e 20 Methods of Data Collection In an observational study, a researcher observes and measures characteristics of interest of part of a population. In an experiment, a treatment is applied to part of a population, and responses are observed. A simulation is the use of a mathematical or physical model to reproduce the conditions of a situation or process. A survey is an investigation of one or more characteristics of a population. A census is a measurement of an entire population. A sampling is a measurement of part of a population.
  • 21. Larson & Farber, Elementary Statistics: Picturing the World, 3e 21 Stratified Samples A stratified sample has members from each segment of a population. This ensures that each segment from the population is represented. Freshmen Sophomores Juniors Seniors
  • 22. Larson & Farber, Elementary Statistics: Picturing the World, 3e 22 Cluster Samples A cluster sample has all members from randomly selected segments of a population. This is used when the population falls into naturally occurring subgroups. The city of Clarksville divided into city blocks. All members in each selected group are used.
  • 23. Larson & Farber, Elementary Statistics: Picturing the World, 3e 23 Systematic Samples A systematic sample is a sample in which each member of the population is assigned a number. A starting number is randomly selected and sample members are selected at regular intervals. Every fourth member is chosen.
  • 24. Larson & Farber, Elementary Statistics: Picturing the World, 3e 24 Convenience Samples A convenience sample consists only of available members of the population. Example: You are doing a study to determine the number of years of education each teacher at your college has. Identify the sampling technique used if you select the samples listed. 1.) You randomly select two different departments and survey each teacher in those departments. 2.) You select only the teachers you currently have this semester. 3.) You divide the teachers up according to their department and then choose and survey some teachers in each department. Continued.
  • 25. Larson & Farber, Elementary Statistics: Picturing the World, 3e 25 Identifying the Sampling Technique Example continued: You are doing a study to determine the number of years of education each teacher at your college has. Identify the sampling technique used if you select the samples listed. 1.) This is a cluster sample because each department is a naturally occurring subdivision. 2.) This is a convenience sample because you are using the teachers that are readily available to you. 3.) This is a stratified sample because the teachers are divided by department and some from each department are randomly selected.