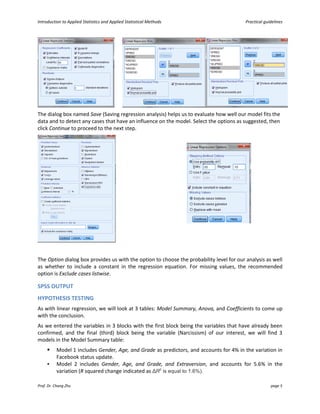
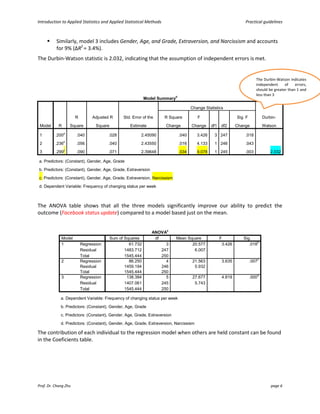
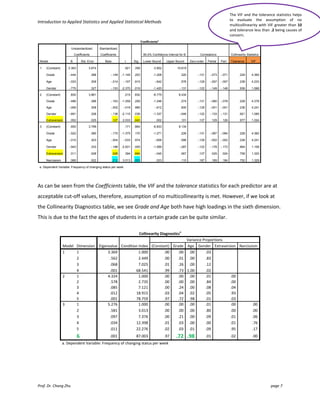
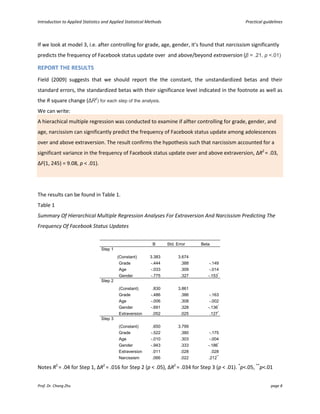
This document provides an introduction and guidelines for linear and multiple regression analyses. It discusses key aspects of each analysis including examining outputs such as model summaries, ANOVA tables, and coefficients. For multiple regression, it recommends a hierarchical approach, entering demographic variables in the first block, extraversion in the second, and narcissism in the third to test if narcissism predicts social media use over and above other factors. The output would show if narcissism explains a significant unique amount of variance in the outcome.
COMPARISION OF PERCENTAGE ERROR BY USING IMPUTATION METHOD ON MID TERM EXAMIN...ijiert bestjournal
The issue of incomplete data exists across the enti re field of data mining. In this paper,Mean Imputation,Median Imputation and Standard Dev iation Imputation are used to deal with challenges of incomplete data on classifi cation problems. By using different imputation methods converts incomplete dataset in t o the complete dataset. On complete dataset by applying the suitable Imputatio n Method and comparing the percentage error of Imputation Method and comparing the result
INFLUENCE OF DATA GEOMETRY IN RANDOM SUBSET FEATURE SELECTIONIJDKP
The geometry of data, also known as probability distribution, is an important consideration for accurate computation of data mining tasks, such as pre-processing, classification and interpretation. The data geometry influences outcome and accuracy of the statistical analysis to a large extent. The current paper focuses on, understanding the influence of data geometry in the feature subset selection process using random forest algorithm. In practice, it is assumed that the data follows normal distribution and most of the time, it may not be true. The dimensionality reduction varies, due to change in the distribution of the data. A comparison is made using three standard distributions such as Triangular, Uniform and Normal Distribution. The results are discussed in this paper.
Modified hotelling’s 푻 ퟐ control charts using modified mahalanobis distance IJECEIAES
This paper proposed new adjusted Hotelling’s T 2 control chart for individual observations. For this objective, bootstrap method for producing the individual observations were employed. To do so, both arithmetic mean vector and the covariance matrix in the traditional Hotelling’s T chart were substituted by the trimmed mean vector and the covariance matrix of the robust scale estimators Q , respectively which, in turn, its performance is carried out by simulated. In fact, the calculation of false alarms and the probability of detection outlier is used for determining the validity of this modified chart. The findings revealed a considerable significance in its performance. n 2
SheffieldR July Meeting - Multiple Imputation with Chained Equations (MICE) p...Paul Richards
Presentation given by Rich Jacques, talking thorough the use of the package "mice", which eases the pain of doing multiple imputations for analysis with incomplete datasets
On Confidence Intervals Construction for Measurement System Capability Indica...IRJESJOURNAL
Abstract: There are many criteria that have been proposed to determine the capability of a measurement system, all based on estimates of variance components. Some of them are the Precision to Tolerance Ratio, the Signal to Noise Ratio and the probabilities of misclassification. For most of these indicators, there are no exact confidence intervals, since the exact distributions of the point estimators are not known. In such situations, two approaches are widely used to obtain approximate confidence intervals: the Modified Large Samples (MLS) methods initially proposed by Graybill and Wang, and the construction of Generalized Confidence Intervals (GCI) introduced by Weerahandi. In this work we focus on the construction of the confidence intervals by the generalized approach in the context of Gauge repeatability and reproducibility studies. Since GCI are obtained by simulation procedures, we analyze the effect of the number of simulations on the variability of the confidence limits as well as the effect of the size of the experiment designed to collect data on the precision of the estimates. Both studies allowed deriving some practical implementation guidelinesin the use of the GCI approach. We finally present a real case study in which this technique was applied to evaluate the capability of a destructive measurement system.
Data Mining is an analytic process designed to explore data in search of consistent patterns and systematic relationships between variables, and then to validate the results by applying the patterns found to a new subset of data. Data mining is often described as the process of discovering patterns, correlations, trends or relationships by searching through a large amount of data stored in repositories, databases, and data warehouses. Diabetes, often referred to by doctors as diabetes mellitus, describes a group of metabolic diseases in which the person has high blood [3] glucose (blood sugar), either because insulin production is insufficient, or because the body's cells do not respond properly to insulin, or both. This project helps in identifying whether a person has diabetes or not, if predicted diabetic[4] the project suggest measures for maintaining normal health and if not diabetic it predicts the risk of getting diabetic. In this project Classification algorithm was used to classify the Pima Indian diabetes dataset. Results have been obtained using Android Application.
Imputation techniques for missing data in clinical trialsNitin George
Missing data are unavoidable in clinical and epidemiological researches. Missing data leads to bias and loss of information in research analysis. Usually we are not aware of missing data techniques because we are depending on some software’s. The objective of this seminar is to introduce different missing data mechanisms and imputation techniques for missing data with the help of examples.
The Indian Dental Academy is the Leader in continuing dental education , training dentists in all aspects of dentistry and
offering a wide range of dental certified courses in different formats.for more details please visit
www.indiandentalacademy.com
Chi‑square Test and its Application in Hypothesis Testing
Rakesh Rana, Richa Singhal
Statistical Section, Central Council for Research in Ayurvedic Sciences, Ministry of AYUSH, GOI, New Delhi, India
A new sdm classifier using jaccard mining procedure case study rheumatic feve...ijbbjournal
In this paper, a new Statistical Data Mining (SDM) technique is proposed using Jaccard Mining Procedure
(JMP) contributing a novel classifier & predictor by applying very effective stages on the training data
depending on Jaccard (J) distance matrix Linked with the Gini Index Measure as precision measure for
initiating a new classifier and a new predictor, The proposed SDM technique using JMP is applied and
examined on a Rheumatic Fever Data to demonstrate its applicability.
A New SDM Classifier Using Jaccard Mining Procedure (CASE STUDY: RHEUMATIC FE...Soaad Abd El-Badie
In this paper, a new Statistical Data Mining (SDM) technique is proposed using Jaccard Mining Procedure (JMP) contributing a novel classifier & predictor by applying very effective stages on the training and testing data depending on Jaccard (J) distance matrix Linked with the Gini Index Measure as precision measure for initiating a new classifier and a new predictor, The proposed SDM technique using JMP is applied and examined on a Rheumatic Fever Data to demonstrate its applicability.
International Journal of Mathematics and Statistics Invention (IJMSI) is an international journal intended for professionals and researchers in all fields of computer science and electronics. IJMSI publishes research articles and reviews within the whole field Mathematics and Statistics, new teaching methods, assessment, validation and the impact of new technologies and it will continue to provide information on the latest trends and developments in this ever-expanding subject. The publications of papers are selected through double peer reviewed to ensure originality, relevance, and readability. The articles published in our journal can be accessed online.
4. Performed statistical analysis on a chosen data table and understood relationship amongst different data fields using IBM SPSS software.
Methodologies: Multi linear regression, Logistic linear regression
IBM SPSS
Running head DATA ANALYSIS1DATA ANALYSIS 7Dat.docxhealdkathaleen
Running head: DATA ANALYSIS 1
DATA ANALYSIS 7
Data Analysis
Tammie Witcher
Columbia Southern University
Data Analysis: Descriptive Statistics and Assumption Testing
Details of how data is collected and analyzed is presented here. The research that led to the achievement of Sun Coast objectives was done using quantitative research methods since they offer detailed insights pertaining to the study. Research design is the specific type of study that one would conduct and is usually consistent with one’s philosophical worldview and the methodological approach the researcher chooses
Correlation: Descriptive Statistics and Assumption Testing
Frequency distribution table
Histogram.
Descriptive statistics table.
Measurement scale. Causal-comparative research methods which was sometimes combined with the descriptive statistics one (Creswell & Creswell, 2018). The former was used to find the relationship between dependent and independent variables after the occurrence of any action in Sun Coast.
Measure of central tendency. The measure of central tendency majored on the mode even though both mean and median were employed for the frequency table to justify various aspects tested in the research.
Evaluation. Sun Coast’s leadership and other business objectives could render descriptive statistics significant since the researchers could use the past figures to analyze the current ones and make a sound forecast of future organizational performance.
Simple Regression: Descriptive Statistics and Assumption Testing
Frequency distribution table.
Histogram.
Descriptive statistics table.
Measurement scale. Regression analysis procedure would be appropriate for RQ3 since the variable, DB levels of work would be predicted before placing employees on-site for future contracts. There is no independent sample among those provided by this RQ.
Measure of central tendency. The measure of central tendency majored on the mode even though both mean and median were employed for the frequency table to justify various aspects tested in the research.
Evaluation. DB levels of work would be predicted before placing employees on-site for future contracts. There is no independent sample among those provided by this RQ.
Multiple Regression: Descriptive Statistics and Assumption Testing
Frequency distribution table.
Histogram.
Descriptive statistics table.
Measurement scale. The measurement for this case applied the regression procedure to use to test different hypotheses since the interest is whether a relationship exists between an independent variable (IV) and dependent variable (DV). Correlation will indicate if there is a relationship between PM size (IV) and the employee health (DV) and the magnitude of that impact if at all there is one
Measure of central tendency. The measure of central tendency majored on the mode even though both mean and median were also used.
Evaluation. The outcomeinvolved dividing populations in Sun Coa ...
I am Joshua M. I am a Statistics Assignment Expert at statisticsassignmenthelp.com. I hold a Masters in Statistics from, Michigan State University, USA
I have been helping students with their homework for the past 5 years. I solve assignments related to Statistics.
Visit statisticsassignmenthelp.com or email info@statisticsassignmenthelp.com.
You can also call on +1 678 648 4277 for any assistance with Statistics Assignments.
Penalized Regressions with Different Tuning Parameter Choosing Criteria and t...CSCJournals
Recently a great deal of attention has been paid to modern regression methods such as penalized regressions which perform variable selection and coefficient estimation simultaneously, thereby providing new approaches to analyze complex data of high dimension. The choice of the tuning parameter is vital in penalized regression. In this paper, we studied the effect of different tuning parameter choosing criteria on the performances of some well-known penalization methods including ridge, lasso, and elastic net regressions. Specifically, we investigated the widely used information criteria in regression models such as Bayesian information criterion (BIC), Akaike’s information criterion (AIC), and AIC correction (AICc) in various simulation scenarios and a real data example in economic modeling. We found that predictive performance of models selected by different information criteria is heavily dependent on the properties of a data set. It is hard to find a universal best tuning parameter choosing criterion and a best penalty function for all cases. The results in this research provide reference for the choices of different criteria for tuning parameter in penalized regressions for practitioners, which also expands the nascent field of applications of penalized regressions.
Innovative sample size methods for adaptive clinical trials webinar web ver...nQuery
View the video here:
https://www.statsols.com/webinar/innovative-sample-size-methods-for-adaptive-clinical-trials
Given the high failure rates and the increased costs of clinical trials, researchers need innovative design strategies to best optimize financial resources and reduce the risk to patients.
Adaptive designs are emerging as a way to reduce risk and cost associated with clinical trials. The FDA recently published guidance (Innovative Cures Act) and are actively encouraging sponsors to use Adaptive trials.
Adaptive design is a clinical trial design that allows adaptations or modifications to aspects of the trial after its initiation without undermining the validity and integrity of the trial.
In this webinar, Ronan will demonstrate nQuery's new Adaptive module focusing on Sample Size Re-Estimation & Group-Sequential Design.
In this webinar you will learn about:
The pros and cons of adaptive designs
Sample Size Re-Estimation
Group-Sequential Design
Conditional Power
Predictive Power
A Two Stage Estimator of Instrumental Variable Quantile Regression for Panel ...ijtsrd
This paper proposes a two stage instrumental variable quantile regression 2S IVQR estimation to estimate the time invariant effects in panel data model. In the first stage, we introduce the dummy variables to represent the time invariant effects, and use quantile regression to estimate effects of individual covariates. The advantage of the first stage is that it can reduce calculations and the number of estimation parameters. Then in the second stage, we adapt instrument variables approach and 2SLS method. In addition, we present a proof of 2S IVQR estimators large sample properties. Monte Carlo simulation study shows that with increasing sample size, the Bias and RMSE of our estimator are decreased. Besides, our estimator has lower Bias and RMSE than those of the other two estimators. Tao Li "A Two-Stage Estimator of Instrumental Variable Quantile Regression for Panel Data with Time-Invariant Effects" Published in International Journal of Trend in Scientific Research and Development (ijtsrd), ISSN: 2456-6470, Volume-5 | Issue-6 , October 2021, URL: https://www.ijtsrd.com/papers/ijtsrd47716.pdf Paper URL : https://www.ijtsrd.com/other-scientific-research-area/other/47716/a-twostage-estimator-of-instrumental-variable-quantile-regression-for-panel-data-with-timeinvariant-effects/tao-li
Running head: LOGISTIC REGRESSION 1
LOGISTIC REGRESSION 2
Logistic Regression
Student Name
Institution
Course
Instructor
Date
Question (a)
Categorical variables are useful in classifying data that usually takes only one form. An example where categorical variables can be used is when classifying the ages of different individual based on the gender of the participants. The use of n-1 variable in categorical variables makes the classification easier since variables take either of the quantitative provided. In these situations, the variables are limited to take either one or zero as the quantitative value to ease the classification process (Bühlmann & Dezeure, 2016). Classification based on n-1 variable tends to be faster and also saves time and does not have many problems. When a particular variable takes 1 is assumed to be quantitative but when it takes zero the assumption made is that the variable is absent. Categorical variables involving n variables, the n-1 variables are the only important variables since they classify the data given accordingly to the required quantitative values which I either 1 or 0.
Classification of information based on categorical valuables, the n variables tend to have problems. The n value can sometimes lead to problems that may end up prolonging the classification process and also make it difficult. The n variable has problem in resulting to multi-co linearity in classifying (Guo & Berkhahn, 2016). The problem results when there is similar interconnections between the variables this create a problem in interpreting the information. The interconnection of the n variables can result in the prediction of the other variable from the other. Another problem resulting in from categorical variables is that n variable is intuitively meaning that variables can be classified based on the interests or feelings of the research. Lastly, the n variables are redundant that is do not have updated information.
Question (b)
In statistics, logistic regressions are used in classification of variable that tend to have different forms either positive or negative values. Logistic regressions classify data consisting of dependent variables with and more than two or more independent variables. The classifications are based on pacing several variables at their different level of existence (van Smeden et al., 2016). Logistic regression predict the relationship of variables that can either take 1or 0 in the classification. Logistic regressions is concerned in giving descriptions to the data and give detailed information relationship between one independent variable and more nominal independent variables. For instance, logistic regression can be used in financial institutions to clarify financial defaulters. In classification of the data, logistic re.
UNDERSTANDING LEAST ABSOLUTE VALUE IN REGRESSION-BASED DATA MININGIJDKP
This article advances our understanding of regression-based data mining by comparing the utility of Least
Absolute Value (LAV) and Least Squares (LS) regression methods. Using demographic variables from
U.S. state-wide data, we fit variable regression models to dependent variables of varying distributions
using both LS and LAV. Forecasts generated from the resulting equations are used to compare the
performance of the regression methods under different dependent variable distribution conditions. Initial
findings indicate LAV procedures better forecast in data mining applications when the dependent variable
is non-normal. Our results differ from those found in prior research using simulated data.
POSTERIOR RESOLUTION AND STRUCTURAL MODIFICATION FOR PARAMETER DETERMINATION ...IJCI JOURNAL
When only a few lower modes data are available to evaluate a large number of unknown parameters, it is
difficult to acquire information about all unknown parameters. The challenge in this kind of updation
problem is first to get confidence about the parameters that are evaluated correctly using the available
data and second to get information about the remaining parameters. In this work, the first issue is resolved
employing the sensitivity of the modal data used for updation. Once it is fixed that which parameters are
evaluated satisfactorily using the available modal data the remaining parameters are evaluated employing
modal data of a virtual structure. This virtual structure is created by adding or removing some known
stiffness to or from some of the stories of the original structure. A 12-story shear building is considered for
the numerical illustration of the approach. Results of the study show that the present approach is an
effective tool in system identification problem when only a few data is available for updation.
A personal statistical analysis that I conducted in S.P.S.S. and the R programming language. A logistic regression was performed in order to investigate which myopic factors are the most significant.
Similar to Lecture 6 guidelines_and_assignment (20)
1. Introduction to Applied Statistics and Applied Statistical Methods Practical guidelines
Prof. Dr. Chang Zhu page 1
Table of Contents
LECTURE 6 .....................................................................................................................................................2
LINEAR REGRESSION .....................................................................................................................................2
MULTIPLE REGRESSION.................................................................................................................................3
SPSS OUTPUT ............................................................................................................................................5
HYPOTHESIS TESTING................................................................................................................................5
REPORT THE RESULTS ...............................................................................................................................8
MODEL GENERALIZATION.........................................................................................................................9
ASSIGNMENT 6............................................................................................................................................13
References ..................................................................................................................................................13
2. Introduction to Applied Statistics and Applied Statistical Methods Practical guidelines
Prof. Dr. Chang Zhu page 2
LECTURE 6
LINEAR REGRESSION
We use linear regression when we want to know the relationship between 2 variables. One of them is
call the independent (predictor) variable and the other dependent (outcome) variable.
e.g. we want to know if the time spent to study Statistics will predict one’s score in the course.
The data file is named study_time.sav
In SPSS, choose Analyse > Regression > Linear
Move the Exam_scores to the Dependent box and the Hours variable to the Independent(s) box.
Click OK to run the analysis.
In the output, we should look first at the Model Summary table. In linear regression, the R value (R
= .827) is simply the Pearson correlation coefficient between two variables. The R square (R2
= .684) is
used in percentage to inteprete the variation in the outcome variable (the exam score): It shows that the
number of hours spent on studying accounts for 68.4% of variation in the exam scores.
Model Summaryb
Model R R Square Adjusted R Square
Std. Error of the
Estimate
1 .827a
.684 .666 9.411
a. Predictors: (Constant), Hours
b. Dependent Variable: Exam_scores
The F-statistic that tests whether the model has improved the prediction of the outcome in compared to
one that uses the mean as the predicted value, which can be found in the ANOVA table, F = 38.959, p
< .01.
ANOVAa
Model Sum of Squares df Mean Square F Sig.
1 Regression 3450.712 1 3450.712 38.959 .000b
Residual 1594.308 18 88.573
Total 5045.020 19
a. Dependent Variable: Exam_scores
b. Predictors: (Constant), Hours
3. Introduction to Applied Statistics and Applied Statistical Methods Practical guidelines
Prof. Dr. Chang Zhu page 3
The model parameters can be found in the Coefficients table. The constant (b0) is to mean that when no
hours is spent on studyding, the predicted exam score would be 12.762. The next b value (usually called
b1 in the equation) is 2.391 can be explaied such that for one unit of change (one hour) in the number of
hours studying, the model predicts that an increase of 2.391 in the exam score will be observed.
We can report the result as follows:
A linear regression analysis revealed that the number of hours spent studying was a highly significant
predictor of exam scores ( = .2.391, p = < .01), accounting for 68.4% of the variance in exam scores.
MULTIPLE REGRESSION
This example is taken from a real research study conducted by (Ong, Ho, Lim, Goh, Lee, & Chua, 2011).
The study can be summarized as follow:
The authors want to examine the relationship between narcissism (“characterized by a highly inflated,
positive but unrealistic self-concept, a lack of interest in forming strong interpersonal relationships, and
an engagement in self-regulatory strategies to affirm the positive self-views”, Campbell & Foster, 2007
cited in Ong et al., 2011) and behavior on Facebook in adolescents from grade 7 to 9 (n= 275). They
measured the Age, Gender, and Grade (at school), extraversion and narcissism.
Extraversion is measured by using the 12-item Extraversion subscale of the NEO Five-Factor Inventory
(NEO-FFI, Costa & McCrae, 1992a)
Narcissism is measured by 12-item Narcissistic Personality Questionnaire for Children-Revised (NPQC-
R, Ang & Raine, 2009).
The outcome variable is named FB_status, which is measured by how often the participants update their
status per week.
They hypothesized that narcissism would predict, above and beyond the other variables, the frequency
of status updates.
The data file is named narcissism.sav, which is adapted from Field (2013).
Coefficients
a
Model
Unstandardized Coefficients
Standardized
Coefficients
t Sig.
95.0% Confidence Interval for B
B Std. Error Beta Lower Bound Upper Bound
1 (Constant) 12.762 8.276 1.542 .140 -4.625 30.150
Hours 2.391 .383 .827 6.242 .000 1.586 3.196
a. Dependent Variable: Exam_scores
4. Introduction to Applied Statistics and Applied Statistical Methods Practical guidelines
Prof. Dr. Chang Zhu page 4
Observation:
The study’s hypothesis is that:
H1: Narcissism will predict a higher frequency of updating Facebook status over and above extraversion.
which means the authors want to find out if narcisissism can explain more unique variation in the
freqency of Facebook status update among adolescents, after controlling for demographic information
(age, gender, and grade), and extraversion.
Therefore, we will opt for a hierarchical regression where age, gender, and grade will be entered in the
first block, extraversion in the second block, and finally, narcissism in the third block.
In SPSS, choose Analyse > Regression > Linear
First move the outcome variable FB_Status to the Dependent box.
The first block of Independent(s) variables will consist of Grade, Age, and Gender. Click to access
the second block so as to enter the Extraversion variable.
After that, click Next to access block 3, and move the variable Narcissism to the Independent(s) box.
Then click on the Statistics button to select the analysis options as below.
Click on Continue to proceed to the next step.
The options offered by SPSS in the Plots and Save tabs are mainly for assumptions testing.
In the Plots: when we plot the ZRESID (standardized residuals) on the Y-axis against the ZPRED
(standardized predicted values) on the X-axis, we can determine whether the assumptions of random
errors and homoscedascity have been met. So we will move the ZPRED and the ZRESID to the X-axis and
the Y-axis, respectively as illustrated.
Field (2009) also suggests to plot the SRESID (Studentized residuals) on the Y-axis against the ZPRED
(standardized predicted values) on the X-axis because the graph will be more case-by-case basis. To do
this, we click Next, and move the ZPRED and the SRESID to the X-axis and the Y-axis accordingly.
Click Continue to proceed to the next step.
5. Introduction to Applied Statistics and Applied Statistical Methods Practical guidelines
Prof. Dr. Chang Zhu page 5
The dialog box named Save (Saving regression analysis) helps us to evaluate how well our model fits the
data and to detect any cases that have an influence on the model. Select the options as suggested, then
click Continue to proceed to the next step.
The Option dialog box provides us with the option to choose the probability level for our analysis as well
as whether to include a constant in the regression equation. For missing values, the recommended
option is Exclude cases listwise.
SPSS OUTPUT
HYPOTHESIS TESTING
As with linear regression, we will look at 3 tables: Model Summary, Anova, and Coefficients to come up
with the conclusion.
As we entered the variables in 3 blocks with the first block being the variables that have already been
confirmed, and the final (third) block being the variable (Narcissism) of our interest, we will find 3
models in the Model Summary table:
Model 1 includes Gender, Age, and Grade as predictors, and accounts for 4% in the variation in
Facebook status update.
Model 2 includes Gender, Age, and Grade, and Extraversion, and accounts for 5.6% in the
variation (R squared change indicated as ΔR2
is equal to 1.6%).
6. Introduction to Applied Statistics and Applied Statistical Methods Practical guidelines
Prof. Dr. Chang Zhu page 6
Similarly, model 3 includes Gender, Age, and Grade, Extraversion, and Narcissism and accounts
for 9% (ΔR2
= 3.4%).
The Durbin-Watson statistic is 2.032, indicating that the assumption of independent errors is met.
Model Summaryd
Model R
R
Square
Adjusted R
Square
Std. Error of the
Estimate
Change Statistics
Durbin-
Watson
R Square
Change
F
Change df1 df2
Sig. F
Change
1 .200a
.040 .028 2.45090 .040 3.426 3 247 .018
2 .236b
.056 .040 2.43550 .016 4.133 1 246 .043
3 .299c
.090 .071 2.39648 .034 9.078 1 245 .003 2.032
a. Predictors: (Constant), Gender, Age, Grade
b. Predictors: (Constant), Gender, Age, Grade, Extraversion
c. Predictors: (Constant), Gender, Age, Grade, Extraversion, Narcissism
d. Dependent Variable: Frequency of changing status per week
The ANOVA table shows that all the three models significantly improve our ability to predict the
outcome (Facebook status update) compared to a model based just on the mean.
ANOVAa
Model Sum of Squares df Mean Square F Sig.
1 Regression 61.732 3 20.577 3.426 .018b
Residual 1483.712 247 6.007
Total 1545.444 250
2 Regression 86.250 4 21.563 3.635 .007c
Residual 1459.194 246 5.932
Total 1545.444 250
3 Regression 138.384 5 27.677 4.819 .000d
Residual 1407.061 245 5.743
Total 1545.444 250
a. Dependent Variable: Frequency of changing status per week
b. Predictors: (Constant), Gender, Age, Grade
c. Predictors: (Constant), Gender, Age, Grade, Extraversion
d. Predictors: (Constant), Gender, Age, Grade, Extraversion, Narcissism
The contribution of each individual to the regression model when others are held constant can be found
in the Coeficients table.
The Durbin-Watson indicates
independent of errors,
should be greater than 1 and
less than 3
7. Introduction to Applied Statistics and Applied Statistical Methods Practical guidelines
Prof. Dr. Chang Zhu page 7
As can be seen from the Coefficients table, the VIF and the tolerance statistics for each predictor are at
acceptable cut-off values, therefore, assumption of no multicollinearity is met. However, if we look at
the Collinearity Diagnostics table, we see Grade and Age both have high loadings in the sixth dimension.
This is due to the fact the ages of students in a certain grade can be quite similar.
Collinearity Diagnosticsa
Model Dimension Eigenvalue Condition Index
Variance Proportions
(Constant) Grade Age Gender Extraversion Narcissism
1 1 3.369 1.000 .00 .00 .00 .03
2 .562 2.449 .00 .01 .00 .83
3 .068 7.025 .01 .26 .00 .12
4 .001 68.541 .99 .73 1.00 .02
2 1 4.324 1.000 .00 .00 .00 .01 .00
2 .578 2.735 .00 .00 .00 .84 .00
3 .085 7.121 .00 .24 .00 .08 .04
4 .012 18.915 .03 .04 .02 .05 .93
5 .001 78.759 .97 .72 .98 .01 .03
3 1 5.276 1.000 .00 .00 .00 .01 .00 .00
2 .581 3.013 .00 .00 .00 .80 .00 .00
3 .097 7.376 .00 .21 .00 .09 .01 .06
4 .034 12.398 .01 .03 .00 .00 .01 .76
5 .011 22.276 .02 .03 .01 .09 .95 .17
6 .001 87.003 .97 .72 .98 .01 .02 .00
a. Dependent Variable: Frequency of changing status per week
Coefficientsa
Model
Unstandardized
Coefficients
Standardized
Coefficients
t Sig.
95.0% Confidence Interval for B Correlations Collinearity Statistics
B Std. Error Beta Lower Bound Upper Bound Zero-order Partial Part Tolerance VIF
1 (Constant) 3.383 3.674 .921 .358 -3.852 10.619
Grade -.444 .388 -.149 -1.145 .253 -1.208 .320 -.131 -.073 -.071 .229 4.365
Age -.033 .309 -.014 -.107 .915 -.642 .576 -.129 -.007 -.007 .236 4.233
Gender -.775 .327 -.153 -2.370 .019 -1.420 -.131 -.122 -.149 -.148 .936 1.068
2 (Constant) .830 3.861 .215 .830 -6.775 8.434
Grade -.486 .386 -.163 -1.259 .209 -1.246 .274 -.131 -.080 -.078 .228 4.378
Age -.006 .308 -.002 -.019 .985 -.612 .600 -.129 -.001 -.001 .236 4.241
Gender -.691 .328 -.136 -2.110 .036 -1.337 -.046 -.122 -.133 -.131 .921 1.085
Extraversion .052 .025 .127 2.033 .043 .002 .101 .137 .129 .126 .977 1.024
3 (Constant) .650 3.799 .171 .864 -6.833 8.134
Grade -.522 .380 -.175 -1.375 .170 -1.271 .226 -.131 -.087 -.084 .228 4.382
Age -.010 .303 -.004 -.033 .974 -.606 .586 -.129 -.002 -.002 .236 4.241
Gender -.943 .333 -.186 -2.831 .005 -1.599 -.287 -.122 -.178 -.173 .864 1.158
Extraversion .011 .028 .028 .394 .694 -.045 .067 .137 .025 .024 .758 1.320
Narcissism .066 .022 .212 3.013 .003 .023 .110 .187 .189 .184 .752 1.329
a. Dependent Variable: Frequency of changing status per week
The VIF and the tolerance statistics helps
to evaluate the assumption of no
multicollinearity with VIF greater than 10
and tolerance less than .2 being causes of
concern.
8. Introduction to Applied Statistics and Applied Statistical Methods Practical guidelines
Prof. Dr. Chang Zhu page 8
If we look at model 3, i.e. after controlling for grade, age, gender, it’s found that narcissism significantly
predicts the frequency of Facebook status update over and above/beyond extraversion (β = .21, p <.01)
REPORT THE RESULTS
Field (2009) suggests that we should report the the constant, the unstandardized betas and their
standard errors, the standardized betas with their significance level indicated in the footnote as well as
the R square change (ΔR2
) for each step of the analysis.
We can write:
A hierachical multiple regression was conducted to examine if alfter controlling for grade, gender, and
age, narcissism can significantly predict the frequency of Facebook status update among adolescences
over and above extraversion. The result confirms the hypothesis such that narcissism accounted for a
significant variance in the frequency of Facebook status update over and above extraversion, ΔR2
= .03,
ΔF(1, 245) = 9.08, p < .01).
The results can be found in Table 1.
Table 1
Summary Of Hierarchical Multiple Regression Analyses For Extraversion And Narcissism Predicting The
Frequency Of Facebook Status Updates
B Std. Error Beta
Step 1
(Constant) 3.383 3.674
Grade -.444 .388 -.149
Age -.033 .309 -.014
Gender -.775 .327 -.153*
Step 2
(Constant) .830 3.861
Grade -.486 .386 -.163
Age -.006 .308 -.002
Gender -.691 .328 -.136*
Extraversion .052 .025 .127*
Step 3
(Constant) .650 3.799
Grade -.522 .380 -.175
Age -.010 .303 -.004
Gender -.943 .333 -.186*
Extraversion .011 .028 .028
Narcissism .066 .022 .212**
Notes R2
= .04 for Step 1, ΔR2
= .016 for Step 2 (p < .05), ΔR2
= .034 for Step 3 (p < .01). *
p<.05, **
p<.01
9. Introduction to Applied Statistics and Applied Statistical Methods Practical guidelines
Prof. Dr. Chang Zhu page 9
MODEL GENERALIZATION
To evaluate whether we generalize our model to make generalization about a different
sample/population we should look at the following graphs that we have requested in the analysis.
The first two are the histogram and the normal probability plot with the standardized predicted values
(ZPRED) against the standardized residuals (ZRESID). As can be seen, the histogram and the P-P plot
show that deviation from normality has been found.
The scatter plots also indicate that there is problem of heteroscedasticity in the data. Field notes that “In
a situation in which the assumptions of linearity and homoscedasticity are met, the points are randomly
and evenly dispersed throughout the plot” (p. 247). So the scatter plots obtained from the study’s data
demonstrate that the distribution of residuals are not random, but follow almost a certain linear pattern.
So the assumption of homoscedasticity has not been met.
10. Introduction to Applied Statistics and Applied Statistical Methods Practical guidelines
Prof. Dr. Chang Zhu page 10
Next comes the 5 partial scatterplots of the residuals of the outcome variable (FB status update) and
each of the five predictors (grade, age, gender, extraversion, and narcissism). We can also identify any
outliers if any in the partial scatterplots. Here we just look at 2 partial scatter plots as an example, and
we notice: (1) there a linear relationship between the gender, narcissism and the Facebook update
status; (2) there are 2 outliers.
Actually, we can already identify which are the outliers in the table named Casewise Diagnostics. In this
case, they are case 131 and 231 because we can see that their Facebook status update per week is 14
while the model predicts just 2.31 (residual = 11.68) and 2.26 (residual = 11.73) accordingly.
Casewise Diagnostics
a
Case Number Std. Residual
Frequency of
changing status
per week Predicted Value Residual
131 4.878 14.00 2.3104 11.68955
231 4.896 14.00 2.2676 11.73244
a. Dependent Variable: Frequency of changing status per week
To see if these two cases will have significant influence on the accuracy of our regression model we will
examine if they exceed the conventional cut-off values of the following influential statistics (Field, 2009):
Calculate the average leverage (number of predictor plus 1, divided by the sample size or
(k+1)/n), look for value greater than two or three times this average value. So for our data, the
leverage value is (5+1)/251=0.024
Cook’s distance: value above 1 indicates an influencing case.
Mahalanobis distance, value above 15 (sample size = 100) is cause of concern.
Absolute DFbeta greater than 1 is a problem.
Standardized DFFit as close to zero indicates good fit.
11. Introduction to Applied Statistics and Applied Statistical Methods Practical guidelines
Prof. Dr. Chang Zhu page 11
Calculate the upper and lower limit of acceptable values for the covariance ratio (CVR), using the
following equations. Any cases outside these limits are a problem.
upper limit for CVR: 1 + 3(k+1)/n = 1 + 3(5+1)/251 = 1.071
lower limit for CVR: 1 - 3(k+1)/n = 1 - 3(5+1)/251 = 0.928
Now we will use the Select cases command to select cases with standardized predicted residuals greater
than 3.
In SPSS, Data > Select Cases
Then choose If condition is satisfied, click If to provide the criterion.
We will move the variable ZRE_1 (Standardized Residual) to the condition area, then provide the
criterion that this value is greater than 3.
Click Continue to proceed and OK to finish. In the data view, we will see only cases 131 and 231 are
selected.
Then we will use the Case summaries command to look at the influential statistic values for these two
cases.
In SPSS, Analyze > Reports > Case Summaries
Move all the influential statistics (MAH_1, COO_1, LEV_1, COV_1, SDF_1, SDB0_1, SDB0=1_1, SDB2_1.
SDB3_1, SDB4_1, SDB5_1) into the Variables area.
12. Introduction to Applied Statistics and Applied Statistical Methods Practical guidelines
Prof. Dr. Chang Zhu page 12
Under the Display cases area, choose the options as suggested, then click OK to finish. In the output, we
can compare the influential statistics for the two cases with the cut-off values.
As obtained from the Case Summaries table, the two cases satisfy most of the criteria, except for the
Covariance Ratio and the standardized DFFit. Therefore, we can keep these two cases because according
to Field (2009), the Cook’s and the Mahalanobis distance for the two cases are acceptable, indicating
that they can cause a little, but not big influence on the regression model.
Case Summariesa
cases
Mahalanobis
Distance
Cook's
Distance
Centered
Leverage
Value COVRATIO
Standardized
DFFIT
Standardized
DFBETA
Intercept
Standardized
DFBETA
Grade
Standardized
DFBETA
Age
Standardized
DFBETA
Gender
Standardized
DFBETA
Extraversion
Standardized
DFBETA
Narcissism
131 3.99529 .08243 .01598 .55911 .73942 -.13512 .14031 -.01917 -.18263 .32825 .21441
231 1.53312 .04124 .00613 .55452 .52294 -.07824 -.09206 .03514 -.23134 .26096 -.02360
Total N 2 2 2 2 2 2 2 2 2 2 2
a. Limited to first 100 cases.
Conclusion: Using a number of diagnostic statistics to check accuracy of the model (the Durbin-Watson,
the VIF, the tolerance, the histogram, P-P plot, and scatter plots) and the influential cases, we can see
that the model fails to meet certain assumptions, especially the normal distribution of residuals and the
homoscedasticity. Therefore, we cannot generalize our model for the population. This is in accordance
with the limitations that Ong, Ho, Lim, Goh, Lee, and Chua (2011) have indicated in their paper.
13. Introduction to Applied Statistics and Applied Statistical Methods Practical guidelines
Prof. Dr. Chang Zhu page 13
ASSIGNMENT 6
(You can work alone or in group for this assignment. If you work in group, please stay in the same group
of previous assignments and indicate the group members in the submission document).
We know from the Collinearity Diagnostics that age and grade are highly correlated so, it can be
redundant to include both in the regression model and also can affect the accuracy of the model.
Therefore, we will only retain Age in this assignment and see if there can be any improvement in the
regression model.
For this assignment, you’ll try to test the following hypothesis:
H1: Narcissism will predict a higher rating of one’s own profile photo over and above extraversion.
which means you will find out if narcisissism can explain more unique variation in rating of Facebook
profile photo (profile_photo_rating) among adolescents, after controlling for demographic information
(age and gender), and extraversion.
When reporting the results, you should include the following:
- A paragraph describe what method of regression you used, the variables included, which
hypothesis to test and whether it is supported with the R square and F change and the
significant p value.
- A table of report includes the constant, the unstandardized betas and their standard errors,
the standardized betas with their significance level indicated in the footnote as well as the R
square change (ΔR2
) for each step of the analysis.
- Check if your model can be generalized by:
looking at the histogram and the normal probability plot with the standardized
predicted values (ZPRED) against the standardized residuals (ZRESID), and the
scatter plots;
analyzing if there are any influential outliers (criteria: value greater than 3 standard
deviations, see how to obtain this on page 5). If you remove the outlier from the
data set, re-run the analysis.
- Come up with a conclusion paragraph to see if the model can be generalized.
The data file is named narcissism.sav.
References
Field, A. (2009). Discovering statistics using SPSS. Sage publications.
Field, A. (2013). Discovering statistics using IBM SPSS Statistics. Sage publications
Ong, E. Y., Ho, J., Lim, J. C., Goh, D. H., Lee, C. S., & Chua, A. Y. (2011). Narcissism, extraversion and
adolescents’ self-presentation on Facebook. Personality and Individual Differences, 50(2), 180-
185.