This paper proposes a modified Hotelling’s T2 control chart that utilizes trimmed means and robust covariance matrices to improve detection of outliers in individual observations. The method incorporates bootstrap sampling and replaces traditional statistics with robust alternatives, demonstrating enhanced performance in terms of false alarm rates and detection probabilities. Simulation results indicate significant improvements in monitoring multivariate processes affected by outliers.
![International Journal of Electrical and Computer Engineering (IJECE)
Vol. 11, No. 1, February 2021, pp. 284~292
ISSN: 2088-8708, DOI: 10.11591/ijece.v11i1.pp284-292 284
Journal homepage: http://ijece.iaescore.com
Modified hotelling’s 𝑻𝟐
control charts using modified
mahalanobis distance
Firas Haddad
Department of General courses, College of Applied Studies and Community Service,
Imam Abdurrahman Bin Faisal University, Al-Dammam, Saudi Arabia
Article Info ABSTRACT
Article history:
Received Apr 12, 2020
Revised Jun 13, 2020
Accepted Jul 5, 2020
This paper proposed new adjusted Hotelling’s T2
control chart for individual
observations. For this objective, bootstrap method for producing
the individual observations were employed. To do so, both arithmetic mean
vector and the covariance matrix in the traditional Hotelling’s T2 chart were
substituted by the trimmed mean vector and the covariance matrix of
the robust scale estimators Qn, respectively which, in turn, its performance is
carried out by simulated. In fact, the calculation of false alarms and
the probability of detection outlier is used for determining the validity of this
modified chart. The findings revealed a considerable significance in its
performance.
Keywords:
Bootstrap
Hotelling’s 𝑇2
charts
Mahalanobis distance
Robust estimator
Trimmean This is an open access article under the CC BY-SA license.
Corresponding Author:
Firas Haddad,
College of Applied Studies and Community Service,
Imam Abdulrahman Bin Faisal University,
Dammam, Saudi Arabia.
Email: fshaddad@iau.edu.sa
1. INTRODUCTION
Statistical process control charts employ statistical implements to notice the accomplishment of
the production process. During the process of practicing, more than one quality feature is defined by
the overall quality of a product. Thus, the quality of a certain type of any product may be defined by degree
of hardness, thickness, weight, width and length etc. So, various features of a manufactured component
require simultaneous monitoring. Hence, it can be used both; the multivariate Shewhart-type 𝒳2
or
the Hotelling’s 𝑇2
control charts might be used.
Hotelling’s 𝑇2
statistic is one of the most public methods in the multivariate statistical control
charts [1, 2]. Furthermore, the Hotelling’s 𝑇2
statistic is the multivariate generalization of the Student’s
t- statistic. Hence, the Hotelling’s 𝑇2
statistic is the expanded case after taking the square for the two sides of
the equation of the Student’s t- statistic. In other words, Hotelling 𝑇2
statistic is equal to.
𝑇2
= 𝑛 (𝑋
̅ − 𝜇0)𝑇
𝑆−1
(𝑋
̅ − 𝜇0) (1)
Where 𝑋
̅ and 𝑆 are the sample mean vector and the p×p covariance matrix in succession.
Several values among the measurements of the characteristics make the traditional Hotelling’s 𝑇2
ineffective, although the Hotelling’s 𝑇2
control charts are effective and appropriate when the data are taken
from normal distribution. As a result, Mostajeran, Iranpanah and Noorossana in [3] pointed out that employ](https://image.slidesharecdn.com/29228925jul13jun12apry-210319084747/75/Modified-hotelling-s-control-charts-using-modified-mahalanobis-distance-1-2048.jpg)
![Int J Elec & Comp Eng ISSN: 2088-8708
Modified hotelling’s 𝑻𝟐
control charts using modified… (Firas Haddad)
285
non-parametric bootstrap control charts for unknown distribution. Where non-parametric bootstrap control
charts are suitable when the employ of large size deems impossible in addition to evaluate the process
parameters from the Phase I. Generally speaking, normal distribution is required for control charts for
permitting observation. In respect of cases with non-normal distributions, the usage of non-parametric control
charts containing charts of sign control will be applicable. It is worth mentioning that the algorithm of
non-parametric bootstrap in this study is employed for calculating the control chart parameters. By and large,
original observations might be employed in cases that do not entail any distribution assumption. Similarly,
robust statistics were employed rather than sensitive statistics in the Hotelling 𝑇2
chart. Such methods
were regarded efficient for overcoming poor performance issue in the existence of extreme values in
product features.
There are several previous studies that employed this technique and the majority of them are
rendered in the above-mentioned studies relating with improving this model, see [4]. The abovementioned
studies that employed the bootstrap samples, the location, and scale estimators, the trimmed mean and
the trimmed covariance were mentioned. One of which [5] who used the so-called trimmed mean and
trimmed covariance matrix as an alternative of arithmetic mean and covariance matrix, respectively.
Surtihadi in [6] employed median as a robust location estimator when he constructed robust bivariate sign
tests of Blumen and Hodges. Alfaro and Ortega in [7] suggested a new alternative chart by substituting
the sample mean vector with trimmed mean vector and the covariance matrix by trimmed covariance matrix.
Jones in [8] used in control chart constructions, bootstrap rather than the traditional parametric
assumption. Bootstrap methods use computing power. Phaladiganon et al. in [9] employed a bootstrap-based
multivariate T2
control in their study and indicated the capacity of the chart in observing a process in
non-normal or unknown distribution of data. The author uses a simulation study to assess the performance of
the control chart.
The method provided in [10] depended on the notion of bootstrapping. For this objective,
the authors bootstrapped the data, and then such data were applied on in-control state estimation. The usage
of a non-parametric approach demonstrated in [11] in conducting estimation on the cumulative sum (Cusum)
as well as the exponentially weighted moving average (EWMA) control limits on a given dataset. The usage
of an innovative bootstrap algorithm was revealed in [12] in the Hotelling’s T2
control chart creation.
Applying nonparametric bootstrap multivariate control charts |S|, W, and G depends on bootstrapped
data utilization in evaluating the in control state that was discussed in [3]. The findings reveal that the
bootstrap control charts achieved reasonable performance.
Similarly, in [13] indicated the application of a bootstrap multivariate control chart following
Hotelling’s T2
statistic. The author in [14] modified three robust Hotelling’s T2
charts by replacing the mean
vector and the covariance matrix by the trimmed estimators. The trimming was done using the modified
Mahalanobis distance, where the location estimator is the median and the scale estimator is one of the robust
scale estimators MADn, Sn and 𝑇n.
Tukey and McLaughlin in [15] proposed new substitute Bivariate robust Hotelling's T2
chart.
By Exchanged the arithmetic mean with winsorized modified one step M-estimator (wMOM) vector
and substituted the sensitive covariance matrix with the covariance matrix of robust scale estimator
𝑄n respectively.
The current study aims at enhancing Hotelling’s
2
T chart in terms of its functioning. Thus, a novel
method was suggested, which contains modification to the sensitivities towards outliers. There are a wide
spread choice of robust location and scale estimators that might be regarded in this issue. This research seeks
to develop the function of Hotelling T2
chart by replacing the mean vector and the covariance matrix with
trimmed mean and its corresponding covariance matrix following [5]. The trimmed mean based on robust
scale estimator Qn. To appraise the function of the new modified robust Hotelling T2
control chart,
the outliers are inserted in the data, which are coming from the standard normal distribution by using
bootstrap method in generating the samples, then calculate the false alarms and the probability of detection of
outliers as a technique to judge the function of the modified chart. The following section (section 2) presents
the details of the research methods. After that, section 3 presents the results and discussion. followed by
the conclusion in section 4.
2. RESEARCH METHOD
2.1. Trimming method
The covariance matrix is influenced by the emergence of the outliers. As a result, we used
the trimmed variance-covariance matrix as an exchange for the covariance matrix. The computation of such
an estimator is based on the winsorized covariance matrix. So, the winsorized variance-covariance matrix is
used to calculate the covariance matrix for the winsorized sample. In order to produce the modified Hotelling](https://image.slidesharecdn.com/29228925jul13jun12apry-210319084747/75/Modified-hotelling-s-control-charts-using-modified-mahalanobis-distance-2-2048.jpg)
![ ISSN: 2088-8708
Int J Elec & Comp Eng, Vol. 11, No. 1, February 2021 : 284 - 292
286
𝑇2
control charts it has been used the robust location estimator the trimmed mean and the trimmed variance-
covariance matrix. The trimming of the outliers data are produced by implementing the method of modified
Mahalanobis distance, such as the modification approved out by replacing the sample mean vector in
the Mahalanobis distance formula by the median vector and replacing variance-covariance matrix,
by the robust scale variance-covariance matrices of Qn [16]. The trimming and replacement of the data to
obtain the winsorized sample are achieved by employing the values of modified Mahalonobis distance that
the trimming dependent on the percentage 20% from each end. The natural way of Mahalanobis distance.
In the studies of [5, 17], each end from outlier observation was trimmed the data that are provided by
the largest two values of Mahalanobis distance. Meanwhile, this technique is appropriate for dealing with
subgroup observations, but our case is concerned with the bootstrap individual observations. As such,
the percentage for trimming is more appropriate. The authors in [16] suggested that the best percentage is
20%-25% in a symmetric distribution. The authors in [18, 19] proposed to trim 20% from each tail of
the data. The author in [19] proposed the best percentage to trim 20% for each side. Consequently,
the percentage of trimming in this paper for each end is 20%.
2.2. Constructing control charts
Substituting arithmetic mean vector 𝑋
̅ by the alternative robust location estimator, the trimmed mean
𝑋
̅𝑡𝑄𝑛 and substitute the sample variance covariance matrix S by the trimmed variance covariance matrices
each one of them relies on the robust scale estimator 𝑄𝑛. The computation of the trimmed covariance matrix
requires calculating the winsorized covariance matrix before. The winsorized variance covariance matrix is
the variance covariance matrix for the winsorized sample. Its sample is achieved by using some techniques to
trim the outliers from the data. The technique of Mahalanobis distance is employed in such study.
The formula of Mahalanobis distance relies on the arithmetic mean vector and the variance covariance
matrix. This paper modified the Mahalanobis distance by modifying the arithmetic mean by the robust
location estimator the median and modifying the variance covariance matrix by the covariance matrix of
the robust scale estimators 𝑄𝑛 [20]. In respect to the type of robust scale estimator the winsorized sample is
achieved. Thus, the type of winsorized sample is formed. With regard to such winsorized sample,
one trimmed mean has been calculated X
̅tQn and one trimmed variance covariance matrix 𝑆𝑡𝑄𝑛, had been
calculated. Based on this type of winsorized sample, the Modified Hotelling’s 𝑇2
control chart is structured
as follows:
Defining the adjusted Mahalanobis distance values ∆𝟐
for each vector Xi1,….., Xip in the individual
bootstrap data groups, where i = 1, … , n, and p number of variables.
Organizing the values of modified Mahalanobis distance orderly and according to [16] who stated that the
best percentage of trimming is 20%-25% from each end in symmetric distribution. The authors [18, 19]
proposed trimming 20% from each tail of the data. Thus, we employed the 40% as a trimming percentage.
Trimming the largest 40 % of the values of modified Mahalanobis distance ∆2
. According to these values
of Mahalanobis distance, trimming the observations in the data that are manifested by 40 % of the largest
values of modified Mahalanobis distance ∆2
.
For the purpose of creating the winsorized sample, substitute the trimmed observations by other
observations are manifested by the next 40% of the values of modified Mahalanobis distance ∆2
.
Defining the trimmed mean for each bootstrap data set of the individual observations by splitting the total
of the remaining individual observations by (n-k), where k symbols to the number of trimming
observations because only one bootstrap data set, followed by one value of trimmed mean 𝑋
̅𝑡𝑄𝑛.
Defining the winsorized covariance matrix 𝑆𝑤𝑄𝑛 by using the winsorized sample according to the use of
the robust scale estimators 𝑄𝑛, .
Pinpointing the trimmed variance covariance matrix 𝑆𝑡𝑄𝑛 for the individual bootstrap data set by applying
the formula [17]:
𝑆𝑡 =
𝑛−1
𝑛𝑡−1
× 𝑆𝑤 (2)
where 𝑆𝑤 is the winsorized covariance matrix, nt is the number of the rest data after trimming.
The diagonal components in the above mentioned trimmed variance covariance matrix are
the sample-trimmed variance where 𝑆𝑡𝑗𝑗 = 𝑆𝑡𝑗
2
and the other elements are 𝑆𝑡𝑗𝑔 the sample trimmed
covariance matrix of the two vectors 𝑋𝑗, 𝑋𝑔, and is computed as follows:
a) Compute 𝑺t(Xj), 𝑺t(Xg); j=1,…,p, g=1,…,p and, 𝑗 ≠ 𝑔.](https://image.slidesharecdn.com/29228925jul13jun12apry-210319084747/75/Modified-hotelling-s-control-charts-using-modified-mahalanobis-distance-3-2048.jpg)
![Int J Elec & Comp Eng ISSN: 2088-8708
Modified hotelling’s 𝑻𝟐
control charts using modified… (Firas Haddad)
287
b) Compute the spearman rank correlation between 𝑋𝑗and 𝑋𝑔, denoted by corr (𝑋𝑗, 𝑋𝑔) because this
type of correlation is robust against the extreme data [21].
c) The sample covariance between the variables 𝑋𝑗and 𝑋𝑔 is computed according to the following
formula:
𝑆𝑡𝑗𝑔 = 𝑐𝑜𝑣(𝑋𝑗, 𝑋𝑔) = 𝑆𝑡( 𝑋𝑗)𝑆𝑡( 𝑋𝑔)𝑐𝑜𝑟𝑟(𝑋𝑗, 𝑋𝑔) (3)
Compute the opposite of the sample trimmed standard covariance matrix for 𝑆𝑡𝑄𝑛,, which is manifested
by 𝑆𝑡𝑄𝑛
−1
.
Defining the modified Hotelling’s 𝑇2
control chart by substituting the sample mean in the traditional
Hotelling’s 𝑇2
control chart by the robust location estimators 𝑋
̅𝑡𝑄𝑛,, and substitute the opposite of
the sample standard covariance matrix in the traditional Hotelling’s 𝑇2
control chart by the opposite
robust scale covariance matrices StQn
−1
. After that, the modified Hotelling’s T2
control chart anchored on
this form:
TtQn
2
(Xi) = (Xi − XtQn
̅̅̅̅̅̅)T
StQn
−1
(Xi − XtQn
̅̅̅̅̅̅) (4)
2.3. Independent and dependent variables
This study touched upon the independent and dependent cases which are acquired by Case A and
Case B respectively. The following formulas clarify the contamination model of the mixture normal
distribution:
(1-ε)Np(µ0, Σ0) + ε Np(µ1 , Σ1) (5)
To illustrate, ε is the percentage of the outliers. Np(µ0, Σ0) is the in control distribution and
the parameters µ0, Σ0 are called in control parameters. Meanwhile, the distribution Np(µ1 , Σ1) is the out of
control distribution and the parameters µ1 , Σ1 are called out of control parameters. Two cases of
the variables shall be taken when such variables are ought to be independent and called (A) while
the dependent variables are called as (B). The following formula clarify that.
2.3.1. Case (A):
(1-ε)Np(0, Ip) + ε Np(µ1 , IP) (6)
Without loss of generality, the in control means vector µ0 is 0, while the variance covariance matrix in the in
control and out of control distributions is equal to the Identity matrix 𝑰𝒑. The authors in [22, 23] indicates that
the variance covariance matrix 𝑰𝒑 is regarded as a homogenous variance covariance matrix with 1 for
the main diagonal and 0 for the other elements in the matrix that considers that without correlation among
the variables. However, as the value of the out of control parameter µ𝟏 depends on the non-centrality
parameter as follows:
(µ1 − µ)′Σ−1
(µ1 − µ) (7)
where µ𝟏 a vector is manifesting the amount of the shift for the mean vector. The larger value of
the non-centrality parameter stands for larger extreme outliers. As such, according to many statisticians such
as [7, 24, 25] they took the following values for the non-centrality parameter µ𝟏 like 0 (when there is no
alteration), 3 and 5 for obtaining more extreme outliers.
2.3.2. Case (B):
(1-ε)Np(0, Σ0) + ε Np(µ1 , Σ0) (8)
In control parameter, without loss in generality, stands for vector µ0 is equal to 0 while the variance
covariance matrix for the in control and out of control distributions are equivalent (i.e. 𝛴0 =𝛴1 = 𝛴0). 𝛴0 is
a homogenous variance covariance matrix of size 𝑝 × 𝑝 with high level of correlation between the variables.
For example, the components of the main diagonal in 𝛴0 are 1 and the other elements are 0.9 [23, 26].
However, the out of control parameter µ1 receives the values 0 (without alteration) and 5 (when there are](https://image.slidesharecdn.com/29228925jul13jun12apry-210319084747/75/Modified-hotelling-s-control-charts-using-modified-mahalanobis-distance-4-2048.jpg)
![ ISSN: 2088-8708
Int J Elec & Comp Eng, Vol. 11, No. 1, February 2021 : 284 - 292
288
a good leverage points). Such case was regarded for judging the performance of modified Hotelling’s 𝑇2
statistics concerning dependent variables or when there is correlation among the variables. The values of
the percentages of outliers ε are 0.1, and 0.2. Likewise, Holmes and Mergen in [27] whenever
the Hotelling’s 𝑇2
statistics is out of control, this clarifies that the correlation among the variables has
changed. In case (B) there is a high correlation between the variables, during that, it can be measured whether
the alteration in the correlation between the variables impact on the values of the probability of Type I error
and the probability of detection of outliers for the modified Hotelling 𝑇2
statistics.
2.4. Upper control limits (UCL)
Since the distribution of the Hotelling’s 𝑇2
statistic is vague when the sample size is small,
the upper control limits are calculated by employing the simulation. The simulation occurs during two phases
I and II. Phase I the bootstrap data sets generated from the standard normal distribution 𝑁(0, 𝐼𝑝).
The traditional and the robust estimators are calculated for these data sets. Phase II produces a new additional
observation from the standard normal distribution 𝑁(0, 𝐼𝑝). Repeat the generating for 5000 times.
Then calculate the corresponding modified Hotelling’s 𝑇2
statistic for these 5000 new additional
observations. The percentile 95 computed for these values of adjusted Hotelling’s 𝑇2
statistic and then such
value of the percentile considered as the UCL.
The simulation for computing false alarms and the possibility of detection outliers undergo through
two phases I and II. To clarify, Phase I the bootstrap method for the generated individual observations from
distribution 𝑁(0. 𝐼𝑝) is used. Then the outliers are added according to the two cases independent and
dependent variables (case (A) and case (B)). The traditional and robust estimators computed in this phase.
According to phase II, the false alarms is calculated and the possibility of detection outliers. For instance,
the false alarm is calculated when we pro a new observation from in control distribution. Meanwhile
the possibility of detection of outliers is calculating when the new observation is produced from the out of
control distribution.
3. RESULTS AND DISCUSSION
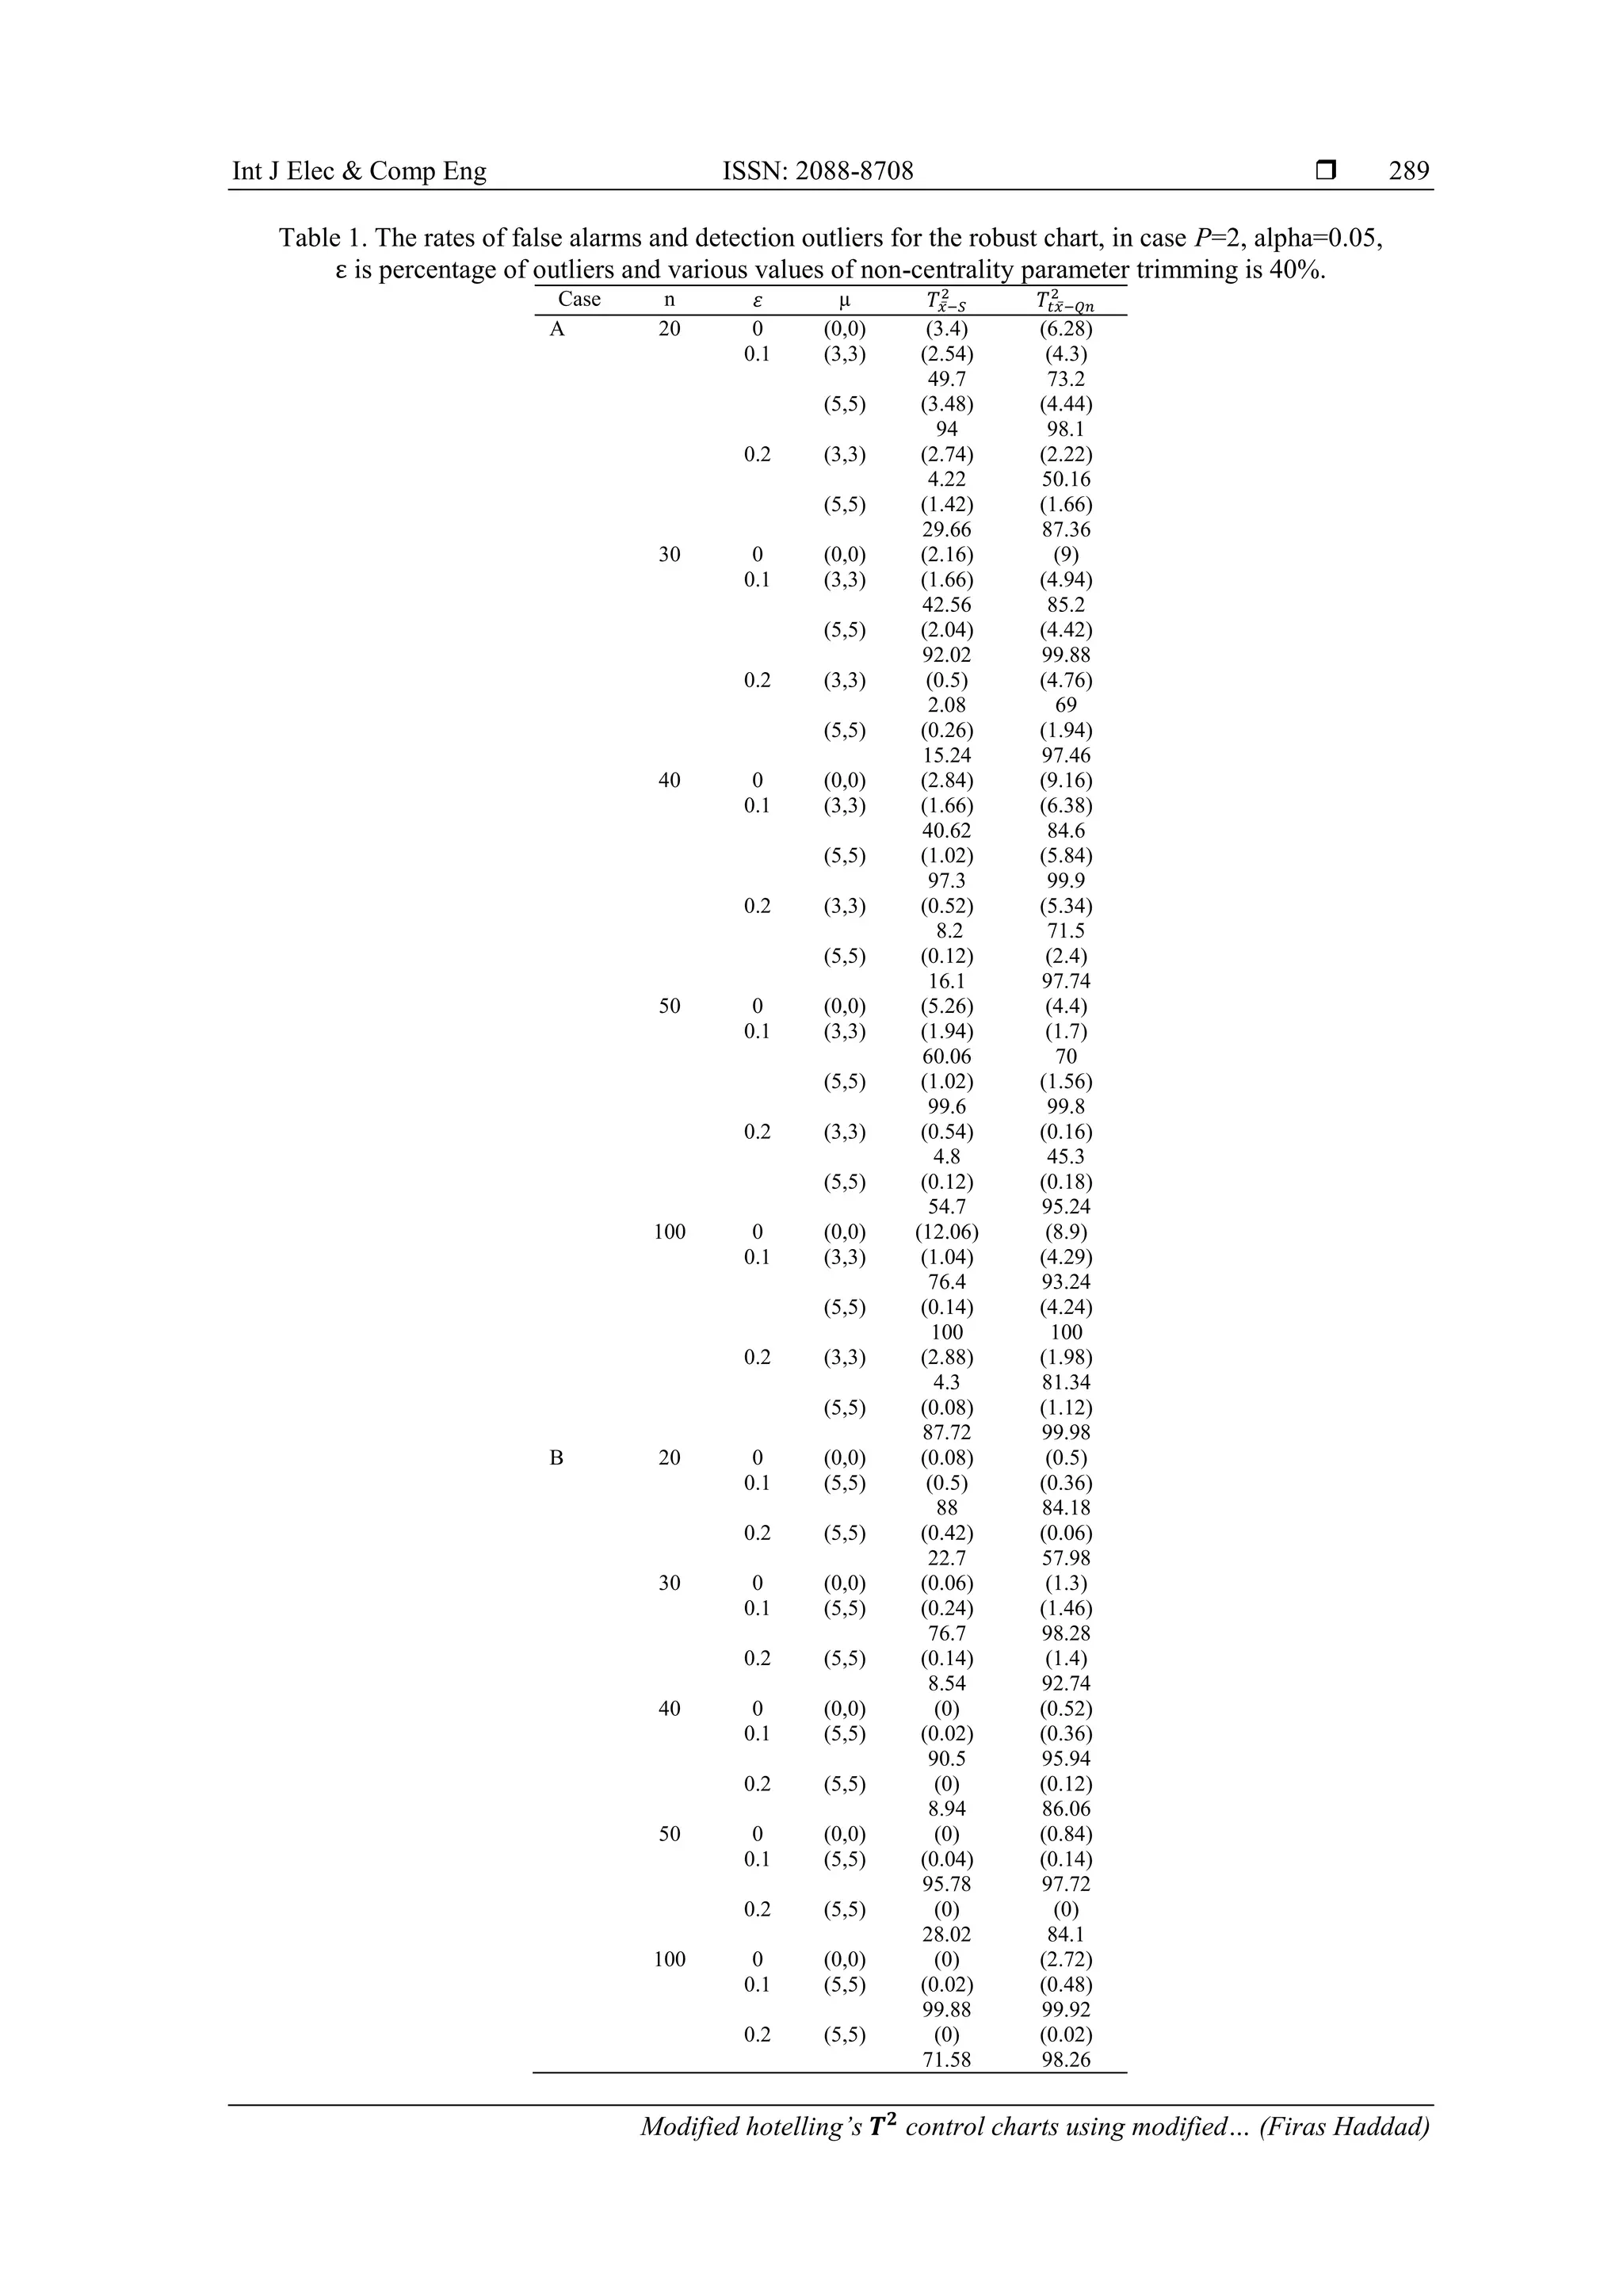
The following table represents both the results of false alarms and the probability of detection
outliers for the new modified robust chart. As shown in Table 1 particularly in case (A), the bivariate
variables with level of significance α =0.05. In the presence of the data outliers, the values of the rates,
in the robust chart for false alarms are better than the values the rates in the traditional Hotelling’s 𝑇2
chart.
In general, the rates of false alarms are under control when the percentage of outliers ε=0.1. As sample sizes
increase, the rates of false alarms become conservative whenever the percentage of outliers is ε=0.2
In respect of the possibility of detection, outliers are considered better in the robust Hotelling’s
𝑇2
control charts comparing with traditional Hotelling’s 𝑇2
control charts. Particularly when the percentage
of outliers ε=0.2, the huge difference could be detected between the rates of the possibility of detection of
outliers between the robust chart and the traditional chart which implies that the findings concerning robust
charts are better than the findings in the traditional charts. Furthermore, the robust Hotelling 𝑇2
control chart,
the more values of the possibility of detection outliers increase, the more sample size increase that
achieves100% detected when the sample size achieve to 100. On the contrary, the more values of
the probability of detection for the traditional control charts decrease, the more sample size increase.
Therefore, it can be deduced that the modified robust Hotelling’s 𝑇2
control charts are better than
the traditional Hotelling’s 𝑇2
control charts particularly in the possibility of detection outliers.
With regard to case (B) concerning the dependent variables, the robust chart has better performance
comparing with the performance of the traditional chart relating with false alarms and the possibility of
detection. It has been observed that the values of the possibility of detection of outliers are better particularly
when the percentage of outliers ε=0.1 despite that the values of false alarms in this case are not well and
reasonable. The increasing of the sample size impacts on the possibility of detection, but does not impact on
the values of false alarms. This suggests that the modified robust Hotelling’s 𝑇2
control chart is better than
the traditional Hotelling’s 𝑇2
control chart particularly in the possibility of detecting outliers.
Case A indicates that independent variables are demonstrated in Figures 1-4 with the number of
characteristics at p=2. The findings reveal that in the detection of outliers, the new adopted chart has better
performance comparing with the conventional chart. It is obvious the strong performance of the new chart in
detecting outliers data when the sample sizes are 30 and 40 than other sizes. In respect of the dependent
variables (case B), Figures 5 and 6 confirms the superiority of the new chart to the conventional one,
indicating the appropriateness of the new chart for the above-mentioned case.](https://image.slidesharecdn.com/29228925jul13jun12apry-210319084747/75/Modified-hotelling-s-control-charts-using-modified-mahalanobis-distance-5-2048.jpg)
![ ISSN: 2088-8708
Int J Elec & Comp Eng, Vol. 11, No. 1, February 2021 : 284 - 292
290
10 % outliers with shifted mean 3 20 % outliers with shifted mean 3
Figure 1. The rates of detection outliers with
sample size m (Case A)
Figure 2. The rates of detection outliers with
sample size m (Case A)
10% outliers with shifted mean 5 20% outliers with shifted mean 5
Figure 3. The rates of detected outliers
with sample size m (Case A)
Figure 4. The rates of detected outliers
with sample size m (Case A)
10% outliers with shifted mean 5 20% outliers with shifted mean 5
Figure 5. The rates of detected outliers
with sample size m (Case B)
Figure 6. The rates of detected outliers
with sample size m (Case B)
3.1. Empirical case study
Vargas J in [28] findings were employed in order to compare between them. Thus, the findings of
the suggested technique and those of the conventional and adjusted control charts were contrasted. It is
obvious two features of random variables in the data namely 1
X and 2
X . Most importantly the data were
elicited from 30 various products from the production process. Vargas J in [28] used two variables from
Quesenberry dataset. As such, Table 2 reveals the observations of the above-mentioned random variables
namely the values of the new Hotelling’s T2
and the conventional T2
chart statistics.
The simulation for the robust charts was used in the UCL calculation. This study reveals that
the value of all UCL was established at 9.4787 for α=0.05. The elicited findings, for the conventional chart,
only one outlier was detected namely the 2nd
, while the robust charts were able to detect five outliers namely
the 2nd
, 5th
, 14nd
, 17th
and 20th
.](https://image.slidesharecdn.com/29228925jul13jun12apry-210319084747/75/Modified-hotelling-s-control-charts-using-modified-mahalanobis-distance-7-2048.jpg)
![Int J Elec & Comp Eng ISSN: 2088-8708
Modified hotelling’s 𝑻𝟐
control charts using modified… (Firas Haddad)
291
Table 2. Bivariate variables X1and X2 of Vargas data set with the values of T 2
statistics employing
the conventional and the winsorized MOM estimator
Product No
1
X 2
X 2
0
T
TtQn
2
1 765.0 .76556 0.807 4.8584
2 765.6 5.6.7. 12.975 31.451
3 765. 526595 0.1373 1.026
4 765.9 ..6.79 1.8375 4.9479
5 7656. 5266.5 1.5697 28.0655
6 76595 .76996 0.33 1.4439
7 7655. .7605. 0.977 1.8793
8 7656. 52669. 0.904 2.68149
9 76550 .76.5.7 0.1269 0.2652
10 765.. .76.5 0.801 3.1888
11 7656. 526065 0.7192 0.9387
12 76565 526.05 0.910 1.84799
13 7655 .76562 0.483 2.8319
14 76556 ..67.0 5.2413 13.2413
15 76555 526066 0.073 0.97578
16 765.2 566.5 3.5357 8.3317
17 7650. 526505 2.2696 10.0502
18 76550 5260.6 3.2442 8.8545
19 765.5 .7627. 1.398 2.04784
20 76..5 .76.6 6.8326 14.425
21 76. .7652. 1.8978 3.8182
22 7656. 566.0 3.3564 6.66
23 765.0 .769.. 0.427546 1.7246
24 7652. .769.5 1.1838 5.30574
25 76565 5265 1.4968 7.3952
26 7650. .76759 0.48432 0.3187
27 7659 52657. 0.28989 2.24539
28 7655. 56650. 2.0635 7.575022
29 765.2 566... 1.38596 1.279114
30 76555 .769.2 0.24043 0.152033
4. CONCLUSION
The Hotelling’s T2
chart trimmed covariance matrix and trimmed mean were used in this study
respectively as the scale covariance matrix and the location vector. The comparative concerning the modified
chart and the conventional chart aimed at revealing their performance in detecting outliers and false alarms.
To this end, two cases were utilized case (A) and case (B). To illustrate, the former contains the independent
variables, while the later contains the dependent variables. The findings of the simulation results show that
modified chart was able to control false alarm rates under most of conditions. Surprisingly, such ability
started to reduce followed by the enhance in the shifted mean vector µ and proportion of outliers. The robust
chart has indicated its superior ability in producing the possibility of detection outliers comparing with
the ability of conventional T2
chart.
REFERENCES
[1] Alt, F. B. (Ed.)., “Multivariate quality control,” Encyclopedia of statistical science, vol. 6, pp. 110-122, 1985.
[2] Montgomery, D. C. (Ed.)., “Introduction to Statistical Quality Control,” John Wiley and Sons Inc, 2005.
[3] Mostajeran A., Iranpanah, and N., Noorossana R., “An evaluation of the multivariate dispersion charts with
estimated parameters under non‐normality, Applied Stochastic Models in Busin and Industry, vol. 33, no. 6,
pp. 694-716, 2017.
[4] Haddad F. and Alsmadi M. K., “Improvement of The Hotelling’s T2 Charts Using Robust Location Winsorized
One Step M-Estimator (WMOM),” Punjab University, Journal of Mathematics, vol. 50, no. 1, pp. 97-112, 2018.
[5] Alloway, J. A. J., Raghavachari, M., “Multivariate Control Charts Based on Trimmed Mean,” ASQC Quality
Congress Transactions-San Francisco, pp. 449-453, 1990.
[6] Surtihadi J., “Multivariate and robust control charts for location and dispersion,” Diss. Rensselaer Polytechnic
Institute, 1994.
[7] Alfaro, J. L., and Ortega, J. F., “A Robust Alternative to Hotelling’s T2 Control Chart Using Trimmed Estimators,”
Quality and Reliability Engineering International, vol. 24, no. 5, pp. 601-611, 2008.
[8] Jones L. A. and Woodal W. H., “The performance of bootstrap control charts,” Journal of Quality Technology,
vol. 30, no. 4, pp. 362-375, 1998.
[9] P. Phaladiganon, et al., “Bootstrap-based T 2 multivariate control charts," Communications in Statistics, vol. 40,
no. 5, pp. 645-662, 2011.](https://image.slidesharecdn.com/29228925jul13jun12apry-210319084747/75/Modified-hotelling-s-control-charts-using-modified-mahalanobis-distance-8-2048.jpg)
![ ISSN: 2088-8708
Int J Elec & Comp Eng, Vol. 11, No. 1, February 2021 : 284 - 292
292
[10] Gandy A. and Kvaloy J. T., “Guaranteed Conditional Performance of Control Charts via Bootstrap Methods,”
Scandinavian Journal of Statistics, vol. 40, no. 4, pp. 647-668, 2013.
[11] Ogbeide Efosa Micheal and Edopka I. W., “Bootstrap Approach Control limit for statistical quality control,”
International Journal of Engineering Science Invention, vol. 2, no. 4, pp. 2319-6734, 2013.
[12] Mostajeran A., Iranpanah N., and Noorossana R., “A New Bootstrap Based Algorithm for Hotelling’s T2
Multivariate Control Chart,” Journal of Sciences, Islamic Republic of Iran, vol. 27, no. 3, pp. 269-278, 2016.
[13] Mostajeran A., Iranpanah N., and Noorossana R., “An explanatory study on the non-parametric multivariate T2
control chart,” Journal of Modern Applied Statistical Methods, vol. 17, no. 1, 2018.
[14] Syed Yahaya S. S., et al., “Robust Hotelling’s Charts with Median Based Trimmed Estimators,” Journal of
Engineering and Applied science, vol. 14, no. 24, pp. 9632-9638, 2019.
[15] Haddad F. S., “Improving Bivariate Hotelling’s T2 Chart Using New Robust Estimators (WMOM with Qn ) and
Bootstrap Data,” International Journal of Applied Engineering Research, vol. 14, no. 21, pp. 4001-4009, 2019.
[16] Rock, D. M., Downs, G. W., and Rock, A. J., “Are robust estimators really necessary?,” Technimetrics, vol. 24,
no. 2, pp. 95-101, 1982.
[17] Tukey, J. W., and McLaughlin, D. H., “Less Vulnerable Confidence and Significance Procedures for Location
Based on a Single Sample,” Sankhyā: The Indian Journal of Statistics, Series A, vol. 25, pp. 331-332, 1963.
[18] Rosenberger, J. L., and Gasko, M., “Comparing location estimators: Trimmed means, medians and trimmean,”
Understanding robust and exploratory data analysis, 297-336, 1983.
[19] Wilcox, R. R., “ANOVA: A paradigm for low power and misleading measures of effect size?,” Review of
Educational Research, vol. 65, no. 1, pp. 51-77, 1995.
[20] Croux, C., and Rousseeuw, P. J., “Time-efficient algorithms for two highly robust estimators of scale,”
Computational Statistics, vol. 2, pp. 411-428, 1992.
[21] Abdullah, M. B., “On robust correlation coefficient,” Statistician, vol. 39, pp. 455-460, 1990.
[22] Johnson, M. E. (Ed.), “Multivariate statistical simulation: New York,” John Wiley and sons, 1987.
[23] Johnson, N., “A comparitive simulation study of robust estimators of standard error,” Brigham Young Univ., 2007.
[24] Alfaro, J. L., and Ortega, J. F., “A comparison of robust alternative to Hotelling T2 control chart,” Applied
Statistics, vol. 36, no. 12, pp. 1385-1396, 2009.
[25] Chenouri, S., Variyath, A., M, and Steiner, S. H., “A Multivariate Robust Control Chart for Individual
Observations,” Quality Technology., vol. 41, no. 3, pp. 259-271, 2009.
[26] Jensen, W. A, Birch, J. B and Woodall, W. H., “High Breakdown Estimation Methods for Phase I Multivariate
Control Charts Quality,” Reliability Engineering International, vol. 23, no. 5, pp. 615-629, 2007.
[27] Holmes, D. S., and Mergen, A. E., “Identifying the sources for out of control signals when the T2 control chart is
used,” Quality Engineering, vol. 8, no. 1, pp. 137-143, 1995.
[28] Vargas, J. A., “Robust Estimation in Multivariate Control Charts for Individual Observation,” Quality Technology,
vol. 35, pp. 367-376, 2003.](https://image.slidesharecdn.com/29228925jul13jun12apry-210319084747/75/Modified-hotelling-s-control-charts-using-modified-mahalanobis-distance-9-2048.jpg)