Download as PDF, PPTX

![Example Data
NHANES (National Health and Nutrition Examination Survey)
Four variables: age (age group), bmi (body mass index), hyp
(hypertention status), chl (cholesterol level)
> library(mice)
> nhanes[1:5,]
age bmi hyp chl
1 1 NA NA NA
2 2 22.7 1 187
3 1 NA 1 187
4 3 NA NA NA
5 1 20.4 1 113
21st July 2015 3 / 13](https://image.slidesharecdn.com/mice-150722111807-lva1-app6892/75/SheffieldR-July-Meeting-Multiple-Imputation-with-Chained-Equations-MICE-package-3-2048.jpg)


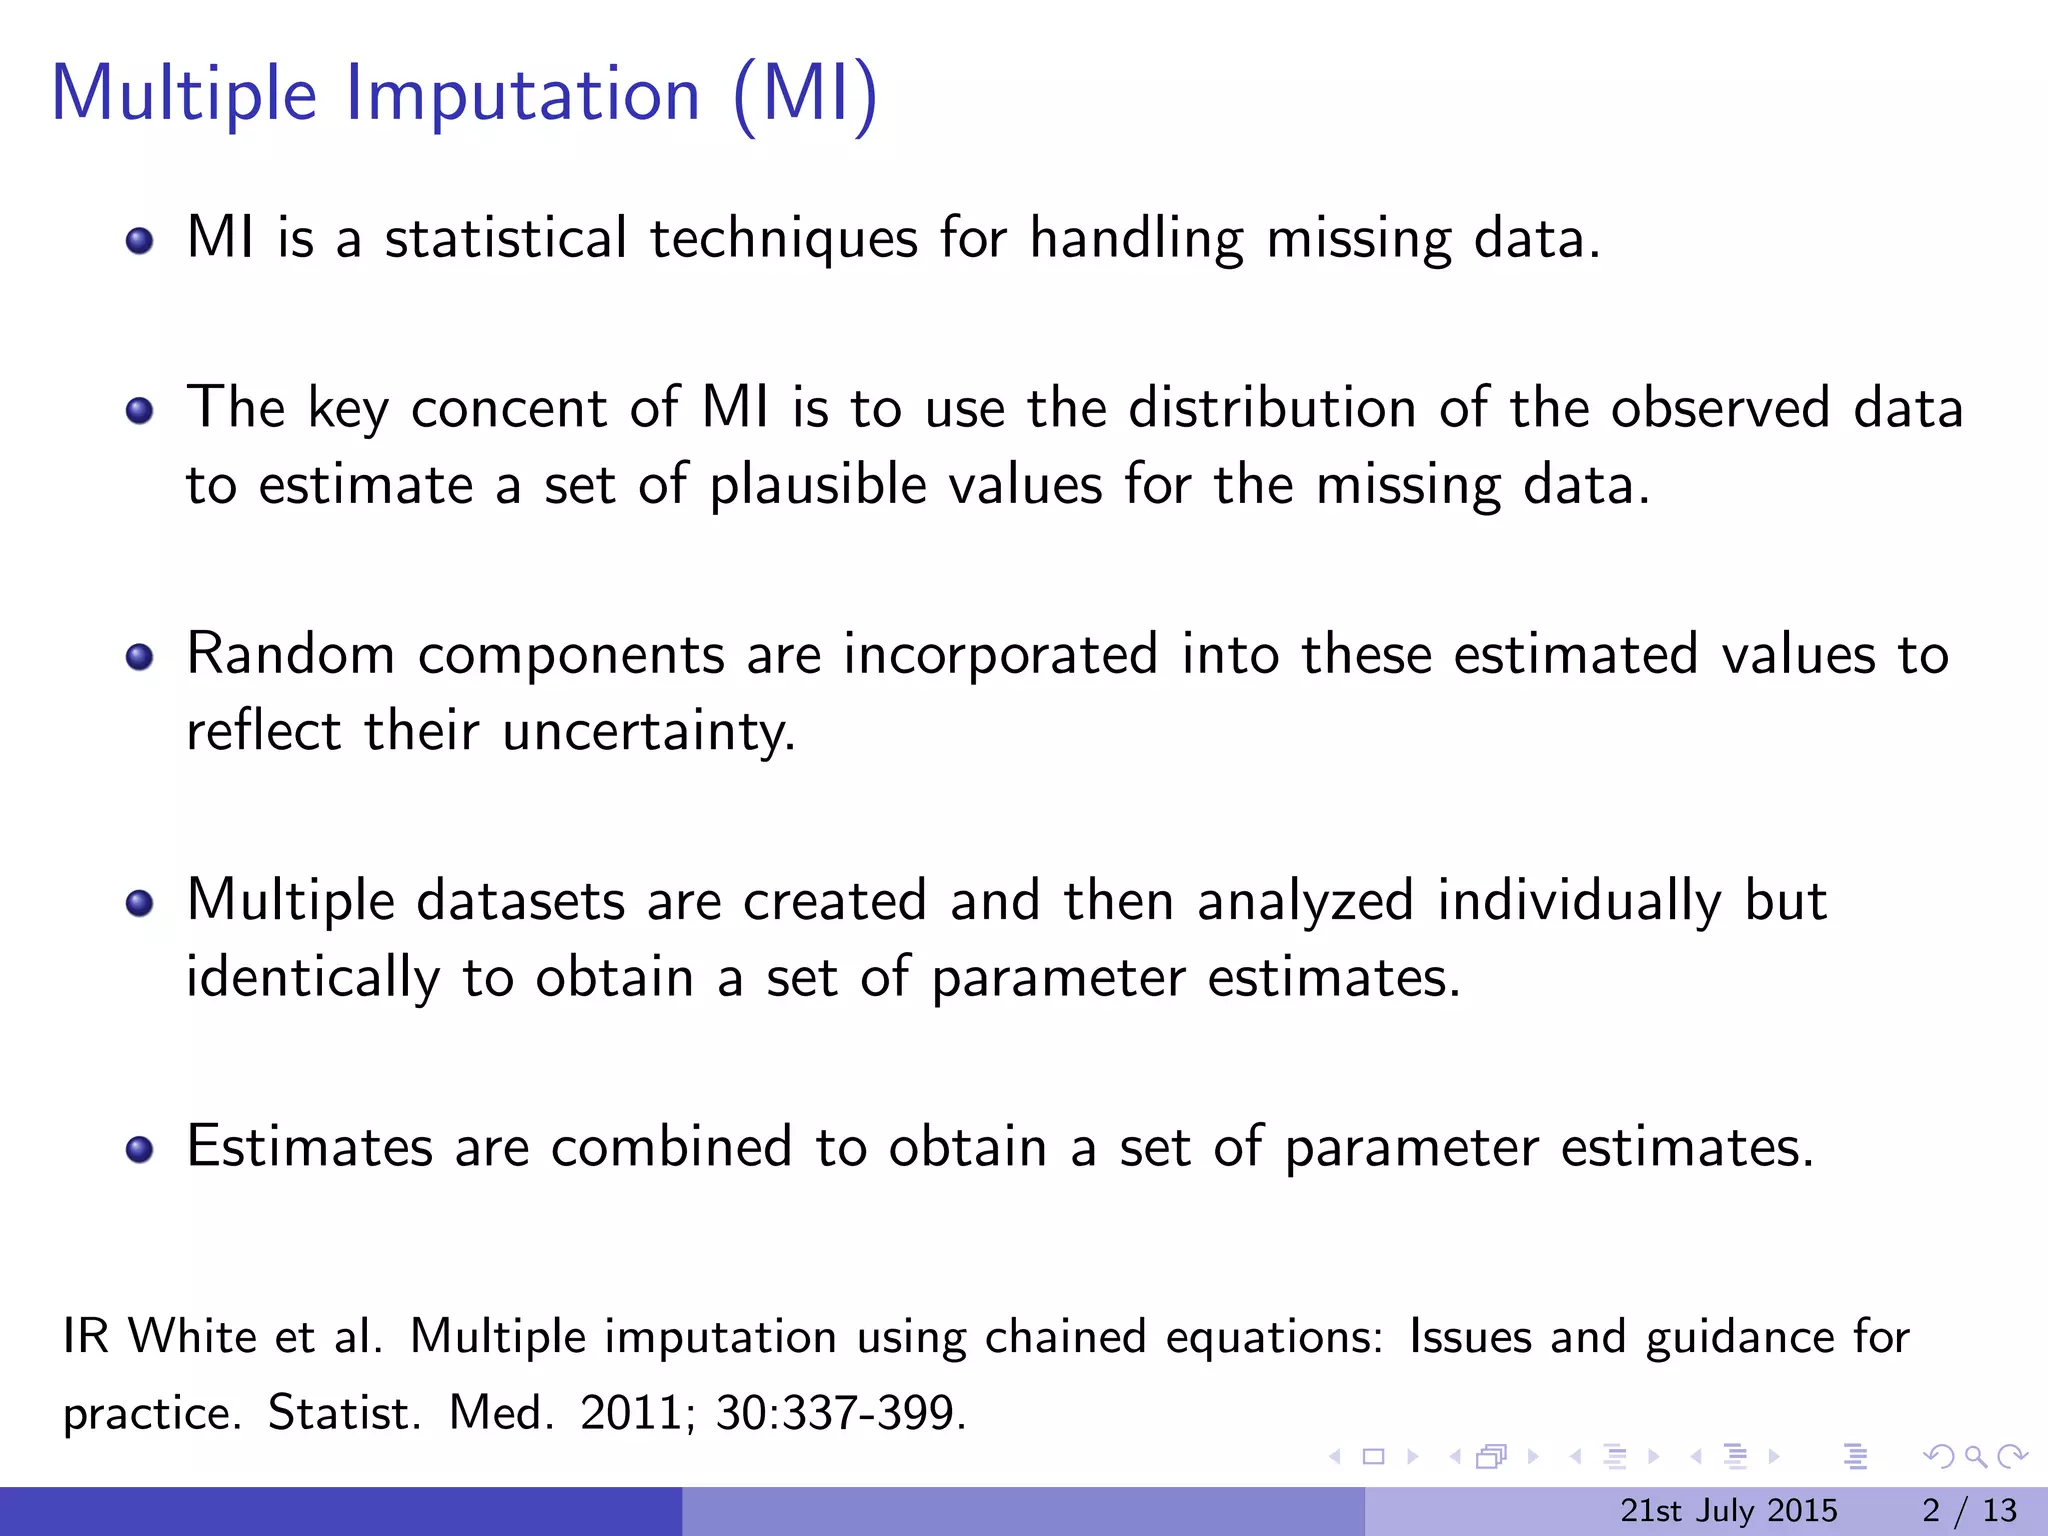
The document discusses Multiple Imputation (MI) as a statistical method for addressing missing data by estimating plausible values based on observed data distributions. It details the process of generating multiple imputations using the 'mice' package in R, including the steps for analysis and pooling results. Additionally, it provides examples of applications with real data and references for further reading.