Downloaded 39 times
![How Long Does it Take to Create
Learning?
A Chapman Alliance, Research Study
By Bryan Chapman, Chief Learning Strategist
bryan@chapmanalliance.com
www.chapmanalliance.com
Abstract: Several years ago, I published some learning development metrics from several
different studies that included ratios for how long it takes to create different types of
learning. The information has been widely used and appears frequently throughout the
Blogosphere. Recently, we have been receiving many requests to update this data, so
Chapman Alliance created a survey to collect usable metrics that will help you benchmark
your own learning development times. This time, all of the results were collected from a
single audience (249 completed surveys) across several learning formats including instructor
–led training (ILT), Level 1 e-Learning (Basic), Level 2 e-learning (Interactive), Level 3 e-
learning (Advanced), and information about blended learning. The results are contained in
this deck.
Now, the good news… You are welcome to share this research with anyone you’d like.
Because we feel that this information is so important to the industry, we have released it
under Creative Commons, meaning that you can share the whole deck or pull-out
slides/charts and add them to your presentations, white papers, conference presentations,
etc. The only restrictions are (1) you must ALWAYS list the source of information as
“Chapman Alliance” and (2) you are NOT allowed to sell the results without written
permission from Chapman Alliance. That’s it. Enjoy!
Source Citation: Chapman, B. (2010). How Long Does it Take to Create Learning? [Research
Study]. Published by Chapman Alliance LLC. www.chapmanalliance.com](https://image.slidesharecdn.com/learningdevelopmentbenchmarking-chapmanalliance-190105200422/85/Learning-Development-Times-Benchmark-1-320.jpg)
![How Long Does it Take to Create
Learning?
A Chapman Alliance, Research Study
By Bryan Chapman, Chief Learning Strategist
bryan@chapmanalliance.com
www.chapmanalliance.com
Abstract: Several years ago, I published some learning development metrics from several
different studies that included ratios for how long it takes to create different types of
learning. The information has been widely used and appears frequently throughout the
Blogosphere. Recently, we have been receiving many requests to update this data, so
Chapman Alliance created a survey to collect usable metrics that will help you benchmark
your own learning development times. This time, all of the results were collected from a
single audience (249 completed surveys) across several learning formats including instructor
–led training (ILT), Level 1 e-Learning (Basic), Level 2 e-learning (Interactive), Level 3 e-
learning (Advanced), and information about blended learning. The results are contained in
this deck.
Now, the good news… You are welcome to share this research with anyone you’d like.
Because we feel that this information is so important to the industry, we have released it
under Creative Commons, meaning that you can share the whole deck or pull-out
slides/charts and add them to your presentations, white papers, conference presentations,
etc. The only restrictions are (1) you must ALWAYS list the source of information as
“Chapman Alliance” and (2) you are NOT allowed to sell the results without written
permission from Chapman Alliance. That’s it. Enjoy!
Source Citation: Chapman, B. (2010). How Long Does it Take to Create Learning? [Research
Study]. Published by Chapman Alliance LLC. www.chapmanalliance.com](https://image.slidesharecdn.com/learningdevelopmentbenchmarking-chapmanalliance-190105200422/75/Learning-Development-Times-Benchmark-1-2048.jpg)
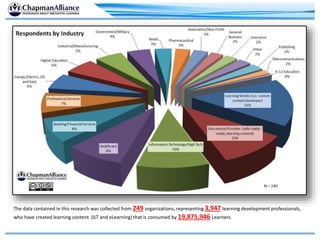
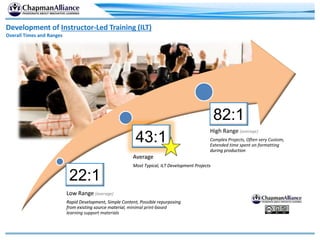
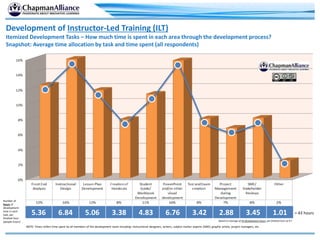

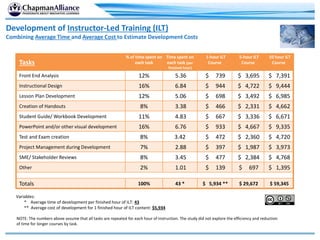
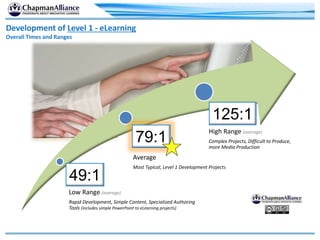
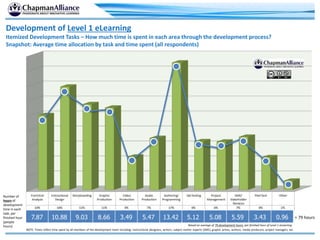
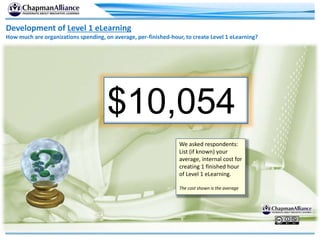
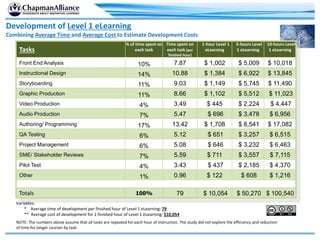

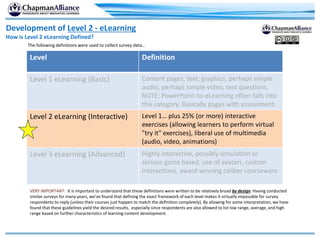
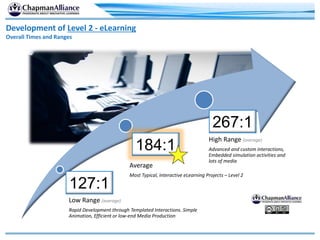
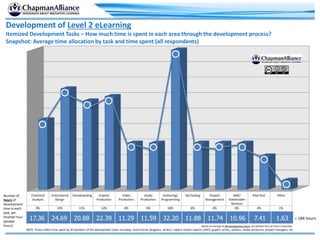

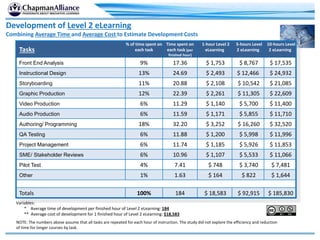
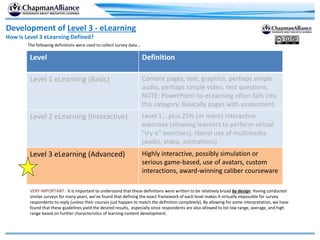

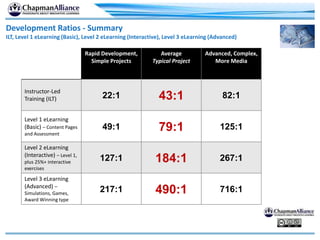


The study conducted by Chapman Alliance evaluates the time and costs involved in creating different types of learning content, including instructor-led training (ILT) and various levels of e-learning. Based on 249 completed surveys, average development times and costs are provided for ILT and levels 1, 2, and 3 of e-learning, with costs per finished hour ranging from $5,934 for ILT to $50,371 for level 3 e-learning. The study aims to give organizations benchmarking data for their own learning development projects.


![Distance Learning Ict1[1]](https://cdn.slidesharecdn.com/ss_thumbnails/distancelearningict11-090726042008-phpapp02-thumbnail.jpg?width=640&height=640&fit=bounds)


