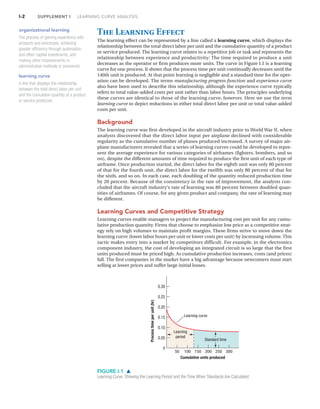
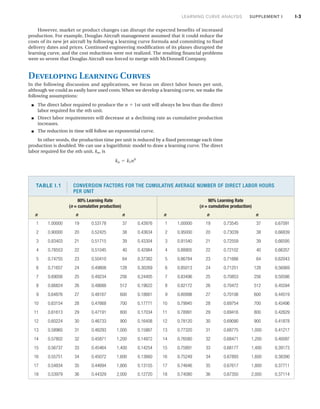
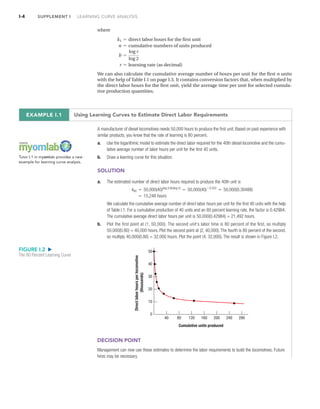
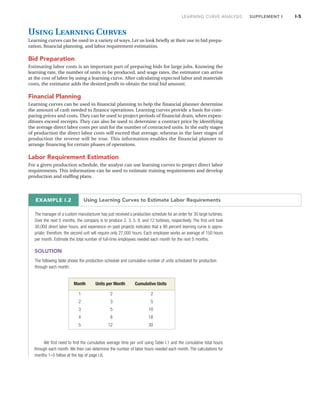
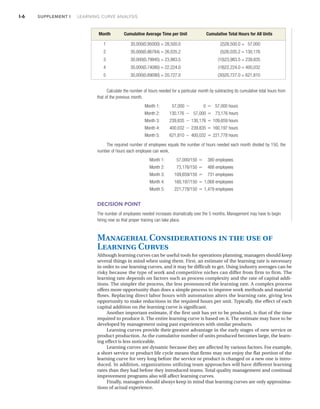
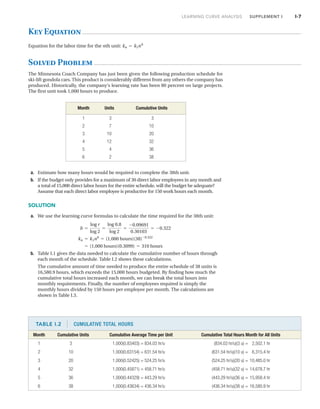
SlideShare a Scribd company logo
LEARNING GOALS
After reading this supplement, you should
be able to:
1. Explain the concept of a learning curve and
how volume is related to unit costs.
2. Develop a learning curve, using the
logarithmic model.
3. Demonstrate the use of learning curves for
managerial decision making.
I
n today‘s dynamic workplace, change occurs
rapidly. Where there is change, there also is learn-
ing. With instruction and repetition, workers learn
to perform jobs more efficiently and thereby reduce
the number of direct labor hours per unit. Like work-
ers, organizations learn.
Organizational learning involves gaining experi-
ence with products and processes, achieving greater
efficiency through automation and other capital
investments, and making other improvements in
administrative methods or personnel. Productivity
improvements may be gained from better work
methods, tools, product design, or supervision, as
well as from individual worker learning. These
improvements mean that existing standards must be
continually evaluated and new ones set.
LEARNING CURVE ANALYSIS
I
myomlab and the Companion Website at
www.pearsonhighered.com contain many tools,
activities, and resources designed for this supplement.
I-2 SUPPLEMENT I LEARNING CURVE ANALYSIS
0
0.05
0.10
0.15
0.20
0.25
0.30
50 100 150 200 250 300
Processtimeperunit(hr)
Cumulative units produced
Learning curve
Learning
period
Standard time
FIGURE I.1 ̆
Learning Curve, Showing the Learning Period and the Time When Standards Are Calculated
The Learning Effect
The learning effect can be represented by a line called a learning curve, which displays the
relationship between the total direct labor per unit and the cumulative quantity of a product
or service produced. The learning curve relates to a repetitive job or task and represents the
relationship between experience and productivity: The time required to produce a unit
decreases as the operator or firm produces more units. The curve in Figure I.1 is a learning
curve for one process. It shows that the process time per unit continually decreases until the
140th unit is produced. At that point learning is negligible and a standard time for the oper-
ation can be developed. The terms manufacturing progress function and experience curve
also have been used to describe this relationship, although the experience curve typically
refers to total value-added costs per unit rather than labor hours. The principles underlying
these curves are identical to those of the learning curve, however. Here we use the term
learning curve to depict reductions in either total direct labor per unit or total value-added
costs per unit.
Background
The learning curve was first developed in the aircraft industry prior to World War II, when
analysts discovered that the direct labor input per airplane declined with considerable
regularity as the cumulative number of planes produced increased. A survey of major air-
plane manufacturers revealed that a series of learning curves could be developed to repre-
sent the average experience for various categories of airframes (fighters, bombers, and so
on), despite the different amounts of time required to produce the first unit of each type of
airframe. Once production started, the direct labor for the eighth unit was only 80 percent
of that for the fourth unit, the direct labor for the twelfth was only 80 percent of that for
the sixth, and so on. In each case, each doubling of the quantity reduced production time
by 20 percent. Because of the consistency in the rate of improvement, the analysts con-
cluded that the aircraft industry‘s rate of learning was 80 percent between doubled quan-
tities of airframes. Of course, for any given product and company, the rate of learning may
be different.
Learning Curves and Competitive Strategy
Learning curves enable managers to project the manufacturing cost per unit for any cumu-
lative production quantity. Firms that choose to emphasize low price as a competitive strat-
egy rely on high volumes to maintain profit margins. These firms strive to move down the
learning curve (lower labor hours per unit or lower costs per unit) by increasing volume. This
tactic makes entry into a market by competitors difficult. For example, in the electronics
component industry, the cost of developing an integrated circuit is so large that the first
units produced must be priced high. As cumulative production increases, costs (and prices)
fall. The first companies in the market have a big advantage because newcomers must start
selling at lower prices and suffer large initial losses.
organizational learning
The process of gaining experience with
products and processes, achieving
greater efficiency through automation
and other capital investments, and
making other improvements in
administrative methods or personnel.
learning curve
A line that displays the relationship
between the total direct labor per unit
and the cumulative quantity of a product
or service produced.
LEARNING CURVE ANALYSIS SUPPLEMENT I I-3
However, market or product changes can disrupt the expected benefits of increased
production. For example, Douglas Aircraft management assumed that it could reduce the
costs of its new jet aircraft by following a learning curve formula and committing to fixed
delivery dates and prices. Continued engineering modification of its planes disrupted the
learning curve, and the cost reductions were not realized. The resulting financial problems
were so severe that Douglas Aircraft was forced to merge with McDonnell Company.
Developing Learning Curves
In the following discussion and applications, we focus on direct labor hours per unit,
although we could as easily have used costs.When we develop a learning curve, we make the
following assumptions:
½ The direct labor required to produce the 1st unit will always be less than the direct
labor required for the nth unit.
½ Direct labor requirements will decrease at a declining rate as cumulative production
increases.
½ The reduction in time will follow an exponential curve.
In other words, the production time per unit is reduced by a fixed percentage each time
production is doubled. We can use a logarithmic model to draw a learning curve. The direct
labor required for the nth unit, , is
kn = k1nb
kn
n +
TABLE I.1 CONVERSION FACTORS FOR THE CUMULATIVE AVERAGE NUMBER OF DIRECT LABOR HOURS
PER UNIT
80% Learning Rate
(n = cumulative production)
90% Learning Rate
(n = cumulative production)
n n n n n n
1 1.00000 19 0.53178 37 0.43976 1 1.00000 19 0.73545 37 0.67091
2 0.90000 20 0.52425 38 0.43634 2 0.95000 20 0.73039 38 0.66839
3 0.83403 21 0.51715 39 0.43304 3 0.91540 21 0.72559 39 0.66595
4 0.78553 22 0.51045 40 0.42984 4 0.88905 22 0.72102 40 0.66357
5 0.74755 23 0.50410 64 0.37382 5 0.86784 23 0.71666 64 0.62043
6 0.71657 24 0.49808 128 0.30269 6 0.85013 24 0.71251 128 0.56069
7 0.69056 25 0.49234 256 0.24405 7 0.83496 25 0.70853 256 0.50586
8 0.66824 26 0.48688 512 0.19622 8 0.82172 26 0.70472 512 0.45594
9 0.64876 27 0.48167 600 0.18661 9 0.80998 27 0.70106 600 0.44519
10 0.63154 28 0.47668 700 0.17771 10 0.79945 28 0.69754 700 0.43496
11 0.61613 29 0.47191 800 0.17034 11 0.78991 29 0.69416 800 0.42629
12 0.60224 30 0.46733 900 0.16408 12 0.78120 30 0.69090 900 0.41878
13 0.58960 31 0.46293 1,000 0.15867 13 0.77320 31 0.68775 1,000 0.41217
14 0.57802 32 0.45871 1,200 0.14972 14 0.76580 32 0.68471 1,200 0.40097
15 0.56737 33 0.45464 1,400 0.14254 15 0.75891 33 0.68177 1,400 0.39173
16 0.55751 34 0.45072 1,600 0.13660 16 0.75249 34 0.67893 1,600 0.38390
17 0.54834 35 0.44694 1,800 0.13155 17 0.74646 35 0.67617 1,800 0.37711
18 0.53979 36 0.44329 2,000 0.12720 18 0.74080 36 0.67350 2,000 0.37114
I-4 SUPPLEMENT I LEARNING CURVE ANALYSIS
where
We can also calculate the cumulative average number of hours per unit for the first n units
with the help of Table I.1 on page I.3. It contains conversion factors that, when multiplied by
the direct labor hours for the first unit, yield the average time per unit for selected cumula-
tive production quantities.
r = learning rate (as decimal)
b =
log r
log 2
n = cumulative numbers of units produced
k1 = direct labor hours for the first unit
40 80 120 160 200 240 280
0
10
20
30
40
50
Cumulative units produced
Directlaborhoursperlocomotive
(thousands)
FIGURE I.2 ̈
The 80 Percent Learning Curve
Using Learning Curves to Estimate Direct Labor RequirementsEXAMPLE I.1
A manufacturer of diesel locomotives needs 50,000 hours to produce the first unit. Based on past experience with
similar products, you know that the rate of learning is 80 percent.
a. Use the logarithmic model to estimate the direct labor required for the 40th diesel locomotive and the cumu-
lative average number of labor hours per unit for the first 40 units.
b. Draw a learning curve for this situation.
SOLUTION
a. The estimated number of direct labor hours required to produce the 40th unit is
We calculate the cumulative average number of direct labor hours per unit for the first 40 units with the help
of Table I.1. For a cumulative production of 40 units and an 80 percent learning rate, the factor is 0.42984.
The cumulative average direct labor hours per unit is 50,000(0.42984) = 21,492 hours.
b. Plot the first point at (1, 50,000). The second unit‘s labor time is 80 percent of the first, so multiply
50,000(0.80) = 40,000 hours. Plot the second point at (2, 40,000). The fourth is 80 percent of the second,
so multiply 40,000(0.80) = 32,000 hours. Plot the point (4, 32,000). The result is shown in Figure I.2.
= 15,248 hours
k40 = 50,000(40)(log 0.8)/(log 2)
= 50,000(40)-0.322
= 50,000(0.30488)
Tutor I.1 in myomlab provides a new
example for learning curve analysis.
DECISION POINT
Management can now use these estimates to determine the labor requirements to build the locomotives. Future
hires may be necessary.
LEARNING CURVE ANALYSIS SUPPLEMENT I I-5
Using Learning Curves
Learning curves can be used in a variety of ways. Let us look briefly at their use in bid prepa-
ration, financial planning, and labor requirement estimation.
Bid Preparation
Estimating labor costs is an important part of preparing bids for large jobs. Knowing the
learning rate, the number of units to be produced, and wage rates, the estimator can arrive
at the cost of labor by using a learning curve. After calculating expected labor and materials
costs, the estimator adds the desired profit to obtain the total bid amount.
Financial Planning
Learning curves can be used in financial planning to help the financial planner determine
the amount of cash needed to finance operations. Learning curves provide a basis for com-
paring prices and costs. They can be used to project periods of financial drain, when expen-
ditures exceed receipts. They can also be used to determine a contract price by identifying
the average direct labor costs per unit for the number of contracted units. In the early stages
of production the direct labor costs will exceed that average, whereas in the later stages of
production the reverse will be true. This information enables the financial planner to
arrange financing for certain phases of operations.
Labor Requirement Estimation
For a given production schedule, the analyst can use learning curves to project direct labor
requirements. This information can be used to estimate training requirements and develop
production and staffing plans.
Using Learning Curves to Estimate Labor RequirementsEXAMPLE I.2
The manager of a custom manufacturer has just received a production schedule for an order for 30 large turbines.
Over the next 5 months, the company is to produce 2, 3, 5, 8, and 12 turbines, respectively. The first unit took
30,000 direct labor hours, and experience on past projects indicates that a 90 percent learning curve is appro-
priate; therefore, the second unit will require only 27,000 hours. Each employee works an average of 150 hours
per month. Estimate the total number of full-time employees needed each month for the next 5 months.
SOLUTION
The following table shows the production schedule and cumulative number of units scheduled for production
through each month:
Month Units per Month Cumulative Units
1 2 2
2 3 5
3 5 10
4 8 18
5 12 30
We first need to find the cumulative average time per unit using Table I.1 and the cumulative total hours
through each month. We then can determine the number of labor hours needed each month. The calculations for
months 1–5 follow at the top of page I.6.
I-6 SUPPLEMENT I LEARNING CURVE ANALYSIS
Calculate the number of hours needed for a particular month by subtracting its cumulative total hours from
that of the previous month.
The required number of employees equals the number of hours needed each month divided by 150, the
number of hours each employee can work.
DECISION POINT
The number of employees needed increases dramatically over the 5 months. Management may have to begin
hiring now so that proper training can take place.
Month 5: 221,778/150 = 1,479 employees
Month 4: 160,197/150 = 1,068 employees
Month 3: 109,659/150 = 731 employees
Month 2: 73,176/150 = 488 employees
Month 1: 57,000/150 = 380 employees
Month 5: 621,810 - 400,032 = 221,778 hours
Month 4: 400,032 - 239,835 = 160,197 hours
Month 3: 239,835 - 130,176 = 109,659 hours
Month 2: 130,176 - 57,000 = 73,176 hours
Month 1: 57,000 - 0 = 57,000 hours
Month Cumulative Average Time per Unit Cumulative Total Hours for All Units
1 30,000(0.95000) = 28,500.0 (2)28,500.0 = 57,000
2 30,000(0.86784) = 26,035.2 (5)26,035.2 = 130,176
3 30,000(0.79945) = 23,983.5 (10)23,983.5 = 239,835
4 30,000(0.74080) = 22,224.0 (18)22,224.0 = 400,032
5 30,000(0.69090) = 20,727.0 (30)20,727.0 = 621,810
Managerial Considerations in the use of
Learning Curves
Although learning curves can be useful tools for operations planning, managers should keep
several things in mind when using them. First, an estimate of the learning rate is necessary
in order to use learning curves, and it may be difficult to get. Using industry averages can be
risky because the type of work and competitive niches can differ from firm to firm. The
learning rate depends on factors such as process complexity and the rate of capital addi-
tions. The simpler the process, the less pronounced the learning rate. A complex process
offers more opportunity than does a simple process to improve work methods and material
flows. Replacing direct labor hours with automation alters the learning rate, giving less
opportunity to make reductions in the required hours per unit. Typically, the effect of each
capital addition on the learning curve is significant.
Another important estimate, if the first unit has yet to be produced, is that of the time
required to produce it. The entire learning curve is based on it. The estimate may have to be
developed by management using past experiences with similar products.
Learning curves provide their greatest advantage in the early stages of new service or
product production. As the cumulative number of units produced becomes large, the learn-
ing effect is less noticeable.
Learning curves are dynamic because they are affected by various factors. For example,
a short service or product life cycle means that firms may not enjoy the flat portion of the
learning curve for very long before the service or product is changed or a new one is intro-
duced. In addition, organizations utilizing team approaches will have different learning
rates than they had before they introduced teams. Total quality management and continual
improvement programs also will affect learning curves.
Finally, managers should always keep in mind that learning curves are only approxima-
tions of actual experience.
LEARNING CURVE ANALYSIS SUPPLEMENT I I-7
Key Equation
Equation for the labor time for the nth unit: kn = k1nb
Solved Problem
The Minnesota Coach Company has just been given the following production schedule for
ski-lift gondola cars. This product is considerably different from any others the company has
produced. Historically, the company‘s learning rate has been 80 percent on large projects.
The first unit took 1,000 hours to produce.
Month Units Cumulative Units
1 3 3
2 7 10
3 10 20
4 12 32
5 4 36
6 2 38
a. Estimate how many hours would be required to complete the 38th unit.
b. If the budget only provides for a maximum of 30 direct labor employees in any month and
a total of 15,000 direct labor hours for the entire schedule, will the budget be adequate?
Assume that each direct labor employee is productive for 150 work hours each month.
SOLUTION
a. We use the learning curve formulas to calculate the time required for the 38th unit:
b. Table I.1 gives the data needed to calculate the cumulative number of hours through
each month of the schedule. Table I.2 shows these calculations.
The cumulative amount of time needed to produce the entire schedule of 38 units is
16,580.9 hours, which exceeds the 15,000 hours budgeted. By finding how much the
cumulative total hours increased each month, we can break the total hours into
monthly requirements. Finally, the number of employees required is simply the
monthly hours divided by 150 hours per employee per month. The calculations are
shown in Table I.3.
= (1,000 hours)(0.3099) = 310 hours
kn = k1nb
= (1,000 hours)(38)-0.322
b =
log r
log 2
=
log 0.8
log 2
=
-0.09691
0.30103
= -0.322
TABLE I.2 CUMULATIVE TOTAL HOURS
Month Cumulative Units Cumulative Average Time per Unit Cumulative Total Hours Month for All Units
1 3 1,000(0.83403) = 834.03 hr/u (834.03 hr/u)(3 u) = 2,502.1 hr
2 10 1,000(0.63154) = 631.54 hr/u (631.54 hr/u)(10 u) = 6,315.4 hr
3 20 1,000(0.52425) = 524.25 hr/u (524.25 hr/u)(20 u) = 10,485.0 hr
4 32 1,000(0.45871) = 458.71 hr/u (458.71 hr/u)(32 u) = 14,678.7 hr
5 36 1,000(0.44329) = 443.29 hr/u (443.29 hr/u)(36 u) = 15,958.4 hr
6 38 1,000(0.43634) = 436.34 hr/u (436.34 hr/u)(38 u) = 16,580.9 hr
I-8 SUPPLEMENT I LEARNING CURVE ANALYSIS
The schedule is feasible in terms of the maximum direct labor required in any month
because it never exceeds 28 employees. However, the total cumulative hours are
16,581, which exceeds the budgeted amount by 1,581 hours. Therefore, the budget will
not be adequate.
a. How many total hours are required to complete 64
chain saws?
b. How many hours of work are required for the week
ending on Friday the 13th?
c. Will Freddie and Jason be able to keep their same-
week service promise during their busiest week just
before Halloween?
5. The Bovine Products Company recently introduced a
new automatic milking system for cows. The company
just completed an order for 16 units. The last unit
required 15 hours of labor, and the learning rate is esti-
mated to be 90 percent on such systems. Another cus-
tomer has just placed an order for the same system. This
Week Units
1 20
2 65
3 100
4 140
5 120
Week Units Cumulative Units
October 2–6 8 8
October 9–13 19 27
October 16–20 10 37
October 23–27 27 64
Problems
1. Mass Balance Company is manufacturing a new digital
scale for use by a large chemical company. The order is
for 40 units. The first scale took 60 hours of direct labor.
The second unit took 48 hours to complete.
a. What is the learning rate?
b. What is the estimated time for the 40th unit?
c. What is the estimated total time for producing all
40 units?
d. What is the average time per unit for producing the
last 10 units (#31–#40)?
2. Cambridge Instruments is an aircraft instrumentation
manufacturer. It has received a contract from the U.S.
Department of Defense to produce 30 radar units for a
military fighter plane. The first unit took 85 hours to pro-
duce. Based on past experience with manufacturing simi-
lar units, Cambridge estimates that the learning rate is
93 percent. How long will it take to produce the 5th unit?
The 10th? The 15th? The final unit?
3. A large grocery corporation has developed the following
schedule for converting frozen food display cases to use
CFC-free refrigerant:
week. If the first unit took 30 hours to convert, is this
schedule feasible? If not, how can it be altered? Are addi-
tional costs involved in altering it?
4. Freddie and Jason have just opened the Texas Toothpick,
a chain-saw sharpening and repair service located on
Elm Street. The Texas Toothpick promises same-week
repair service. Freddie and Jason are concerned that a
projected dramatic increase in demand as the end of
October nears will cause service to deteriorate. Freddie
and Jason have had difficulty attracting employees, so
they are the only workers available to complete the work.
Safety considerations require that they each work no
more than 40 hours per week. The first chain-saw sharp-
ening and repair required 7 hours of work, and an 80 per-
cent learning curve is anticipated.
Historically, the learning rate has been 90 percent on such
projects. The budget allows for a maximum of 40 direct
labor employees per week and a total of 8,000 direct labor
hours for the entire schedule. Assume 40 work hours per
TABLE I.3 DIRECT LABOR EMPLOYEES
Month Cumulative Total Hours for Month Direct Labor Workers by Month
1 2,502.1 – 0 = 2,502.1 hr (2,502.1 hr)/(150 hr) = 16.7, or 17
2 6,315.4 – 2,502.1 = 3,813.3 hr (3,813.3 hr)/(150 hr) = 25.4, or 26
3 10,485.0 – 6,315.4 = 4,169.6 hr (4,169.6 hr)/(150 hr) = 27.8, or 28
4 14,678.7 – 10,485.0 = 4,193.7 hr (4,193.7 hr)/(150 hr) = 27.9, or 28
5 15,958.4 – 14,678.7 = 1,279.7 hr (1,279.7 hr)/(150 hr) = 8.5, or 9
6 16,580.9 – 15,958.4 = 622.5 hr (622.5 hr)/(150 hr) = 4.2, or 5
LEARNING CURVE ANALYSIS SUPPLEMENT I I-9
customer, which owns many farms in the Midwest, wants
48 units. How many total labor hours will be needed to
satisfy this order?
6. You are in charge of a large assembly shop that special-
izes in contract assignments. One of your customers has
promised to award you a large contract for the assembly
of 1,000 units of a new product. The suggested bid price
in the contract is based on an average of 20 hours of
direct labor per unit. You conduct a couple of test assem-
blies and find that, although the first unit took 50 hours,
the second unit could be completed in just 40 hours.
a. How many hours do you expect the assembly of the
third unit to take?
b. How many hours do you expect the assembly of the
100th unit to take?
c. Is the contract‘s assumption about the average labor
hours per unit valid or should the price be revised?
7. The personnel manager at Powerwest Inc. wants to esti-
mate the direct and cumulative average direct labor
hours for producing 30 locomotive train units during the
next year. He estimates from past experience that the
learning rate is 90 percent. The production department
estimates that manufacturing the first unit will take
30,000 hours. Each employee averages 200 hours per
month. The production rate forecast is as follows:
8. The Really Big Six Corporation will hire 1,000 new accoun-
tants this year. Managers are considering whether to make
or to buy office furniture for the new hires. Big can pur-
chase office furniture for $2,000 per accountant, or it can
make the desks itself. Equipment to assemble furniture can
be scrounged from the company‘s carpentry shop. That old
equipment has already been fully depreciated. Materials
cost $500 per desk, and labor (and benefits) costs $30 per
hour. Big hired a local shop to build a prototype desk. That
desk required 100 hours of labor. If the learning curve is 90
percent, should Big make or buy the desks?
9. Although the learning curve never completely levels off
to a horizontal line, if work standards are to be devel-
oped, there must be a point at which, for all practical
purposes, learning is said to have stopped. If we have an
80 percent learning curve and say that the learning effect
will be masked by other variables when the improvement
in successive units is less than 0.5 percent, at about what
unit number can the standard be set?
10. The Compton Company is manufacturing a solar grain
dryer that requires methods and materials never before
used by the company. The order is for 80 units. The first
unit took 46 direct labor hours, whereas the 10th unit
took only 24 direct labor hours.
a. Estimate the rate of learning that occurred for this
product.
b. Use the learning rate in part (a) to estimate direct
labor hours for the 80th unit.
11. The Hand-To-Mouth Company (HTM) has $200,000 in
cash, no inventory, and a 90 percent learning curve. To
reduce the complexity of this problem, ignore the hiring
and training costs associated with dramatically increased
production. Employees are paid $20 per hour every
Friday for that week‘s work. HTM has received an order
to build 1,000 oak desks over the next 15 weeks. Materials
cost $400 per desk. Suppliers make deliveries each
Monday and insist on cash upon delivery. The first desk
takes 100 hours of direct labor to build. HTM will be paid
$1,500 per desk two weeks after the desks are delivered.
Should HTM take this order?
Month
Production
Rate (units) Month
Production Rate
(units)
January 2 July 2
February 3 August 4
March 2 September 3
April 4 October 3
May 3 November 1
June 2 December 1
a. How many direct hours are required to produce the
30th unit?
b. How many total hours are needed to produce all
30 units?
c. What is the maximum number of employees required
next year?
d. If the learning rate were changed to 0.85, what would
be the impact on the total hours and the number of
employees needed to produce 30 units?
Week Units Week Units Week Units
1 2 6 24 11 88
2 4 7 64 12 100
3 8 8 128 13 100
4 12 9 128 14 100
5 14 10 128 15 100
Total 1,000
Selected References
Abernathy, William J., and Kenneth Wayne. “Limits of the
Learning Curve.” Harvard Business Review (September–
October 1974), pp. 109–119.
Senge, Peter M. “The Leader‘s New Work: Building Learning
Organizations.” The Sloan Management Review (Fall 1990),
pp. 7–23.
Yelle, Louis E. “The Learning Curve: Historical Review and
Comprehensive Survey.” Decision Sciences, vol. 10, no. 2
(1979), pp. 302–328.

More Related Content

What's hot

Microeconomics: Cost Functions
Microeconomics: Cost FunctionsMicroeconomics: Cost Functions
Nani quantitative theory of money
Nani quantitative theory of moneyNani quantitative theory of money
Nani quantitative theory of money
Vikram g b
 
Law of variable proportions
Law of variable proportionsLaw of variable proportions
Law of variable proportions
Sachin Paurush
 
Process costing
Process costingProcess costing
Process costing
grvthakkar
 
BREAK EVEN ANALYSIS GRAPH WITH EXPLANATION
BREAK EVEN ANALYSIS GRAPH WITH EXPLANATIONBREAK EVEN ANALYSIS GRAPH WITH EXPLANATION
BREAK EVEN ANALYSIS GRAPH WITH EXPLANATION
Navya Jayakumar
 
National income
National incomeNational income
National income
BhushanBiradar1
 
logistic costing
logistic costinglogistic costing
logistic costing
GanesaMoorthyv
 
Marginal costing
Marginal costing Marginal costing
Marginal costing
student
 
Labour cost
Labour costLabour cost
Labour cost
faizchhipa
 
Unit 2 c
Unit 2 cUnit 2 c
Unit 2 c
ushamuthu
 
Nidhi ppt (production function)
Nidhi ppt (production function)Nidhi ppt (production function)
Nidhi ppt (production function)
Nidhi Panday
 
Materials cost accounting
Materials cost accountingMaterials cost accounting
Materials cost accounting
Achal Singhal
 
Cost Driver
Cost DriverCost Driver
Cost Driver
Dr. Rana Singh
 
Chapter 16-marginal-costing and cvp analysis
Chapter 16-marginal-costing and cvp analysisChapter 16-marginal-costing and cvp analysis
Chapter 16-marginal-costing and cvp analysis
Ashvin Vala
 
Theory of the Firm Lecture Notes (Economics)
Theory of the Firm Lecture Notes (Economics)Theory of the Firm Lecture Notes (Economics)
Theory of the Firm Lecture Notes (Economics)
FellowBuddy.com
 
Production Function.ppt
Production Function.pptProduction Function.ppt
Production Function.ppt
MasterVINAY
 
Microeconomics ii
Microeconomics iiMicroeconomics ii
Microeconomics ii
Upananda Witta
 
Mefa unit iii material(market stuructures and pricing methods)
Mefa unit iii material(market stuructures and pricing methods)Mefa unit iii material(market stuructures and pricing methods)
Mefa unit iii material(market stuructures and pricing methods)
Dr. Durgaprasad Navulla
 
Theory of firm
Theory of firmTheory of firm
Theory of firm
Umamaheswari Gopal
 
Activity Based Costing
Activity Based CostingActivity Based Costing
Activity Based Costing
Vikas Gupta
 

What's hot (20)

Microeconomics: Cost Functions
Microeconomics: Cost FunctionsMicroeconomics: Cost Functions
Microeconomics: Cost Functions
 
Nani quantitative theory of money
Nani quantitative theory of moneyNani quantitative theory of money
Nani quantitative theory of money
 
Law of variable proportions
Law of variable proportionsLaw of variable proportions
Law of variable proportions
 
Process costing
Process costingProcess costing
Process costing
 
BREAK EVEN ANALYSIS GRAPH WITH EXPLANATION
BREAK EVEN ANALYSIS GRAPH WITH EXPLANATIONBREAK EVEN ANALYSIS GRAPH WITH EXPLANATION
BREAK EVEN ANALYSIS GRAPH WITH EXPLANATION
 
National income
National incomeNational income
National income
 
logistic costing
logistic costinglogistic costing
logistic costing
 
Marginal costing
Marginal costing Marginal costing
Marginal costing
 
Labour cost
Labour costLabour cost
Labour cost
 
Unit 2 c
Unit 2 cUnit 2 c
Unit 2 c
 
Nidhi ppt (production function)
Nidhi ppt (production function)Nidhi ppt (production function)
Nidhi ppt (production function)
 
Materials cost accounting
Materials cost accountingMaterials cost accounting
Materials cost accounting
 
Cost Driver
Cost DriverCost Driver
Cost Driver
 
Chapter 16-marginal-costing and cvp analysis
Chapter 16-marginal-costing and cvp analysisChapter 16-marginal-costing and cvp analysis
Chapter 16-marginal-costing and cvp analysis
 
Theory of the Firm Lecture Notes (Economics)
Theory of the Firm Lecture Notes (Economics)Theory of the Firm Lecture Notes (Economics)
Theory of the Firm Lecture Notes (Economics)
 
Production Function.ppt
Production Function.pptProduction Function.ppt
Production Function.ppt
 
Microeconomics ii
Microeconomics iiMicroeconomics ii
Microeconomics ii
 
Mefa unit iii material(market stuructures and pricing methods)
Mefa unit iii material(market stuructures and pricing methods)Mefa unit iii material(market stuructures and pricing methods)
Mefa unit iii material(market stuructures and pricing methods)
 
Theory of firm
Theory of firmTheory of firm
Theory of firm
 
Activity Based Costing
Activity Based CostingActivity Based Costing
Activity Based Costing
 

Similar to Learning curve analysis

Learning Curveskjirfiijiiiiiiiiiiiiiiiiiiiiiiiiiiiiiii
Learning CurveskjirfiijiiiiiiiiiiiiiiiiiiiiiiiiiiiiiiiLearning Curveskjirfiijiiiiiiiiiiiiiiiiiiiiiiiiiiiiiii
Learning Curveskjirfiijiiiiiiiiiiiiiiiiiiiiiiiiiiiiiii
yatineb313
 
Learn curve
Learn curveLearn curve
Learn curve
Ulisses Viana
 
4 Activity-Based Costing and Just-In-Time CostinghoudreiS.docx
4 Activity-Based Costing and Just-In-Time CostinghoudreiS.docx4 Activity-Based Costing and Just-In-Time CostinghoudreiS.docx
4 Activity-Based Costing and Just-In-Time CostinghoudreiS.docx
tamicawaysmith
 
You have been called in as a consultant to set up a kanban control system
You have been called in as a consultant to set up a kanban control systemYou have been called in as a consultant to set up a kanban control system
You have been called in as a consultant to set up a kanban control system
ramuaa130
 
Which of the following basic types of production layout formats is one that h...
Which of the following basic types of production layout formats is one that h...Which of the following basic types of production layout formats is one that h...
Which of the following basic types of production layout formats is one that h...
ramuaa128
 
Getting an autograph from a famous person might involve standing in which typ...
Getting an autograph from a famous person might involve standing in which typ...Getting an autograph from a famous person might involve standing in which typ...
Getting an autograph from a famous person might involve standing in which typ...
ramuaa127
 
Which of the following is a fixed time-period inventory model
Which of the following is a fixed time-period inventory modelWhich of the following is a fixed time-period inventory model
Which of the following is a fixed time-period inventory model
ramuaa129
 
From an operational perspective, yield management is most effective under whi...
From an operational perspective, yield management is most effective under whi...From an operational perspective, yield management is most effective under whi...
From an operational perspective, yield management is most effective under whi...
ramuaa127
 
UOPOPS571 Lessons in Excellence--uopops571.com
UOPOPS571 Lessons in Excellence--uopops571.comUOPOPS571 Lessons in Excellence--uopops571.com
UOPOPS571 Lessons in Excellence--uopops571.com
thomashard90
 
Ops 571 final exam guide (new, 2018) you have been called in as a consultant ...
Ops 571 final exam guide (new, 2018) you have been called in as a consultant ...Ops 571 final exam guide (new, 2018) you have been called in as a consultant ...
Ops 571 final exam guide (new, 2018) you have been called in as a consultant ...
ramuaa124
 
Which of the following approaches to service design is characterized by havin...
Which of the following approaches to service design is characterized by havin...Which of the following approaches to service design is characterized by havin...
Which of the following approaches to service design is characterized by havin...
ramuaa128
 
Uop ops-571-final-exam-guide- new--2018_
Uop ops-571-final-exam-guide- new--2018_Uop ops-571-final-exam-guide- new--2018_
Uop ops-571-final-exam-guide- new--2018_
indi7257
 
Activity based costing
Activity based costingActivity based costing
Activity based costing
Mahesh Chandra Sharma
 
OPS 571 HELP Inspiring Innovation--ops571help.com
OPS 571 HELP Inspiring Innovation--ops571help.comOPS 571 HELP Inspiring Innovation--ops571help.com
OPS 571 HELP Inspiring Innovation--ops571help.com
claric77
 
Ops 571 final exam guide (new, 2018) you have been called in as a consultant ...
Ops 571 final exam guide (new, 2018) you have been called in as a consultant ...Ops 571 final exam guide (new, 2018) you have been called in as a consultant ...
Ops 571 final exam guide (new, 2018) you have been called in as a consultant ...
never1239
 
What is transaction processing
What is transaction processingWhat is transaction processing
What is transaction processing
johann11372
 
For an infinite queuing situation, if the arrival rate for loading trucks is ...
For an infinite queuing situation, if the arrival rate for loading trucks is ...For an infinite queuing situation, if the arrival rate for loading trucks is ...
For an infinite queuing situation, if the arrival rate for loading trucks is ...
ramuaa126
 
For an infinite queuing situation, if the arrival rate for loading trucks is ...
For an infinite queuing situation, if the arrival rate for loading trucks is ...For an infinite queuing situation, if the arrival rate for loading trucks is ...
For an infinite queuing situation, if the arrival rate for loading trucks is ...
yearstart2
 
Which of the following is an input to the master production schedule (mps)
Which of the following is an input to the master production schedule (mps)Which of the following is an input to the master production schedule (mps)
Which of the following is an input to the master production schedule (mps)
johann11374
 
For which of the following should we use a p chart to monitor process quality
For which of the following should we use a p chart to monitor process qualityFor which of the following should we use a p chart to monitor process quality
For which of the following should we use a p chart to monitor process quality
yearstart2
 

Similar to Learning curve analysis (20)

Learning Curveskjirfiijiiiiiiiiiiiiiiiiiiiiiiiiiiiiiii
Learning CurveskjirfiijiiiiiiiiiiiiiiiiiiiiiiiiiiiiiiiLearning Curveskjirfiijiiiiiiiiiiiiiiiiiiiiiiiiiiiiiii
Learning Curveskjirfiijiiiiiiiiiiiiiiiiiiiiiiiiiiiiiii
 
Learn curve
Learn curveLearn curve
Learn curve
 
4 Activity-Based Costing and Just-In-Time CostinghoudreiS.docx
4 Activity-Based Costing and Just-In-Time CostinghoudreiS.docx4 Activity-Based Costing and Just-In-Time CostinghoudreiS.docx
4 Activity-Based Costing and Just-In-Time CostinghoudreiS.docx
 
You have been called in as a consultant to set up a kanban control system
You have been called in as a consultant to set up a kanban control systemYou have been called in as a consultant to set up a kanban control system
You have been called in as a consultant to set up a kanban control system
 
Which of the following basic types of production layout formats is one that h...
Which of the following basic types of production layout formats is one that h...Which of the following basic types of production layout formats is one that h...
Which of the following basic types of production layout formats is one that h...
 
Getting an autograph from a famous person might involve standing in which typ...
Getting an autograph from a famous person might involve standing in which typ...Getting an autograph from a famous person might involve standing in which typ...
Getting an autograph from a famous person might involve standing in which typ...
 
Which of the following is a fixed time-period inventory model
Which of the following is a fixed time-period inventory modelWhich of the following is a fixed time-period inventory model
Which of the following is a fixed time-period inventory model
 
From an operational perspective, yield management is most effective under whi...
From an operational perspective, yield management is most effective under whi...From an operational perspective, yield management is most effective under whi...
From an operational perspective, yield management is most effective under whi...
 
UOPOPS571 Lessons in Excellence--uopops571.com
UOPOPS571 Lessons in Excellence--uopops571.comUOPOPS571 Lessons in Excellence--uopops571.com
UOPOPS571 Lessons in Excellence--uopops571.com
 
Ops 571 final exam guide (new, 2018) you have been called in as a consultant ...
Ops 571 final exam guide (new, 2018) you have been called in as a consultant ...Ops 571 final exam guide (new, 2018) you have been called in as a consultant ...
Ops 571 final exam guide (new, 2018) you have been called in as a consultant ...
 
Which of the following approaches to service design is characterized by havin...
Which of the following approaches to service design is characterized by havin...Which of the following approaches to service design is characterized by havin...
Which of the following approaches to service design is characterized by havin...
 
Uop ops-571-final-exam-guide- new--2018_
Uop ops-571-final-exam-guide- new--2018_Uop ops-571-final-exam-guide- new--2018_
Uop ops-571-final-exam-guide- new--2018_
 
Activity based costing
Activity based costingActivity based costing
Activity based costing
 
OPS 571 HELP Inspiring Innovation--ops571help.com
OPS 571 HELP Inspiring Innovation--ops571help.comOPS 571 HELP Inspiring Innovation--ops571help.com
OPS 571 HELP Inspiring Innovation--ops571help.com
 
Ops 571 final exam guide (new, 2018) you have been called in as a consultant ...
Ops 571 final exam guide (new, 2018) you have been called in as a consultant ...Ops 571 final exam guide (new, 2018) you have been called in as a consultant ...
Ops 571 final exam guide (new, 2018) you have been called in as a consultant ...
 
What is transaction processing
What is transaction processingWhat is transaction processing
What is transaction processing
 
For an infinite queuing situation, if the arrival rate for loading trucks is ...
For an infinite queuing situation, if the arrival rate for loading trucks is ...For an infinite queuing situation, if the arrival rate for loading trucks is ...
For an infinite queuing situation, if the arrival rate for loading trucks is ...
 
For an infinite queuing situation, if the arrival rate for loading trucks is ...
For an infinite queuing situation, if the arrival rate for loading trucks is ...For an infinite queuing situation, if the arrival rate for loading trucks is ...
For an infinite queuing situation, if the arrival rate for loading trucks is ...
 
Which of the following is an input to the master production schedule (mps)
Which of the following is an input to the master production schedule (mps)Which of the following is an input to the master production schedule (mps)
Which of the following is an input to the master production schedule (mps)
 
For which of the following should we use a p chart to monitor process quality
For which of the following should we use a p chart to monitor process qualityFor which of the following should we use a p chart to monitor process quality
For which of the following should we use a p chart to monitor process quality
 

Recently uploaded

Supermarket Management System Project Report.pdf
Supermarket Management System Project Report.pdfSupermarket Management System Project Report.pdf
Supermarket Management System Project Report.pdf
Kamal Acharya
 
一比一原版(uoft毕业证书)加拿大多伦多大学毕业证如何办理
一比一原版(uoft毕业证书)加拿大多伦多大学毕业证如何办理一比一原版(uoft毕业证书)加拿大多伦多大学毕业证如何办理
一比一原版(uoft毕业证书)加拿大多伦多大学毕业证如何办理
sydezfe
 
NATURAL DEEP EUTECTIC SOLVENTS AS ANTI-FREEZING AGENT
NATURAL DEEP EUTECTIC SOLVENTS AS ANTI-FREEZING AGENTNATURAL DEEP EUTECTIC SOLVENTS AS ANTI-FREEZING AGENT
NATURAL DEEP EUTECTIC SOLVENTS AS ANTI-FREEZING AGENT
Addu25809
 
SCALING OF MOS CIRCUITS m .pptx
SCALING OF MOS CIRCUITS m                 .pptxSCALING OF MOS CIRCUITS m                 .pptx
SCALING OF MOS CIRCUITS m .pptx
harshapolam10
 
Introduction to Computer Networks & OSI MODEL.ppt
Introduction to Computer Networks & OSI MODEL.pptIntroduction to Computer Networks & OSI MODEL.ppt
Introduction to Computer Networks & OSI MODEL.ppt
Dwarkadas J Sanghvi College of Engineering
 
Height and depth gauge linear metrology.pdf
Height and depth gauge linear metrology.pdfHeight and depth gauge linear metrology.pdf
Height and depth gauge linear metrology.pdf
q30122000
 
Zener Diode and its V-I Characteristics and Applications
Zener Diode and its V-I Characteristics and ApplicationsZener Diode and its V-I Characteristics and Applications
Zener Diode and its V-I Characteristics and Applications
Shiny Christobel
 
Tools & Techniques for Commissioning and Maintaining PV Systems W-Animations ...
Tools & Techniques for Commissioning and Maintaining PV Systems W-Animations ...Tools & Techniques for Commissioning and Maintaining PV Systems W-Animations ...
Tools & Techniques for Commissioning and Maintaining PV Systems W-Animations ...
Transcat
 
一比一原版(USF毕业证)旧金山大学毕业证如何办理
一比一原版(USF毕业证)旧金山大学毕业证如何办理一比一原版(USF毕业证)旧金山大学毕业证如何办理
一比一原版(USF毕业证)旧金山大学毕业证如何办理
uqyfuc
 
一比一原版(osu毕业证书)美国俄勒冈州立大学毕业证如何办理
一比一原版(osu毕业证书)美国俄勒冈州立大学毕业证如何办理一比一原版(osu毕业证书)美国俄勒冈州立大学毕业证如何办理
一比一原版(osu毕业证书)美国俄勒冈州立大学毕业证如何办理
upoux
 
Applications of artificial Intelligence in Mechanical Engineering.pdf
Applications of artificial Intelligence in Mechanical Engineering.pdfApplications of artificial Intelligence in Mechanical Engineering.pdf
Applications of artificial Intelligence in Mechanical Engineering.pdf
Atif Razi
 
Open Channel Flow: fluid flow with a free surface
Open Channel Flow: fluid flow with a free surfaceOpen Channel Flow: fluid flow with a free surface
Open Channel Flow: fluid flow with a free surface
Indrajeet sahu
 
SENTIMENT ANALYSIS ON PPT AND Project template_.pptx
SENTIMENT ANALYSIS ON PPT AND Project template_.pptxSENTIMENT ANALYSIS ON PPT AND Project template_.pptx
SENTIMENT ANALYSIS ON PPT AND Project template_.pptx
b0754201
 
4. Mosca vol I -Fisica-Tipler-5ta-Edicion-Vol-1.pdf
4. Mosca vol I -Fisica-Tipler-5ta-Edicion-Vol-1.pdf4. Mosca vol I -Fisica-Tipler-5ta-Edicion-Vol-1.pdf
4. Mosca vol I -Fisica-Tipler-5ta-Edicion-Vol-1.pdf
Gino153088
 
Data Driven Maintenance | UReason Webinar
Data Driven Maintenance | UReason WebinarData Driven Maintenance | UReason Webinar
Data Driven Maintenance | UReason Webinar
UReason
 
Object Oriented Analysis and Design - OOAD
Object Oriented Analysis and Design - OOADObject Oriented Analysis and Design - OOAD
Object Oriented Analysis and Design - OOAD
PreethaV16
 
原版制作(Humboldt毕业证书)柏林大学毕业证学位证一模一样
原版制作(Humboldt毕业证书)柏林大学毕业证学位证一模一样原版制作(Humboldt毕业证书)柏林大学毕业证学位证一模一样
原版制作(Humboldt毕业证书)柏林大学毕业证学位证一模一样
ydzowc
 
LLM Fine Tuning with QLoRA Cassandra Lunch 4, presented by Anant
LLM Fine Tuning with QLoRA Cassandra Lunch 4, presented by AnantLLM Fine Tuning with QLoRA Cassandra Lunch 4, presented by Anant
LLM Fine Tuning with QLoRA Cassandra Lunch 4, presented by Anant
Anant Corporation
 
Null Bangalore | Pentesters Approach to AWS IAM
Null Bangalore | Pentesters Approach to AWS IAMNull Bangalore | Pentesters Approach to AWS IAM
Null Bangalore | Pentesters Approach to AWS IAM
Divyanshu
 
Use PyCharm for remote debugging of WSL on a Windo cf5c162d672e4e58b4dde5d797...
Use PyCharm for remote debugging of WSL on a Windo cf5c162d672e4e58b4dde5d797...Use PyCharm for remote debugging of WSL on a Windo cf5c162d672e4e58b4dde5d797...
Use PyCharm for remote debugging of WSL on a Windo cf5c162d672e4e58b4dde5d797...
shadow0702a
 

Recently uploaded (20)

Supermarket Management System Project Report.pdf
Supermarket Management System Project Report.pdfSupermarket Management System Project Report.pdf
Supermarket Management System Project Report.pdf
 
一比一原版(uoft毕业证书)加拿大多伦多大学毕业证如何办理
一比一原版(uoft毕业证书)加拿大多伦多大学毕业证如何办理一比一原版(uoft毕业证书)加拿大多伦多大学毕业证如何办理
一比一原版(uoft毕业证书)加拿大多伦多大学毕业证如何办理
 
NATURAL DEEP EUTECTIC SOLVENTS AS ANTI-FREEZING AGENT
NATURAL DEEP EUTECTIC SOLVENTS AS ANTI-FREEZING AGENTNATURAL DEEP EUTECTIC SOLVENTS AS ANTI-FREEZING AGENT
NATURAL DEEP EUTECTIC SOLVENTS AS ANTI-FREEZING AGENT
 
SCALING OF MOS CIRCUITS m .pptx
SCALING OF MOS CIRCUITS m                 .pptxSCALING OF MOS CIRCUITS m                 .pptx
SCALING OF MOS CIRCUITS m .pptx
 
Introduction to Computer Networks & OSI MODEL.ppt
Introduction to Computer Networks & OSI MODEL.pptIntroduction to Computer Networks & OSI MODEL.ppt
Introduction to Computer Networks & OSI MODEL.ppt
 
Height and depth gauge linear metrology.pdf
Height and depth gauge linear metrology.pdfHeight and depth gauge linear metrology.pdf
Height and depth gauge linear metrology.pdf
 
Zener Diode and its V-I Characteristics and Applications
Zener Diode and its V-I Characteristics and ApplicationsZener Diode and its V-I Characteristics and Applications
Zener Diode and its V-I Characteristics and Applications
 
Tools & Techniques for Commissioning and Maintaining PV Systems W-Animations ...
Tools & Techniques for Commissioning and Maintaining PV Systems W-Animations ...Tools & Techniques for Commissioning and Maintaining PV Systems W-Animations ...
Tools & Techniques for Commissioning and Maintaining PV Systems W-Animations ...
 
一比一原版(USF毕业证)旧金山大学毕业证如何办理
一比一原版(USF毕业证)旧金山大学毕业证如何办理一比一原版(USF毕业证)旧金山大学毕业证如何办理
一比一原版(USF毕业证)旧金山大学毕业证如何办理
 
一比一原版(osu毕业证书)美国俄勒冈州立大学毕业证如何办理
一比一原版(osu毕业证书)美国俄勒冈州立大学毕业证如何办理一比一原版(osu毕业证书)美国俄勒冈州立大学毕业证如何办理
一比一原版(osu毕业证书)美国俄勒冈州立大学毕业证如何办理
 
Applications of artificial Intelligence in Mechanical Engineering.pdf
Applications of artificial Intelligence in Mechanical Engineering.pdfApplications of artificial Intelligence in Mechanical Engineering.pdf
Applications of artificial Intelligence in Mechanical Engineering.pdf
 
Open Channel Flow: fluid flow with a free surface
Open Channel Flow: fluid flow with a free surfaceOpen Channel Flow: fluid flow with a free surface
Open Channel Flow: fluid flow with a free surface
 
SENTIMENT ANALYSIS ON PPT AND Project template_.pptx
SENTIMENT ANALYSIS ON PPT AND Project template_.pptxSENTIMENT ANALYSIS ON PPT AND Project template_.pptx
SENTIMENT ANALYSIS ON PPT AND Project template_.pptx
 
4. Mosca vol I -Fisica-Tipler-5ta-Edicion-Vol-1.pdf
4. Mosca vol I -Fisica-Tipler-5ta-Edicion-Vol-1.pdf4. Mosca vol I -Fisica-Tipler-5ta-Edicion-Vol-1.pdf
4. Mosca vol I -Fisica-Tipler-5ta-Edicion-Vol-1.pdf
 
Data Driven Maintenance | UReason Webinar
Data Driven Maintenance | UReason WebinarData Driven Maintenance | UReason Webinar
Data Driven Maintenance | UReason Webinar
 
Object Oriented Analysis and Design - OOAD
Object Oriented Analysis and Design - OOADObject Oriented Analysis and Design - OOAD
Object Oriented Analysis and Design - OOAD
 
原版制作(Humboldt毕业证书)柏林大学毕业证学位证一模一样
原版制作(Humboldt毕业证书)柏林大学毕业证学位证一模一样原版制作(Humboldt毕业证书)柏林大学毕业证学位证一模一样
原版制作(Humboldt毕业证书)柏林大学毕业证学位证一模一样
 
LLM Fine Tuning with QLoRA Cassandra Lunch 4, presented by Anant
LLM Fine Tuning with QLoRA Cassandra Lunch 4, presented by AnantLLM Fine Tuning with QLoRA Cassandra Lunch 4, presented by Anant
LLM Fine Tuning with QLoRA Cassandra Lunch 4, presented by Anant
 
Null Bangalore | Pentesters Approach to AWS IAM
Null Bangalore | Pentesters Approach to AWS IAMNull Bangalore | Pentesters Approach to AWS IAM
Null Bangalore | Pentesters Approach to AWS IAM
 
Use PyCharm for remote debugging of WSL on a Windo cf5c162d672e4e58b4dde5d797...
Use PyCharm for remote debugging of WSL on a Windo cf5c162d672e4e58b4dde5d797...Use PyCharm for remote debugging of WSL on a Windo cf5c162d672e4e58b4dde5d797...
Use PyCharm for remote debugging of WSL on a Windo cf5c162d672e4e58b4dde5d797...
 

Learning curve analysis

  • 1. LEARNING GOALS After reading this supplement, you should be able to: 1. Explain the concept of a learning curve and how volume is related to unit costs. 2. Develop a learning curve, using the logarithmic model. 3. Demonstrate the use of learning curves for managerial decision making. I n today‘s dynamic workplace, change occurs rapidly. Where there is change, there also is learn- ing. With instruction and repetition, workers learn to perform jobs more efficiently and thereby reduce the number of direct labor hours per unit. Like work- ers, organizations learn. Organizational learning involves gaining experi- ence with products and processes, achieving greater efficiency through automation and other capital investments, and making other improvements in administrative methods or personnel. Productivity improvements may be gained from better work methods, tools, product design, or supervision, as well as from individual worker learning. These improvements mean that existing standards must be continually evaluated and new ones set. LEARNING CURVE ANALYSIS I myomlab and the Companion Website at www.pearsonhighered.com contain many tools, activities, and resources designed for this supplement.
  • 2. I-2 SUPPLEMENT I LEARNING CURVE ANALYSIS 0 0.05 0.10 0.15 0.20 0.25 0.30 50 100 150 200 250 300 Processtimeperunit(hr) Cumulative units produced Learning curve Learning period Standard time FIGURE I.1 ̆ Learning Curve, Showing the Learning Period and the Time When Standards Are Calculated The Learning Effect The learning effect can be represented by a line called a learning curve, which displays the relationship between the total direct labor per unit and the cumulative quantity of a product or service produced. The learning curve relates to a repetitive job or task and represents the relationship between experience and productivity: The time required to produce a unit decreases as the operator or firm produces more units. The curve in Figure I.1 is a learning curve for one process. It shows that the process time per unit continually decreases until the 140th unit is produced. At that point learning is negligible and a standard time for the oper- ation can be developed. The terms manufacturing progress function and experience curve also have been used to describe this relationship, although the experience curve typically refers to total value-added costs per unit rather than labor hours. The principles underlying these curves are identical to those of the learning curve, however. Here we use the term learning curve to depict reductions in either total direct labor per unit or total value-added costs per unit. Background The learning curve was first developed in the aircraft industry prior to World War II, when analysts discovered that the direct labor input per airplane declined with considerable regularity as the cumulative number of planes produced increased. A survey of major air- plane manufacturers revealed that a series of learning curves could be developed to repre- sent the average experience for various categories of airframes (fighters, bombers, and so on), despite the different amounts of time required to produce the first unit of each type of airframe. Once production started, the direct labor for the eighth unit was only 80 percent of that for the fourth unit, the direct labor for the twelfth was only 80 percent of that for the sixth, and so on. In each case, each doubling of the quantity reduced production time by 20 percent. Because of the consistency in the rate of improvement, the analysts con- cluded that the aircraft industry‘s rate of learning was 80 percent between doubled quan- tities of airframes. Of course, for any given product and company, the rate of learning may be different. Learning Curves and Competitive Strategy Learning curves enable managers to project the manufacturing cost per unit for any cumu- lative production quantity. Firms that choose to emphasize low price as a competitive strat- egy rely on high volumes to maintain profit margins. These firms strive to move down the learning curve (lower labor hours per unit or lower costs per unit) by increasing volume. This tactic makes entry into a market by competitors difficult. For example, in the electronics component industry, the cost of developing an integrated circuit is so large that the first units produced must be priced high. As cumulative production increases, costs (and prices) fall. The first companies in the market have a big advantage because newcomers must start selling at lower prices and suffer large initial losses. organizational learning The process of gaining experience with products and processes, achieving greater efficiency through automation and other capital investments, and making other improvements in administrative methods or personnel. learning curve A line that displays the relationship between the total direct labor per unit and the cumulative quantity of a product or service produced.
  • 3. LEARNING CURVE ANALYSIS SUPPLEMENT I I-3 However, market or product changes can disrupt the expected benefits of increased production. For example, Douglas Aircraft management assumed that it could reduce the costs of its new jet aircraft by following a learning curve formula and committing to fixed delivery dates and prices. Continued engineering modification of its planes disrupted the learning curve, and the cost reductions were not realized. The resulting financial problems were so severe that Douglas Aircraft was forced to merge with McDonnell Company. Developing Learning Curves In the following discussion and applications, we focus on direct labor hours per unit, although we could as easily have used costs.When we develop a learning curve, we make the following assumptions: ½ The direct labor required to produce the 1st unit will always be less than the direct labor required for the nth unit. ½ Direct labor requirements will decrease at a declining rate as cumulative production increases. ½ The reduction in time will follow an exponential curve. In other words, the production time per unit is reduced by a fixed percentage each time production is doubled. We can use a logarithmic model to draw a learning curve. The direct labor required for the nth unit, , is kn = k1nb kn n + TABLE I.1 CONVERSION FACTORS FOR THE CUMULATIVE AVERAGE NUMBER OF DIRECT LABOR HOURS PER UNIT 80% Learning Rate (n = cumulative production) 90% Learning Rate (n = cumulative production) n n n n n n 1 1.00000 19 0.53178 37 0.43976 1 1.00000 19 0.73545 37 0.67091 2 0.90000 20 0.52425 38 0.43634 2 0.95000 20 0.73039 38 0.66839 3 0.83403 21 0.51715 39 0.43304 3 0.91540 21 0.72559 39 0.66595 4 0.78553 22 0.51045 40 0.42984 4 0.88905 22 0.72102 40 0.66357 5 0.74755 23 0.50410 64 0.37382 5 0.86784 23 0.71666 64 0.62043 6 0.71657 24 0.49808 128 0.30269 6 0.85013 24 0.71251 128 0.56069 7 0.69056 25 0.49234 256 0.24405 7 0.83496 25 0.70853 256 0.50586 8 0.66824 26 0.48688 512 0.19622 8 0.82172 26 0.70472 512 0.45594 9 0.64876 27 0.48167 600 0.18661 9 0.80998 27 0.70106 600 0.44519 10 0.63154 28 0.47668 700 0.17771 10 0.79945 28 0.69754 700 0.43496 11 0.61613 29 0.47191 800 0.17034 11 0.78991 29 0.69416 800 0.42629 12 0.60224 30 0.46733 900 0.16408 12 0.78120 30 0.69090 900 0.41878 13 0.58960 31 0.46293 1,000 0.15867 13 0.77320 31 0.68775 1,000 0.41217 14 0.57802 32 0.45871 1,200 0.14972 14 0.76580 32 0.68471 1,200 0.40097 15 0.56737 33 0.45464 1,400 0.14254 15 0.75891 33 0.68177 1,400 0.39173 16 0.55751 34 0.45072 1,600 0.13660 16 0.75249 34 0.67893 1,600 0.38390 17 0.54834 35 0.44694 1,800 0.13155 17 0.74646 35 0.67617 1,800 0.37711 18 0.53979 36 0.44329 2,000 0.12720 18 0.74080 36 0.67350 2,000 0.37114
  • 4. I-4 SUPPLEMENT I LEARNING CURVE ANALYSIS where We can also calculate the cumulative average number of hours per unit for the first n units with the help of Table I.1 on page I.3. It contains conversion factors that, when multiplied by the direct labor hours for the first unit, yield the average time per unit for selected cumula- tive production quantities. r = learning rate (as decimal) b = log r log 2 n = cumulative numbers of units produced k1 = direct labor hours for the first unit 40 80 120 160 200 240 280 0 10 20 30 40 50 Cumulative units produced Directlaborhoursperlocomotive (thousands) FIGURE I.2 ̈ The 80 Percent Learning Curve Using Learning Curves to Estimate Direct Labor RequirementsEXAMPLE I.1 A manufacturer of diesel locomotives needs 50,000 hours to produce the first unit. Based on past experience with similar products, you know that the rate of learning is 80 percent. a. Use the logarithmic model to estimate the direct labor required for the 40th diesel locomotive and the cumu- lative average number of labor hours per unit for the first 40 units. b. Draw a learning curve for this situation. SOLUTION a. The estimated number of direct labor hours required to produce the 40th unit is We calculate the cumulative average number of direct labor hours per unit for the first 40 units with the help of Table I.1. For a cumulative production of 40 units and an 80 percent learning rate, the factor is 0.42984. The cumulative average direct labor hours per unit is 50,000(0.42984) = 21,492 hours. b. Plot the first point at (1, 50,000). The second unit‘s labor time is 80 percent of the first, so multiply 50,000(0.80) = 40,000 hours. Plot the second point at (2, 40,000). The fourth is 80 percent of the second, so multiply 40,000(0.80) = 32,000 hours. Plot the point (4, 32,000). The result is shown in Figure I.2. = 15,248 hours k40 = 50,000(40)(log 0.8)/(log 2) = 50,000(40)-0.322 = 50,000(0.30488) Tutor I.1 in myomlab provides a new example for learning curve analysis. DECISION POINT Management can now use these estimates to determine the labor requirements to build the locomotives. Future hires may be necessary.
  • 5. LEARNING CURVE ANALYSIS SUPPLEMENT I I-5 Using Learning Curves Learning curves can be used in a variety of ways. Let us look briefly at their use in bid prepa- ration, financial planning, and labor requirement estimation. Bid Preparation Estimating labor costs is an important part of preparing bids for large jobs. Knowing the learning rate, the number of units to be produced, and wage rates, the estimator can arrive at the cost of labor by using a learning curve. After calculating expected labor and materials costs, the estimator adds the desired profit to obtain the total bid amount. Financial Planning Learning curves can be used in financial planning to help the financial planner determine the amount of cash needed to finance operations. Learning curves provide a basis for com- paring prices and costs. They can be used to project periods of financial drain, when expen- ditures exceed receipts. They can also be used to determine a contract price by identifying the average direct labor costs per unit for the number of contracted units. In the early stages of production the direct labor costs will exceed that average, whereas in the later stages of production the reverse will be true. This information enables the financial planner to arrange financing for certain phases of operations. Labor Requirement Estimation For a given production schedule, the analyst can use learning curves to project direct labor requirements. This information can be used to estimate training requirements and develop production and staffing plans. Using Learning Curves to Estimate Labor RequirementsEXAMPLE I.2 The manager of a custom manufacturer has just received a production schedule for an order for 30 large turbines. Over the next 5 months, the company is to produce 2, 3, 5, 8, and 12 turbines, respectively. The first unit took 30,000 direct labor hours, and experience on past projects indicates that a 90 percent learning curve is appro- priate; therefore, the second unit will require only 27,000 hours. Each employee works an average of 150 hours per month. Estimate the total number of full-time employees needed each month for the next 5 months. SOLUTION The following table shows the production schedule and cumulative number of units scheduled for production through each month: Month Units per Month Cumulative Units 1 2 2 2 3 5 3 5 10 4 8 18 5 12 30 We first need to find the cumulative average time per unit using Table I.1 and the cumulative total hours through each month. We then can determine the number of labor hours needed each month. The calculations for months 1–5 follow at the top of page I.6.
  • 6. I-6 SUPPLEMENT I LEARNING CURVE ANALYSIS Calculate the number of hours needed for a particular month by subtracting its cumulative total hours from that of the previous month. The required number of employees equals the number of hours needed each month divided by 150, the number of hours each employee can work. DECISION POINT The number of employees needed increases dramatically over the 5 months. Management may have to begin hiring now so that proper training can take place. Month 5: 221,778/150 = 1,479 employees Month 4: 160,197/150 = 1,068 employees Month 3: 109,659/150 = 731 employees Month 2: 73,176/150 = 488 employees Month 1: 57,000/150 = 380 employees Month 5: 621,810 - 400,032 = 221,778 hours Month 4: 400,032 - 239,835 = 160,197 hours Month 3: 239,835 - 130,176 = 109,659 hours Month 2: 130,176 - 57,000 = 73,176 hours Month 1: 57,000 - 0 = 57,000 hours Month Cumulative Average Time per Unit Cumulative Total Hours for All Units 1 30,000(0.95000) = 28,500.0 (2)28,500.0 = 57,000 2 30,000(0.86784) = 26,035.2 (5)26,035.2 = 130,176 3 30,000(0.79945) = 23,983.5 (10)23,983.5 = 239,835 4 30,000(0.74080) = 22,224.0 (18)22,224.0 = 400,032 5 30,000(0.69090) = 20,727.0 (30)20,727.0 = 621,810 Managerial Considerations in the use of Learning Curves Although learning curves can be useful tools for operations planning, managers should keep several things in mind when using them. First, an estimate of the learning rate is necessary in order to use learning curves, and it may be difficult to get. Using industry averages can be risky because the type of work and competitive niches can differ from firm to firm. The learning rate depends on factors such as process complexity and the rate of capital addi- tions. The simpler the process, the less pronounced the learning rate. A complex process offers more opportunity than does a simple process to improve work methods and material flows. Replacing direct labor hours with automation alters the learning rate, giving less opportunity to make reductions in the required hours per unit. Typically, the effect of each capital addition on the learning curve is significant. Another important estimate, if the first unit has yet to be produced, is that of the time required to produce it. The entire learning curve is based on it. The estimate may have to be developed by management using past experiences with similar products. Learning curves provide their greatest advantage in the early stages of new service or product production. As the cumulative number of units produced becomes large, the learn- ing effect is less noticeable. Learning curves are dynamic because they are affected by various factors. For example, a short service or product life cycle means that firms may not enjoy the flat portion of the learning curve for very long before the service or product is changed or a new one is intro- duced. In addition, organizations utilizing team approaches will have different learning rates than they had before they introduced teams. Total quality management and continual improvement programs also will affect learning curves. Finally, managers should always keep in mind that learning curves are only approxima- tions of actual experience.
  • 7. LEARNING CURVE ANALYSIS SUPPLEMENT I I-7 Key Equation Equation for the labor time for the nth unit: kn = k1nb Solved Problem The Minnesota Coach Company has just been given the following production schedule for ski-lift gondola cars. This product is considerably different from any others the company has produced. Historically, the company‘s learning rate has been 80 percent on large projects. The first unit took 1,000 hours to produce. Month Units Cumulative Units 1 3 3 2 7 10 3 10 20 4 12 32 5 4 36 6 2 38 a. Estimate how many hours would be required to complete the 38th unit. b. If the budget only provides for a maximum of 30 direct labor employees in any month and a total of 15,000 direct labor hours for the entire schedule, will the budget be adequate? Assume that each direct labor employee is productive for 150 work hours each month. SOLUTION a. We use the learning curve formulas to calculate the time required for the 38th unit: b. Table I.1 gives the data needed to calculate the cumulative number of hours through each month of the schedule. Table I.2 shows these calculations. The cumulative amount of time needed to produce the entire schedule of 38 units is 16,580.9 hours, which exceeds the 15,000 hours budgeted. By finding how much the cumulative total hours increased each month, we can break the total hours into monthly requirements. Finally, the number of employees required is simply the monthly hours divided by 150 hours per employee per month. The calculations are shown in Table I.3. = (1,000 hours)(0.3099) = 310 hours kn = k1nb = (1,000 hours)(38)-0.322 b = log r log 2 = log 0.8 log 2 = -0.09691 0.30103 = -0.322 TABLE I.2 CUMULATIVE TOTAL HOURS Month Cumulative Units Cumulative Average Time per Unit Cumulative Total Hours Month for All Units 1 3 1,000(0.83403) = 834.03 hr/u (834.03 hr/u)(3 u) = 2,502.1 hr 2 10 1,000(0.63154) = 631.54 hr/u (631.54 hr/u)(10 u) = 6,315.4 hr 3 20 1,000(0.52425) = 524.25 hr/u (524.25 hr/u)(20 u) = 10,485.0 hr 4 32 1,000(0.45871) = 458.71 hr/u (458.71 hr/u)(32 u) = 14,678.7 hr 5 36 1,000(0.44329) = 443.29 hr/u (443.29 hr/u)(36 u) = 15,958.4 hr 6 38 1,000(0.43634) = 436.34 hr/u (436.34 hr/u)(38 u) = 16,580.9 hr
  • 8. I-8 SUPPLEMENT I LEARNING CURVE ANALYSIS The schedule is feasible in terms of the maximum direct labor required in any month because it never exceeds 28 employees. However, the total cumulative hours are 16,581, which exceeds the budgeted amount by 1,581 hours. Therefore, the budget will not be adequate. a. How many total hours are required to complete 64 chain saws? b. How many hours of work are required for the week ending on Friday the 13th? c. Will Freddie and Jason be able to keep their same- week service promise during their busiest week just before Halloween? 5. The Bovine Products Company recently introduced a new automatic milking system for cows. The company just completed an order for 16 units. The last unit required 15 hours of labor, and the learning rate is esti- mated to be 90 percent on such systems. Another cus- tomer has just placed an order for the same system. This Week Units 1 20 2 65 3 100 4 140 5 120 Week Units Cumulative Units October 2–6 8 8 October 9–13 19 27 October 16–20 10 37 October 23–27 27 64 Problems 1. Mass Balance Company is manufacturing a new digital scale for use by a large chemical company. The order is for 40 units. The first scale took 60 hours of direct labor. The second unit took 48 hours to complete. a. What is the learning rate? b. What is the estimated time for the 40th unit? c. What is the estimated total time for producing all 40 units? d. What is the average time per unit for producing the last 10 units (#31–#40)? 2. Cambridge Instruments is an aircraft instrumentation manufacturer. It has received a contract from the U.S. Department of Defense to produce 30 radar units for a military fighter plane. The first unit took 85 hours to pro- duce. Based on past experience with manufacturing simi- lar units, Cambridge estimates that the learning rate is 93 percent. How long will it take to produce the 5th unit? The 10th? The 15th? The final unit? 3. A large grocery corporation has developed the following schedule for converting frozen food display cases to use CFC-free refrigerant: week. If the first unit took 30 hours to convert, is this schedule feasible? If not, how can it be altered? Are addi- tional costs involved in altering it? 4. Freddie and Jason have just opened the Texas Toothpick, a chain-saw sharpening and repair service located on Elm Street. The Texas Toothpick promises same-week repair service. Freddie and Jason are concerned that a projected dramatic increase in demand as the end of October nears will cause service to deteriorate. Freddie and Jason have had difficulty attracting employees, so they are the only workers available to complete the work. Safety considerations require that they each work no more than 40 hours per week. The first chain-saw sharp- ening and repair required 7 hours of work, and an 80 per- cent learning curve is anticipated. Historically, the learning rate has been 90 percent on such projects. The budget allows for a maximum of 40 direct labor employees per week and a total of 8,000 direct labor hours for the entire schedule. Assume 40 work hours per TABLE I.3 DIRECT LABOR EMPLOYEES Month Cumulative Total Hours for Month Direct Labor Workers by Month 1 2,502.1 – 0 = 2,502.1 hr (2,502.1 hr)/(150 hr) = 16.7, or 17 2 6,315.4 – 2,502.1 = 3,813.3 hr (3,813.3 hr)/(150 hr) = 25.4, or 26 3 10,485.0 – 6,315.4 = 4,169.6 hr (4,169.6 hr)/(150 hr) = 27.8, or 28 4 14,678.7 – 10,485.0 = 4,193.7 hr (4,193.7 hr)/(150 hr) = 27.9, or 28 5 15,958.4 – 14,678.7 = 1,279.7 hr (1,279.7 hr)/(150 hr) = 8.5, or 9 6 16,580.9 – 15,958.4 = 622.5 hr (622.5 hr)/(150 hr) = 4.2, or 5
  • 9. LEARNING CURVE ANALYSIS SUPPLEMENT I I-9 customer, which owns many farms in the Midwest, wants 48 units. How many total labor hours will be needed to satisfy this order? 6. You are in charge of a large assembly shop that special- izes in contract assignments. One of your customers has promised to award you a large contract for the assembly of 1,000 units of a new product. The suggested bid price in the contract is based on an average of 20 hours of direct labor per unit. You conduct a couple of test assem- blies and find that, although the first unit took 50 hours, the second unit could be completed in just 40 hours. a. How many hours do you expect the assembly of the third unit to take? b. How many hours do you expect the assembly of the 100th unit to take? c. Is the contract‘s assumption about the average labor hours per unit valid or should the price be revised? 7. The personnel manager at Powerwest Inc. wants to esti- mate the direct and cumulative average direct labor hours for producing 30 locomotive train units during the next year. He estimates from past experience that the learning rate is 90 percent. The production department estimates that manufacturing the first unit will take 30,000 hours. Each employee averages 200 hours per month. The production rate forecast is as follows: 8. The Really Big Six Corporation will hire 1,000 new accoun- tants this year. Managers are considering whether to make or to buy office furniture for the new hires. Big can pur- chase office furniture for $2,000 per accountant, or it can make the desks itself. Equipment to assemble furniture can be scrounged from the company‘s carpentry shop. That old equipment has already been fully depreciated. Materials cost $500 per desk, and labor (and benefits) costs $30 per hour. Big hired a local shop to build a prototype desk. That desk required 100 hours of labor. If the learning curve is 90 percent, should Big make or buy the desks? 9. Although the learning curve never completely levels off to a horizontal line, if work standards are to be devel- oped, there must be a point at which, for all practical purposes, learning is said to have stopped. If we have an 80 percent learning curve and say that the learning effect will be masked by other variables when the improvement in successive units is less than 0.5 percent, at about what unit number can the standard be set? 10. The Compton Company is manufacturing a solar grain dryer that requires methods and materials never before used by the company. The order is for 80 units. The first unit took 46 direct labor hours, whereas the 10th unit took only 24 direct labor hours. a. Estimate the rate of learning that occurred for this product. b. Use the learning rate in part (a) to estimate direct labor hours for the 80th unit. 11. The Hand-To-Mouth Company (HTM) has $200,000 in cash, no inventory, and a 90 percent learning curve. To reduce the complexity of this problem, ignore the hiring and training costs associated with dramatically increased production. Employees are paid $20 per hour every Friday for that week‘s work. HTM has received an order to build 1,000 oak desks over the next 15 weeks. Materials cost $400 per desk. Suppliers make deliveries each Monday and insist on cash upon delivery. The first desk takes 100 hours of direct labor to build. HTM will be paid $1,500 per desk two weeks after the desks are delivered. Should HTM take this order? Month Production Rate (units) Month Production Rate (units) January 2 July 2 February 3 August 4 March 2 September 3 April 4 October 3 May 3 November 1 June 2 December 1 a. How many direct hours are required to produce the 30th unit? b. How many total hours are needed to produce all 30 units? c. What is the maximum number of employees required next year? d. If the learning rate were changed to 0.85, what would be the impact on the total hours and the number of employees needed to produce 30 units? Week Units Week Units Week Units 1 2 6 24 11 88 2 4 7 64 12 100 3 8 8 128 13 100 4 12 9 128 14 100 5 14 10 128 15 100 Total 1,000 Selected References Abernathy, William J., and Kenneth Wayne. “Limits of the Learning Curve.” Harvard Business Review (September– October 1974), pp. 109–119. Senge, Peter M. “The Leader‘s New Work: Building Learning Organizations.” The Sloan Management Review (Fall 1990), pp. 7–23. Yelle, Louis E. “The Learning Curve: Historical Review and Comprehensive Survey.” Decision Sciences, vol. 10, no. 2 (1979), pp. 302–328.