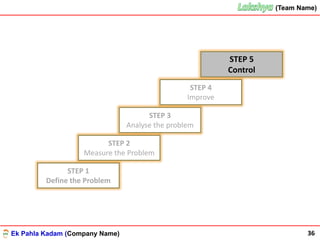
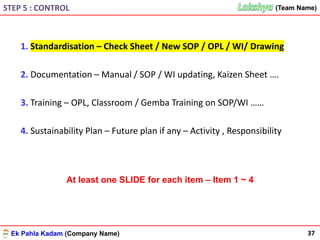
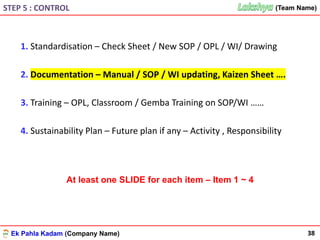
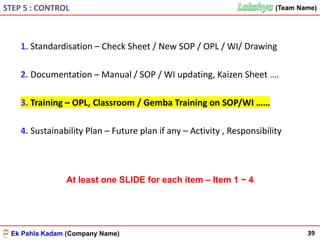
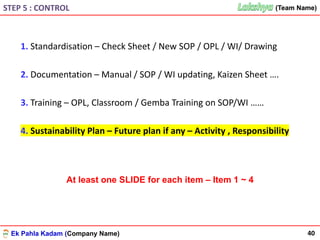
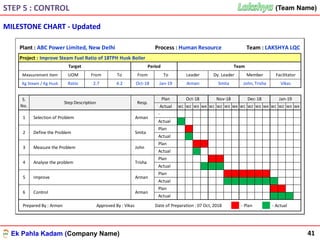
Ek Pahla Kadam (Company Name)
(Team Name)(Team Name)
1
Ek Pahla Kadam (Company Name)
(Team Name)(Team Name)COMPANY PROFILE
2
• Overview of Company / Institution
• Its Spread across Country / City
Ek Pahla Kadam (Company Name)
(Team Name)(Team Name)
3
COMPANY PROFILE
• Products / Clients Information
• Significant Achievements / Certifications
Ek Pahla Kadam (Company Name)
(Team Name)(Team Name)OUR PROCESS
4
• Details About your Process / Function / Department
• Your Functions Key Role & Objectives
Ek Pahla Kadam (Company Name)
(Team Name)(Team Name)
5
ABOUT THE TEAM
Team Details :
Komal Chautala
Member
Gunjan Lakhani
Member
Vidya Sharma
Leader
Nethra Reddy
Member
Shahrukh Khan
Facilitator
• No. of QC Projects Completed - 05
• No of LQC Projects Completed - 04
• No. of Kaizens Completed - 15
Ek Pahla Kadam (Company Name)
(Team Name)(Team Name)TEAM ACHIEVEMENTS
6
Achievements of QC / LQC Teams
• Participations
• Awards
• With Picture
Ek Pahla Kadam (Company Name)
(Team Name)(Team Name)
7
Selection of Problem
Ek Pahla Kadam (Company Name)
(Team Name)(Team Name)SELECTION OF PROBLEM
8
Sr. No. Problem Statement
1
2
3
4
5
6
7
8
9
10
11
12
13
14
15
16
17
18
19
20
SHOW ONLY IF PROBLEM IS SELECTED
FROM PROBLEM BANK
Ek Pahla Kadam (Company Name)
(Team Name)(Team Name)SELECTION OF PROBLEM
9
JUSTIFY YOUR SELECTION
Selected from Problem Bank
Rating & Ranking Method
Or
Assigned by Management
Linkage with KPIs , Company Goals
David Ram Lal Raheem Karthik Sukh
L DL M M M
1 Student desk are dirty A 3 2 3 2 10 5
2
School Bus seats are not
comfortable
C - 4 4 2 3 13 2
3
Finding a book in library is
difficult
B - 5 3 4 3 15 1
4
9th C class student makes
more noise
A - 3 4 2 2 11 4
5
Washroom taps are not
closed often after use
A - 2 1 23 1 7 6
6
Classroom s are hot in and
uncomfortable in Summer
C - 3 2 3 4 12 3
ProblemS. No. RankTotal
Rating on scale of 1 to 5, where 5 is most important and 1 is least important
Category
SAMPLE
Ek Pahla Kadam (Company Name)
(Team Name)(Team Name)
MILESTONE CHART
SELECTION OF PROBLEM
10
Plant : ABC Power Limited, New Delhi Process : Human Resource Team : LAKSHYA LQC
W1 W2 W3 W4 W1 W2 W3 W4 W1 W2 W3 W4 W1 W2 W3 W4
Prepared By : Arman Approved By : Vikas Date of Preparation : 07 Oct, 2018 - Plan - Actual
Project : Improve Steam Fuel Ratio of 18TPH Husk Boiler
Target Period Team
Measurement Item UOM From To From To Leader Dy. Leader Member Facilitator
Kg Steam / Kg Husk Ratio 2.7 4.2 Oct-18 Jan-19 Arman Smita John, Trisha Vikas
S.
No.
Step Description Resp.
Plan Oct-18 Nov-18 Dec-18 Jan-19
Actual
1 Selection of Problem Arman
-
Actual
3 Measure the Problem John
Plan
Actual
2 Define the Problem Smita
Plan
Actual
5 Improve Arman
Plan
Actual
4 Analyse the problem Trisha
Plan
Actual
6 Control Arman
Plan
Actual
Ek Pahla Kadam (Company Name)
(Team Name)(Team Name)
11
STEP 1
Define the Problem
STEP 2
Measure the Problem
STEP 3
Analyse the problem
STEP 4
Improve
STEP 5
Control
Ek Pahla Kadam (Company Name)
(Team Name)(Team Name)
BACKGROUND
12
Define Process with Pictorial or High Level or Detailed Flow Diagram
And
Highlight Problem Area
Problem Area
Customer was not
Happy with the
Designs
SAMPLE
STEP 1 : Define the Problem
Mainly applicable in Problem Solving Theme
Ek Pahla Kadam (Company Name)
(Team Name)(Team Name)
BACKGROUND
STEP 1 : Define the Problem
13
• State Background
• Impact of Problems
Ek Pahla Kadam (Company Name)
(Team Name)(Team Name)
CURRENT SITUATION
14
STEP 1 : Define the Problem
• Describe Present Situation
• Losses / Adverse Effects
• Challenges
Ek Pahla Kadam (Company Name)
(Team Name)(Team Name)
15
STEP 1 : Define the Problem
THEME, GOAL & OBJECTIVES
Improve Steam Fuel Ratio of 18TPH Husk Boiler from 3.7 to 4.2 by Jan-19.
Note : Show Before after data for all the Graphs in Step - 4, where ever applicable
You may also share about Secondary Goals or Objective
Tangible & Intangible Benefits expected or targeted
Show Data / Graph for other Objectives
3.7
4.2
0
1
2
3
4
5
From To
Ratio
Steam Fuel Ratio
Ek Pahla Kadam (Company Name)
(Team Name)(Team Name)
STEP 1
Define the Problem
STEP 2
Measure the Problem
STEP 3
Analyse the problem
STEP 4
Improve
STEP 5
Control
16
Ek Pahla Kadam (Company Name)
(Team Name)(Team Name)STEP 2 : MEASURE THE PROBLEM
17
Sr. No. Impact ( What ) Where When Who
(Affected / Involved )
How Much
1
2
3
4
Note:
• Support the data with graphs, wherever possible.
• Some of the W & H may not be applicable for your case then do not show that
unnecessarily
• You may also share this information step by step in place of such table – be creative
IMPACT OF THE PROBLEM : 4W + 1 H
Ek Pahla Kadam (Company Name)
(Team Name)(Team Name)
18
Support the data with graphs, wherever possible.
IMPACT OF THE PROBLEM : 4W + 1 H
STEP 2 : MEASURE THE PROBLEM
Ek Pahla Kadam (Company Name)
(Team Name)(Team Name)
STEP 1
Define the Problem
STEP 2
Measure the Problem
STEP 3
Analyse the problem
STEP 4
Improve
STEP 5
Control
19
Ek Pahla Kadam (Company Name)
(Team Name)(Team Name)STEP 3 : ANALYZE THE PROBLEM
20
Sr.
No.4
Category Cause Sub-Cause Sub-Sub Cause Sub-Sub-Sub Cause
1
Man
2
3
4
5
6
Machine7
8
9
Method10
11
IDENTIFICATION OF THE ALL POSSIBLE CAUSES / Factors
• In case of Service Industry use People, Place, Policy & Procedure ipo Man, Machine, Method & Material
• It is not necessary to use all the categories, use which ever is applicable.
• You may also use different categories - Cause Enumeration Type C& E Diagram
Ek Pahla Kadam (Company Name)
(Team Name)(Team Name)
21
Sr. No. Category Cause Sub-Cause Sub-Sub Cause Sub-Sub-Sub Cause
12 Material
13
14
15
16 Measurement
17
18
19 Environment
20
21
• In case of Service Industry use People, Place, Policy & Procedure ipo Man, Machine, Method & Material
• It is not necessary to use all the categories, use which ever is applicable.
• You may also use different categories - Cause Enumeration Type C& E Diagram
STEP 3 : ANALYZE THE PROBLEM
IDENTIFICATION OF THE ALL POSSIBLE CAUSES / Factors
Ek Pahla Kadam (Company Name)
(Team Name)(Team Name)
CAUSE & EFFECT DIAGRAM
STEP 3 : ANALYZE THE PROBLEM
CAUSE & EFFECT DIAGRAM
Or
Why-Why Analysis
22
Ek Pahla Kadam (Company Name)
(Team Name)(Team Name)
23
STEP 3 : ANALYZE THE PROBLEM
Sr.
No.
Main Category Most Probable Cause Validation Method
Outcome
Valid/Invalid
1
2
3
4
5
6
7
8
9
FINDING ROOT CAUSES
Based on the above analysis, highlight the ROOT CAUSE (causes which were found VALID)
Applicable only in case of C & E Diagram
Not for Why-Why Analysis
Ek Pahla Kadam (Company Name)
(Team Name)(Team Name)
24
STEP 3 : ANALYZE THE PROBLEM
PRIORITISATION of ROOT CAUSES
1 Root Cause 1 300 300 30% 30%
2 Root Cause 2 260 560 26% 56%
3 Root Cause 3 175 735 18% 74%
4 Root Cause 4 100 835 10% 84%
5 Root Cause 5 45 880 5% 88%
6 Root Cause 6 35 915 4% 92%
7 Root Cause 7 30 945 3% 95%
8 Root Cause 8 25 970 3% 97%
9 Root Cause 9 20 990 2% 99%
15 Others 10 1000 1% 100%
1000 100%TOTAL
Cause Wise Pareto
S. No. Root Cause (Validated Cause) Count % Contribution
Cumulative
Contribution
Cummulative
Count
Note :
Use Pareto wherever it is applicable.
In many improvement Projects or Execution Task it may not be applicable.
Ek Pahla Kadam (Company Name)
(Team Name)(Team Name)
25
STEP 3 : ANALYZE THE PROBLEM
300
260
175
100
45 35 30 25 20 10
30%
56%
74%
84%
88%
92%
95%
97% 99% 100%
0%
20%
40%
60%
80%
100%
0
200
400
600
800
1000
%Contribution
No.ofCount
Root Causes
Cause Wise Pareto
Period Jan-18 to Mar-18
Prioritise and select root causes to take action
based on data and their impact Vital Few Root Causes
SAMPLE
Vital Few
PRIORITISATION of ROOT CAUSES
Ek Pahla Kadam (Company Name)
(Team Name)(Team Name)
STEP 1
Define the Problem
STEP 2
Measure the Problem
STEP 3
Analyse the problem
STEP 4
Improve
STEP 5
Control
26
Ek Pahla Kadam (Company Name)
(Team Name)(Team Name)STEP 4 : IMPROVE
27
Sr.
No.
Prioritized Root Cause Solution
Accepted / Not
Accepted
Reason
1 Prioritised Root Cause 1
2
Prioritised Root Cause 2
DEVELOPING SOLUTION
➢ Propose more than one solution for each Prioritised Root Cause
➢ Select solution based on merits, i.e. Cost, Ease in implementation, Time Required etc.
➢ You may select or have more than one solution for a Root Cause
Ek Pahla Kadam (Company Name)
(Team Name)(Team Name)
28
Sr.
No.
Prioritized Root Cause Solution
Accepted / Not
Accepted
Reason
3 Prioritised Root Cause 3
4
Prioritised Root Cause 4
DEVELOPING SOLUTION
➢ Propose more than one solution for each Prioritised Root Cause
➢ Select solution based on merits, i.e. Cost, Ease in implementation, Time Required etc.
➢ You may select or have more than one solution for a Root Cause
STEP 4 : IMPROVE
Ek Pahla Kadam (Company Name)
(Team Name)(Team Name)
29
Sr. No. Solution Probable Resistance Measure
1 Solution – 1
2 Solution - 2
3 Solution - 3
4 Solution - 4
5 Solution - 5
FORESEEING PROBABLE RESISTANCE
STEP 4 : IMPROVE
Optional
Use only when required.
Ek Pahla Kadam (Company Name)
(Team Name)(Team Name)
30
STEP 4 : IMPROVE
Root Cause : ……………… ……………… ……………… ……………… ……………… ……………… ……….
Before After
(Image (Image)
Text Text
Brief description about solution implementation / changes made / outcome ……..
Solution : ……………… ……………… ……………… ……………… ……………… ……………… ……….
Ek Pahla Kadam (Company Name)
(Team Name)(Team Name)
31
STEP 4 : IMPROVE
Root Cause : ……………… ……………… ……………… ……………… ……………… ……………… ……….
Before After
(Image (Image)
Text Text
Brief description about solution implementation / changes made / outcome ……..
Solution : ……………… ……………… ……………… ……………… ……………… ……………… ……….
Ek Pahla Kadam (Company Name)
(Team Name)(Team Name)
32
STEP 4 : IMPROVE
Root Cause : ……………… ……………… ……………… ……………… ……………… ……………… ……….
Before After
(Image (Image)
Text Text
Brief description about solution implementation / changes made / outcome ……..
Solution : ……………… ……………… ……………… ……………… ……………… ……………… ……….
Ek Pahla Kadam (Company Name)
(Team Name)(Team Name)
33
STEP 4 : IMPROVE
Root Cause : ……………… ……………… ……………… ……………… ……………… ……………… ……….
Before After
(Image (Image)
Text Text
Brief description about solution implementation / changes made / outcome ……..
Solution : ……………… ……………… ……………… ……………… ……………… ……………… ……….
Ek Pahla Kadam (Company Name)
(Team Name)(Team Name)STEP 4 : IMPROVE
34
RESULTS
Performance Trend
Bar Chart / Graphs etc.
Ek Pahla Kadam (Company Name)
(Team Name)(Team Name)STEP 4 : IMPROVE
35
TANGIBLE BENEFITS
Other Benefits …….
INTANGIBLE BENEFITS
Cost Saving …….
Ek Pahla Kadam (Company Name)
(Team Name)(Team Name)
STEP 1
Define the Problem
STEP 2
Measure the Problem
STEP 3
Analyse the problem
STEP 4
Improve
STEP 5
Control
36
Ek Pahla Kadam (Company Name)
(Team Name)(Team Name)
37
STEP 5 : CONTROL
1. Standardisation – Check Sheet / New SOP / OPL / WI/ Drawing
2. Documentation – Manual / SOP / WI updating, Kaizen Sheet ….
3. Training – OPL, Classroom / Gemba Training on SOP/WI ……
4. Sustainability Plan – Future plan if any – Activity , Responsibility
At least one SLIDE for each item – Item 1 ~ 4
Ek Pahla Kadam (Company Name)
(Team Name)(Team Name)
38
STEP 5 : CONTROL
1. Standardisation – Check Sheet / New SOP / OPL / WI/ Drawing
2. Documentation – Manual / SOP / WI updating, Kaizen Sheet ….
3. Training – OPL, Classroom / Gemba Training on SOP/WI ……
4. Sustainability Plan – Future plan if any – Activity , Responsibility
At least one SLIDE for each item – Item 1 ~ 4
Ek Pahla Kadam (Company Name)
(Team Name)(Team Name)
39
STEP 5 : CONTROL
1. Standardisation – Check Sheet / New SOP / OPL / WI/ Drawing
2. Documentation – Manual / SOP / WI updating, Kaizen Sheet ….
3. Training – OPL, Classroom / Gemba Training on SOP/WI ……
4. Sustainability Plan – Future plan if any – Activity , Responsibility
At least one SLIDE for each item – Item 1 ~ 4
Ek Pahla Kadam (Company Name)
(Team Name)(Team Name)
40
STEP 5 : CONTROL
1. Standardisation – Check Sheet / New SOP / OPL / WI/ Drawing
2. Documentation – Manual / SOP / WI updating, Kaizen Sheet ….
3. Training – OPL, Classroom / Gemba Training on SOP/WI ……
4. Sustainability Plan – Future plan if any – Activity , Responsibility
At least one SLIDE for each item – Item 1 ~ 4
Ek Pahla Kadam (Company Name)
(Team Name)(Team Name)
MILESTONE CHART - Updated
STEP 5 : CONTROL
41
Plant : ABC Power Limited, New Delhi Process : Human Resource Team : LAKSHYA LQC
W1 W2 W3 W4 W1 W2 W3 W4 W1 W2 W3 W4 W1 W2 W3 W4
Prepared By : Arman Approved By : Vikas Date of Preparation : 07 Oct, 2018 - Plan - Actual
6 Control Arman
Plan
Actual
4 Analyse the problem Trisha
Plan
Actual
5 Improve Arman
Plan
Actual
2 Define the Problem Smita
Plan
Actual
3 Measure the Problem John
Plan
Actual
Dec-18 Jan-19
Actual
1 Selection of Problem Arman
-
Actual
Arman Smita John, Trisha Vikas
S.
No.
Step Description Resp.
Plan Oct-18 Nov-18
Leader Dy. Leader Member Facilitator
Kg Steam / Kg Husk Ratio 2.7 4.2 Oct-18 Jan-19
Project : Improve Steam Fuel Ratio of 18TPH Husk Boiler
Target Period Team
Measurement Item UOM From To From To
Ek Pahla Kadam (Company Name)
(Team Name)(Team Name)
42
for
patient listening.
Ek Pahla Kadam (Company Name)
(Team Name)
Thank You
Contact : Dinesh Sharma
Cell No. : +91 9589004005, 9589892468
e-mail : dinesh@ekpahlakadam.com
Connect : https://www.facebook.com/ekpahlakadam
Website : ekpahlakadam.com
Your Queries
&
Feedback Please
43
Ek Pahla Kadam, Take it .. Keep moving ..

Lean Quality Circle Presentation Template

  • 1.
    Ek Pahla Kadam(Company Name) (Team Name)(Team Name) 1
  • 2.
    Ek Pahla Kadam(Company Name) (Team Name)(Team Name)COMPANY PROFILE 2 • Overview of Company / Institution • Its Spread across Country / City
  • 3.
    Ek Pahla Kadam(Company Name) (Team Name)(Team Name) 3 COMPANY PROFILE • Products / Clients Information • Significant Achievements / Certifications
  • 4.
    Ek Pahla Kadam(Company Name) (Team Name)(Team Name)OUR PROCESS 4 • Details About your Process / Function / Department • Your Functions Key Role & Objectives
  • 5.
    Ek Pahla Kadam(Company Name) (Team Name)(Team Name) 5 ABOUT THE TEAM Team Details : Komal Chautala Member Gunjan Lakhani Member Vidya Sharma Leader Nethra Reddy Member Shahrukh Khan Facilitator • No. of QC Projects Completed - 05 • No of LQC Projects Completed - 04 • No. of Kaizens Completed - 15
  • 6.
    Ek Pahla Kadam(Company Name) (Team Name)(Team Name)TEAM ACHIEVEMENTS 6 Achievements of QC / LQC Teams • Participations • Awards • With Picture
  • 7.
    Ek Pahla Kadam(Company Name) (Team Name)(Team Name) 7 Selection of Problem
  • 8.
    Ek Pahla Kadam(Company Name) (Team Name)(Team Name)SELECTION OF PROBLEM 8 Sr. No. Problem Statement 1 2 3 4 5 6 7 8 9 10 11 12 13 14 15 16 17 18 19 20 SHOW ONLY IF PROBLEM IS SELECTED FROM PROBLEM BANK
  • 9.
    Ek Pahla Kadam(Company Name) (Team Name)(Team Name)SELECTION OF PROBLEM 9 JUSTIFY YOUR SELECTION Selected from Problem Bank Rating & Ranking Method Or Assigned by Management Linkage with KPIs , Company Goals David Ram Lal Raheem Karthik Sukh L DL M M M 1 Student desk are dirty A 3 2 3 2 10 5 2 School Bus seats are not comfortable C - 4 4 2 3 13 2 3 Finding a book in library is difficult B - 5 3 4 3 15 1 4 9th C class student makes more noise A - 3 4 2 2 11 4 5 Washroom taps are not closed often after use A - 2 1 23 1 7 6 6 Classroom s are hot in and uncomfortable in Summer C - 3 2 3 4 12 3 ProblemS. No. RankTotal Rating on scale of 1 to 5, where 5 is most important and 1 is least important Category SAMPLE
  • 10.
    Ek Pahla Kadam(Company Name) (Team Name)(Team Name) MILESTONE CHART SELECTION OF PROBLEM 10 Plant : ABC Power Limited, New Delhi Process : Human Resource Team : LAKSHYA LQC W1 W2 W3 W4 W1 W2 W3 W4 W1 W2 W3 W4 W1 W2 W3 W4 Prepared By : Arman Approved By : Vikas Date of Preparation : 07 Oct, 2018 - Plan - Actual Project : Improve Steam Fuel Ratio of 18TPH Husk Boiler Target Period Team Measurement Item UOM From To From To Leader Dy. Leader Member Facilitator Kg Steam / Kg Husk Ratio 2.7 4.2 Oct-18 Jan-19 Arman Smita John, Trisha Vikas S. No. Step Description Resp. Plan Oct-18 Nov-18 Dec-18 Jan-19 Actual 1 Selection of Problem Arman - Actual 3 Measure the Problem John Plan Actual 2 Define the Problem Smita Plan Actual 5 Improve Arman Plan Actual 4 Analyse the problem Trisha Plan Actual 6 Control Arman Plan Actual
  • 11.
    Ek Pahla Kadam(Company Name) (Team Name)(Team Name) 11 STEP 1 Define the Problem STEP 2 Measure the Problem STEP 3 Analyse the problem STEP 4 Improve STEP 5 Control
  • 12.
    Ek Pahla Kadam(Company Name) (Team Name)(Team Name) BACKGROUND 12 Define Process with Pictorial or High Level or Detailed Flow Diagram And Highlight Problem Area Problem Area Customer was not Happy with the Designs SAMPLE STEP 1 : Define the Problem Mainly applicable in Problem Solving Theme
  • 13.
    Ek Pahla Kadam(Company Name) (Team Name)(Team Name) BACKGROUND STEP 1 : Define the Problem 13 • State Background • Impact of Problems
  • 14.
    Ek Pahla Kadam(Company Name) (Team Name)(Team Name) CURRENT SITUATION 14 STEP 1 : Define the Problem • Describe Present Situation • Losses / Adverse Effects • Challenges
  • 15.
    Ek Pahla Kadam(Company Name) (Team Name)(Team Name) 15 STEP 1 : Define the Problem THEME, GOAL & OBJECTIVES Improve Steam Fuel Ratio of 18TPH Husk Boiler from 3.7 to 4.2 by Jan-19. Note : Show Before after data for all the Graphs in Step - 4, where ever applicable You may also share about Secondary Goals or Objective Tangible & Intangible Benefits expected or targeted Show Data / Graph for other Objectives 3.7 4.2 0 1 2 3 4 5 From To Ratio Steam Fuel Ratio
  • 16.
    Ek Pahla Kadam(Company Name) (Team Name)(Team Name) STEP 1 Define the Problem STEP 2 Measure the Problem STEP 3 Analyse the problem STEP 4 Improve STEP 5 Control 16
  • 17.
    Ek Pahla Kadam(Company Name) (Team Name)(Team Name)STEP 2 : MEASURE THE PROBLEM 17 Sr. No. Impact ( What ) Where When Who (Affected / Involved ) How Much 1 2 3 4 Note: • Support the data with graphs, wherever possible. • Some of the W & H may not be applicable for your case then do not show that unnecessarily • You may also share this information step by step in place of such table – be creative IMPACT OF THE PROBLEM : 4W + 1 H
  • 18.
    Ek Pahla Kadam(Company Name) (Team Name)(Team Name) 18 Support the data with graphs, wherever possible. IMPACT OF THE PROBLEM : 4W + 1 H STEP 2 : MEASURE THE PROBLEM
  • 19.
    Ek Pahla Kadam(Company Name) (Team Name)(Team Name) STEP 1 Define the Problem STEP 2 Measure the Problem STEP 3 Analyse the problem STEP 4 Improve STEP 5 Control 19
  • 20.
    Ek Pahla Kadam(Company Name) (Team Name)(Team Name)STEP 3 : ANALYZE THE PROBLEM 20 Sr. No.4 Category Cause Sub-Cause Sub-Sub Cause Sub-Sub-Sub Cause 1 Man 2 3 4 5 6 Machine7 8 9 Method10 11 IDENTIFICATION OF THE ALL POSSIBLE CAUSES / Factors • In case of Service Industry use People, Place, Policy & Procedure ipo Man, Machine, Method & Material • It is not necessary to use all the categories, use which ever is applicable. • You may also use different categories - Cause Enumeration Type C& E Diagram
  • 21.
    Ek Pahla Kadam(Company Name) (Team Name)(Team Name) 21 Sr. No. Category Cause Sub-Cause Sub-Sub Cause Sub-Sub-Sub Cause 12 Material 13 14 15 16 Measurement 17 18 19 Environment 20 21 • In case of Service Industry use People, Place, Policy & Procedure ipo Man, Machine, Method & Material • It is not necessary to use all the categories, use which ever is applicable. • You may also use different categories - Cause Enumeration Type C& E Diagram STEP 3 : ANALYZE THE PROBLEM IDENTIFICATION OF THE ALL POSSIBLE CAUSES / Factors
  • 22.
    Ek Pahla Kadam(Company Name) (Team Name)(Team Name) CAUSE & EFFECT DIAGRAM STEP 3 : ANALYZE THE PROBLEM CAUSE & EFFECT DIAGRAM Or Why-Why Analysis 22
  • 23.
    Ek Pahla Kadam(Company Name) (Team Name)(Team Name) 23 STEP 3 : ANALYZE THE PROBLEM Sr. No. Main Category Most Probable Cause Validation Method Outcome Valid/Invalid 1 2 3 4 5 6 7 8 9 FINDING ROOT CAUSES Based on the above analysis, highlight the ROOT CAUSE (causes which were found VALID) Applicable only in case of C & E Diagram Not for Why-Why Analysis
  • 24.
    Ek Pahla Kadam(Company Name) (Team Name)(Team Name) 24 STEP 3 : ANALYZE THE PROBLEM PRIORITISATION of ROOT CAUSES 1 Root Cause 1 300 300 30% 30% 2 Root Cause 2 260 560 26% 56% 3 Root Cause 3 175 735 18% 74% 4 Root Cause 4 100 835 10% 84% 5 Root Cause 5 45 880 5% 88% 6 Root Cause 6 35 915 4% 92% 7 Root Cause 7 30 945 3% 95% 8 Root Cause 8 25 970 3% 97% 9 Root Cause 9 20 990 2% 99% 15 Others 10 1000 1% 100% 1000 100%TOTAL Cause Wise Pareto S. No. Root Cause (Validated Cause) Count % Contribution Cumulative Contribution Cummulative Count Note : Use Pareto wherever it is applicable. In many improvement Projects or Execution Task it may not be applicable.
  • 25.
    Ek Pahla Kadam(Company Name) (Team Name)(Team Name) 25 STEP 3 : ANALYZE THE PROBLEM 300 260 175 100 45 35 30 25 20 10 30% 56% 74% 84% 88% 92% 95% 97% 99% 100% 0% 20% 40% 60% 80% 100% 0 200 400 600 800 1000 %Contribution No.ofCount Root Causes Cause Wise Pareto Period Jan-18 to Mar-18 Prioritise and select root causes to take action based on data and their impact Vital Few Root Causes SAMPLE Vital Few PRIORITISATION of ROOT CAUSES
  • 26.
    Ek Pahla Kadam(Company Name) (Team Name)(Team Name) STEP 1 Define the Problem STEP 2 Measure the Problem STEP 3 Analyse the problem STEP 4 Improve STEP 5 Control 26
  • 27.
    Ek Pahla Kadam(Company Name) (Team Name)(Team Name)STEP 4 : IMPROVE 27 Sr. No. Prioritized Root Cause Solution Accepted / Not Accepted Reason 1 Prioritised Root Cause 1 2 Prioritised Root Cause 2 DEVELOPING SOLUTION ➢ Propose more than one solution for each Prioritised Root Cause ➢ Select solution based on merits, i.e. Cost, Ease in implementation, Time Required etc. ➢ You may select or have more than one solution for a Root Cause
  • 28.
    Ek Pahla Kadam(Company Name) (Team Name)(Team Name) 28 Sr. No. Prioritized Root Cause Solution Accepted / Not Accepted Reason 3 Prioritised Root Cause 3 4 Prioritised Root Cause 4 DEVELOPING SOLUTION ➢ Propose more than one solution for each Prioritised Root Cause ➢ Select solution based on merits, i.e. Cost, Ease in implementation, Time Required etc. ➢ You may select or have more than one solution for a Root Cause STEP 4 : IMPROVE
  • 29.
    Ek Pahla Kadam(Company Name) (Team Name)(Team Name) 29 Sr. No. Solution Probable Resistance Measure 1 Solution – 1 2 Solution - 2 3 Solution - 3 4 Solution - 4 5 Solution - 5 FORESEEING PROBABLE RESISTANCE STEP 4 : IMPROVE Optional Use only when required.
  • 30.
    Ek Pahla Kadam(Company Name) (Team Name)(Team Name) 30 STEP 4 : IMPROVE Root Cause : ……………… ……………… ……………… ……………… ……………… ……………… ………. Before After (Image (Image) Text Text Brief description about solution implementation / changes made / outcome …….. Solution : ……………… ……………… ……………… ……………… ……………… ……………… ……….
  • 31.
    Ek Pahla Kadam(Company Name) (Team Name)(Team Name) 31 STEP 4 : IMPROVE Root Cause : ……………… ……………… ……………… ……………… ……………… ……………… ………. Before After (Image (Image) Text Text Brief description about solution implementation / changes made / outcome …….. Solution : ……………… ……………… ……………… ……………… ……………… ……………… ……….
  • 32.
    Ek Pahla Kadam(Company Name) (Team Name)(Team Name) 32 STEP 4 : IMPROVE Root Cause : ……………… ……………… ……………… ……………… ……………… ……………… ………. Before After (Image (Image) Text Text Brief description about solution implementation / changes made / outcome …….. Solution : ……………… ……………… ……………… ……………… ……………… ……………… ……….
  • 33.
    Ek Pahla Kadam(Company Name) (Team Name)(Team Name) 33 STEP 4 : IMPROVE Root Cause : ……………… ……………… ……………… ……………… ……………… ……………… ………. Before After (Image (Image) Text Text Brief description about solution implementation / changes made / outcome …….. Solution : ……………… ……………… ……………… ……………… ……………… ……………… ……….
  • 34.
    Ek Pahla Kadam(Company Name) (Team Name)(Team Name)STEP 4 : IMPROVE 34 RESULTS Performance Trend Bar Chart / Graphs etc.
  • 35.
    Ek Pahla Kadam(Company Name) (Team Name)(Team Name)STEP 4 : IMPROVE 35 TANGIBLE BENEFITS Other Benefits ……. INTANGIBLE BENEFITS Cost Saving …….
  • 36.
    Ek Pahla Kadam(Company Name) (Team Name)(Team Name) STEP 1 Define the Problem STEP 2 Measure the Problem STEP 3 Analyse the problem STEP 4 Improve STEP 5 Control 36
  • 37.
    Ek Pahla Kadam(Company Name) (Team Name)(Team Name) 37 STEP 5 : CONTROL 1. Standardisation – Check Sheet / New SOP / OPL / WI/ Drawing 2. Documentation – Manual / SOP / WI updating, Kaizen Sheet …. 3. Training – OPL, Classroom / Gemba Training on SOP/WI …… 4. Sustainability Plan – Future plan if any – Activity , Responsibility At least one SLIDE for each item – Item 1 ~ 4
  • 38.
    Ek Pahla Kadam(Company Name) (Team Name)(Team Name) 38 STEP 5 : CONTROL 1. Standardisation – Check Sheet / New SOP / OPL / WI/ Drawing 2. Documentation – Manual / SOP / WI updating, Kaizen Sheet …. 3. Training – OPL, Classroom / Gemba Training on SOP/WI …… 4. Sustainability Plan – Future plan if any – Activity , Responsibility At least one SLIDE for each item – Item 1 ~ 4
  • 39.
    Ek Pahla Kadam(Company Name) (Team Name)(Team Name) 39 STEP 5 : CONTROL 1. Standardisation – Check Sheet / New SOP / OPL / WI/ Drawing 2. Documentation – Manual / SOP / WI updating, Kaizen Sheet …. 3. Training – OPL, Classroom / Gemba Training on SOP/WI …… 4. Sustainability Plan – Future plan if any – Activity , Responsibility At least one SLIDE for each item – Item 1 ~ 4
  • 40.
    Ek Pahla Kadam(Company Name) (Team Name)(Team Name) 40 STEP 5 : CONTROL 1. Standardisation – Check Sheet / New SOP / OPL / WI/ Drawing 2. Documentation – Manual / SOP / WI updating, Kaizen Sheet …. 3. Training – OPL, Classroom / Gemba Training on SOP/WI …… 4. Sustainability Plan – Future plan if any – Activity , Responsibility At least one SLIDE for each item – Item 1 ~ 4
  • 41.
    Ek Pahla Kadam(Company Name) (Team Name)(Team Name) MILESTONE CHART - Updated STEP 5 : CONTROL 41 Plant : ABC Power Limited, New Delhi Process : Human Resource Team : LAKSHYA LQC W1 W2 W3 W4 W1 W2 W3 W4 W1 W2 W3 W4 W1 W2 W3 W4 Prepared By : Arman Approved By : Vikas Date of Preparation : 07 Oct, 2018 - Plan - Actual 6 Control Arman Plan Actual 4 Analyse the problem Trisha Plan Actual 5 Improve Arman Plan Actual 2 Define the Problem Smita Plan Actual 3 Measure the Problem John Plan Actual Dec-18 Jan-19 Actual 1 Selection of Problem Arman - Actual Arman Smita John, Trisha Vikas S. No. Step Description Resp. Plan Oct-18 Nov-18 Leader Dy. Leader Member Facilitator Kg Steam / Kg Husk Ratio 2.7 4.2 Oct-18 Jan-19 Project : Improve Steam Fuel Ratio of 18TPH Husk Boiler Target Period Team Measurement Item UOM From To From To
  • 42.
    Ek Pahla Kadam(Company Name) (Team Name)(Team Name) 42 for patient listening.
  • 43.
    Ek Pahla Kadam(Company Name) (Team Name) Thank You Contact : Dinesh Sharma Cell No. : +91 9589004005, 9589892468 e-mail : dinesh@ekpahlakadam.com Connect : https://www.facebook.com/ekpahlakadam Website : ekpahlakadam.com Your Queries & Feedback Please 43 Ek Pahla Kadam, Take it .. Keep moving ..