Download as PDF, PPTX
![ENGINEERS AND DEVICES
WORKING TOGETHER
OpenCSD for Trace Decoding
● Open CoreSight Decoding library
● A joint development effort between Texas Instrument, ARM and Linaro
● Free and open solution for decompressing Program Flow Traces
● Currently support ETMv3, PTM and ETMv4
● Also has support for MIPI trace decoding (output from STM)
● Fully integrated with Perf
● Available on gitHub[1] for anyone to download, integrate and modify
● In-depth presentation in recent CoreDump blog post[2]
[1]. https://github.com/Linaro/OpenCSD
[2]. http://www.linaro.org/blog/core-dump/opencsd-operation-use-library/](https://image.slidesharecdn.com/las16-210-hardwareassistedtracingonarmwithcoresightandopencsd-160923210602/75/LAS16-210-Hardware-Assisted-Tracing-on-ARM-with-CoreSight-and-OpenCSD-12-2048.jpg)
![ENGINEERS AND DEVICES
WORKING TOGETHER
Getting the Right Tools
● First, the OpenCSD library needs to be downloaded
○ On gitHub[1] the master branch carries the OpenCSD code
○ Stable versions are tagged
○ Older version had dedicated branches -- please stick with the latest
○ The “HOWTO.md” tells you which kernel branch will work with the latest version
○ Kernel branches will disappear in a near future
● The kernel branches on gitHub carry the user space functionality
○ There is always a rebase for the latest kernel version
○ perf [record, report, script]
○ Upstreaming of these tools is currently underway
○ Include those patches in a custom tree if CoreSight integration with Perf is to be used
[1]. https://github.com/Linaro/OpenCSD](https://image.slidesharecdn.com/las16-210-hardwareassistedtracingonarmwithcoresightandopencsd-160923210602/75/LAS16-210-Hardware-Assisted-Tracing-on-ARM-with-CoreSight-and-OpenCSD-14-2048.jpg)
![ENGINEERS AND DEVICES
WORKING TOGETHER
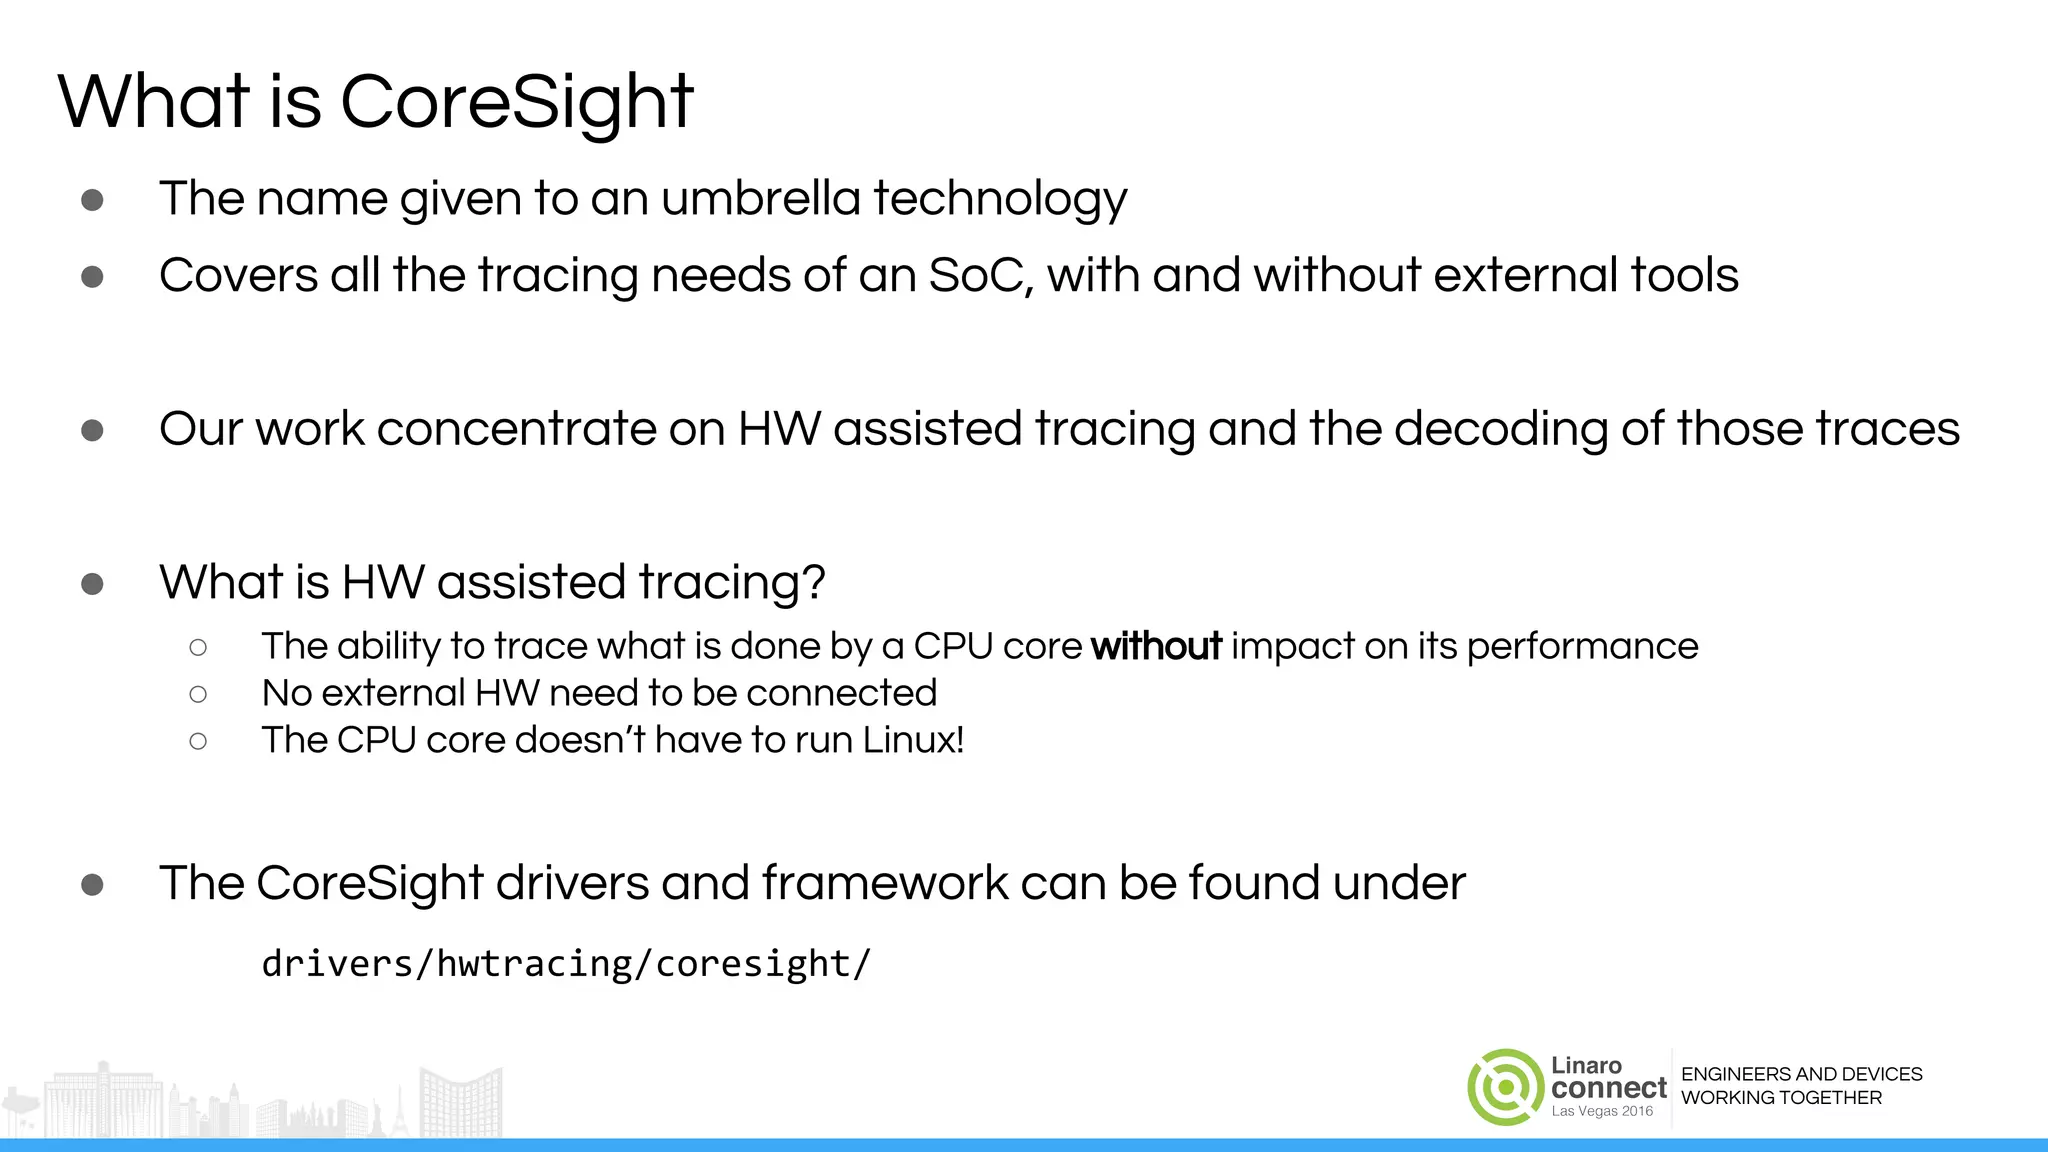
Using CoreSight with Perf (Cont’d)
● Trace data are found in the “perf.data” file
perf report --dump perf.data
0x728 [0x30]: PERF_RECORD_AUXTRACE size: 0xf0 offset: 0 ref: 0x48b2b5695d22eed5 idx: 0 tid: 1796
cpu: -1
. ... CoreSight ETM Trace data: size 240 bytes
0: I_ASYNC : Alignment Synchronisation.
12: I_TRACE_INFO : Trace Info.
17: I_ADDR_L_64IS0 : Address, Long, 64 bit, IS0.; Addr=0xFFFFFF800857ED08;
48: I_ASYNC : Alignment Synchronisation.
60: I_TRACE_INFO : Trace Info.
65: I_ADDR_L_64IS0 : Address, Long, 64 bit, IS0.; Addr=0xFFFFFF800857ED08;
96: I_ASYNC : Alignment Synchronisation.
108: I_TRACE_INFO : Trace Info.
113: I_ADDR_L_64IS0 : Address, Long, 64 bit, IS0.; Addr=0xFFFFFF800857ED08;
144: I_ASYNC : Alignment Synchronisation.
....](https://image.slidesharecdn.com/las16-210-hardwareassistedtracingonarmwithcoresightandopencsd-160923210602/75/LAS16-210-Hardware-Assisted-Tracing-on-ARM-with-CoreSight-and-OpenCSD-21-2048.jpg)
![ENGINEERS AND DEVICES
WORKING TOGETHER
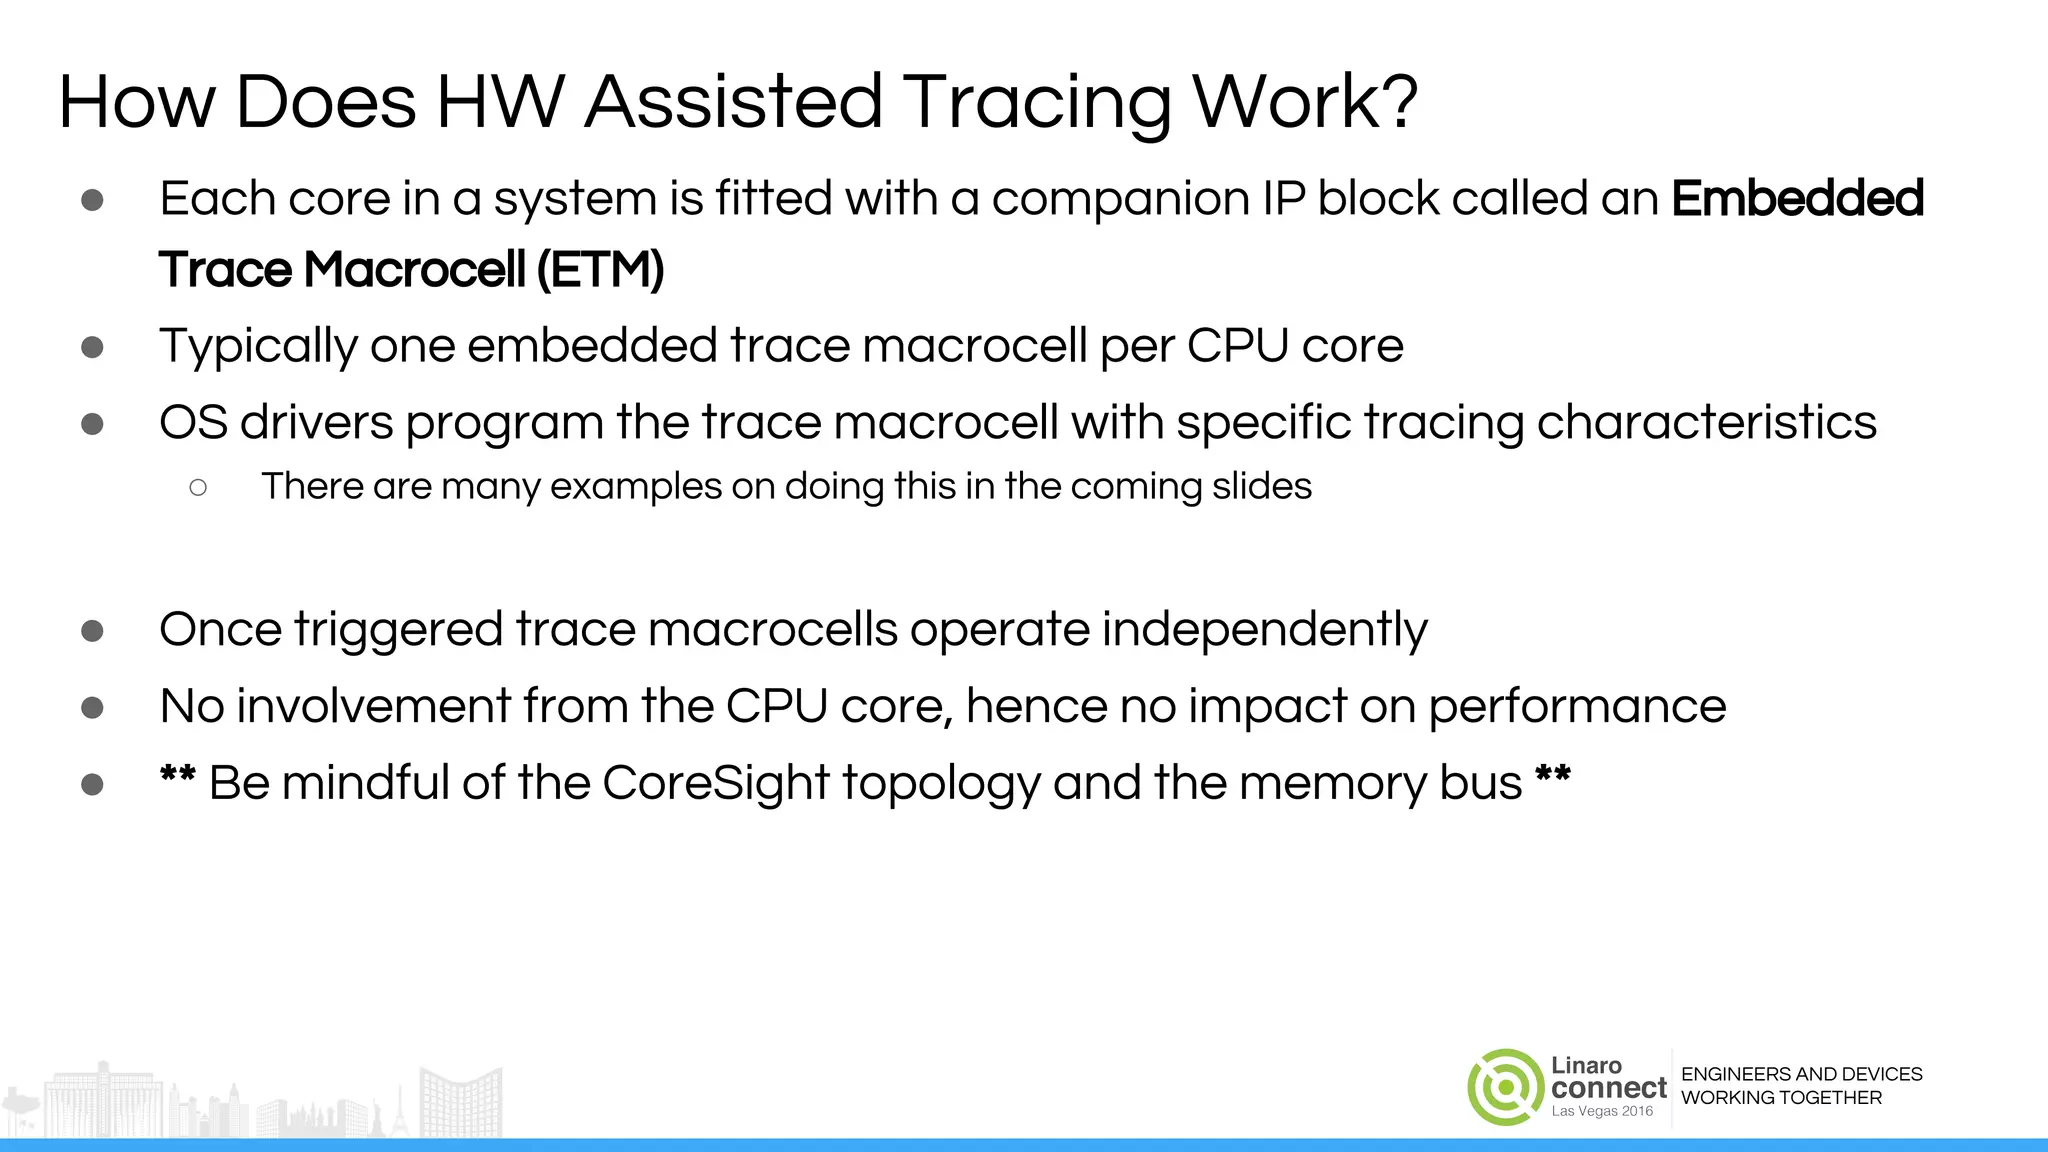
Objdump the Code to Trace
$ aarch64-linux-gnu-objdump -d libcstest.so.1.0
000000000000072c <coresight_test1>:
72c: d10083ff sub sp, sp, #0x20
730: b9000fe0 str w0, [sp,#12]
734: b9001fff str wzr, [sp,#28]
738: 14000007 b 754 <coresight_test1+0x28>
73c: b9400fe0 ldr w0, [sp,#12]
740: 11000800 add w0, w0, #0x2
744: b9000fe0 str w0, [sp,#12]
748: b9401fe0 ldr w0, [sp,#28]
74c: 11000400 add w0, w0, #0x1
750: b9001fe0 str w0, [sp,#28]
754: b9401fe0 ldr w0, [sp,#28]
758: 7100101f cmp w0, #0x4
75c: 54ffff0d b.le 73c <coresight_test1+0x10>
760: b9400fe0 ldr w0, [sp,#12]
764: 910083ff add sp, sp, #0x20
768: d65f03c0 ret](https://image.slidesharecdn.com/las16-210-hardwareassistedtracingonarmwithcoresightandopencsd-160923210602/75/LAS16-210-Hardware-Assisted-Tracing-on-ARM-with-CoreSight-and-OpenCSD-23-2048.jpg)
![ENGINEERS AND DEVICES
WORKING TOGETHER
Generating Traces on the Target
root@linaro-nano:~# date
Wed Sep 7 20:17:36 UTC 2016
root@linaro-nano:~# uname -mr
4.8.0-rc5+ aarch64
root@linaro-nano:~# ls /opt/lib/libcstest.so*
/opt/lib/libcstest.so /opt/lib/libcstest.so.1 /opt/lib/libcstest.so.1.0
root@linaro-nano:~# rm -rf ~/.debug
root@linaro-nano:~# echo 0 > /proc/sys/kernel/kptr_restrict
root@linaro-nano:~# perf record -e cs_etm/@20070000.etr/u --filter 'filter
0x72c/0x40@/opt/lib/libcstest.so.1.0' --per-thread ./main
val: 20
[ perf record: Woken up 1 times to write data ]
[ perf record: Captured and wrote 0.002 MB perf.data ]
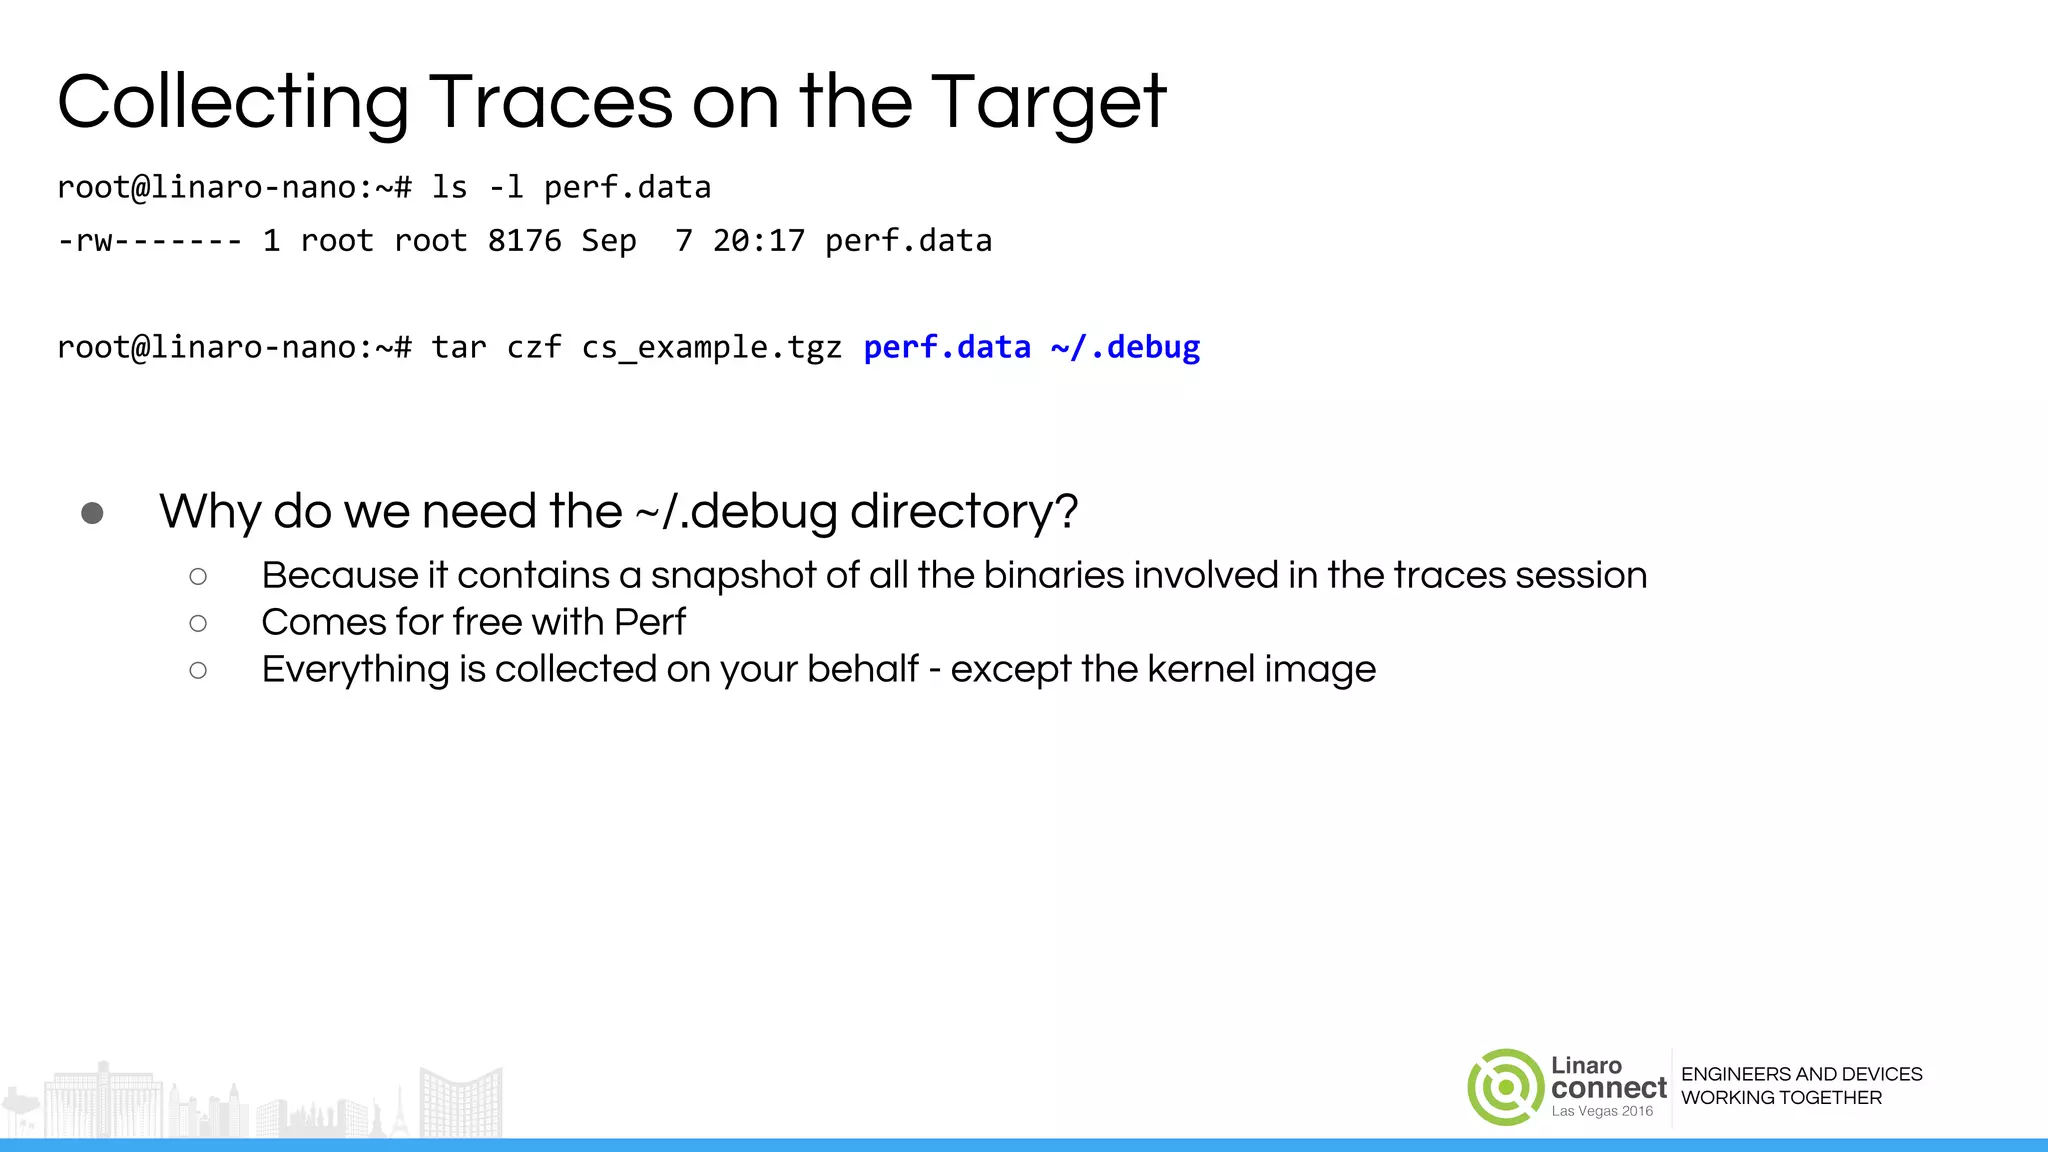
root@linaro-nano:~# ls -l perf.data
-rw------- 1 root root 8176 Sep 7 20:17 perf.data](https://image.slidesharecdn.com/las16-210-hardwareassistedtracingonarmwithcoresightandopencsd-160923210602/75/LAS16-210-Hardware-Assisted-Tracing-on-ARM-with-CoreSight-and-OpenCSD-24-2048.jpg)
![ENGINEERS AND DEVICES
WORKING TOGETHER
The Importance of the “.debug” Directory
root@linaro-nano:~# tree .debug
.debug
├── [kernel.kallsyms]
│ └── 942a60ae69427f5dbaa1c3541671e504509bd5db
│ └── kallsyms
├── [vdso]
│ └── f1e1d7c7f2c709fb14ee135018417767eecbc0dd
│ └── vdso
├── home
│ └── linaro
│ └── main
│ └── 9a6850fab2ebbe386d3619bce3674a55622f2872
│ └── elf
├── lib
│ └── aarch64-linux-gnu
│ ├── ld-2.21.so
│ │ └── 94912dc5a1dc8c7ef2c4e4649d4b1639b6ebc8b7
│ │ └── elf
│ └── libc-2.21.so
│ └── 169a143e9c40cfd9d09695333e45fd67743cd2d6
│ └── elf
....
└── opt
└── lib
└── libcstest.so.1.0
└── 3b3051b8a67f212a66e383fc90db3c2bde8f936f
└── elf
18 directories, 6 files](https://image.slidesharecdn.com/las16-210-hardwareassistedtracingonarmwithcoresightandopencsd-160923210602/75/LAS16-210-Hardware-Assisted-Tracing-on-ARM-with-CoreSight-and-OpenCSD-26-2048.jpg)
![ENGINEERS AND DEVICES
WORKING TOGETHER
Off Target Trace Decoding: “perf report”
$ tar xf cs_example.tgz
$ rm -rf ~/.debug // remove previous trace data
$ cp -dpR .debug ~/ // copy the current trace data
$ perf report --stdio // by default file “perf.data” is used
# To display the perf.data header info, please use --header/--header-only options.
#
#
# Total Lost Samples: 0
#
# Samples: 8 of event 'instructions:u'
# Event count (approx.): 55
#
# Children Self Command Shared Object Symbol
# ........ ........ ....... ................ ......................
#
81.82% 81.82% main libcstest.so.1.0 [.] 0x000000000000073c
7.27% 7.27% main libcstest.so.1.0 [.] 0x000000000000072c
5.45% 5.45% main libcstest.so.1.0 [.] 0x0000000000000754
5.45% 5.45% main libcstest.so.1.0 [.] 0x0000000000000760](https://image.slidesharecdn.com/las16-210-hardwareassistedtracingonarmwithcoresightandopencsd-160923210602/75/LAS16-210-Hardware-Assisted-Tracing-on-ARM-with-CoreSight-and-OpenCSD-27-2048.jpg)
![ENGINEERS AND DEVICES
WORKING TOGETHER
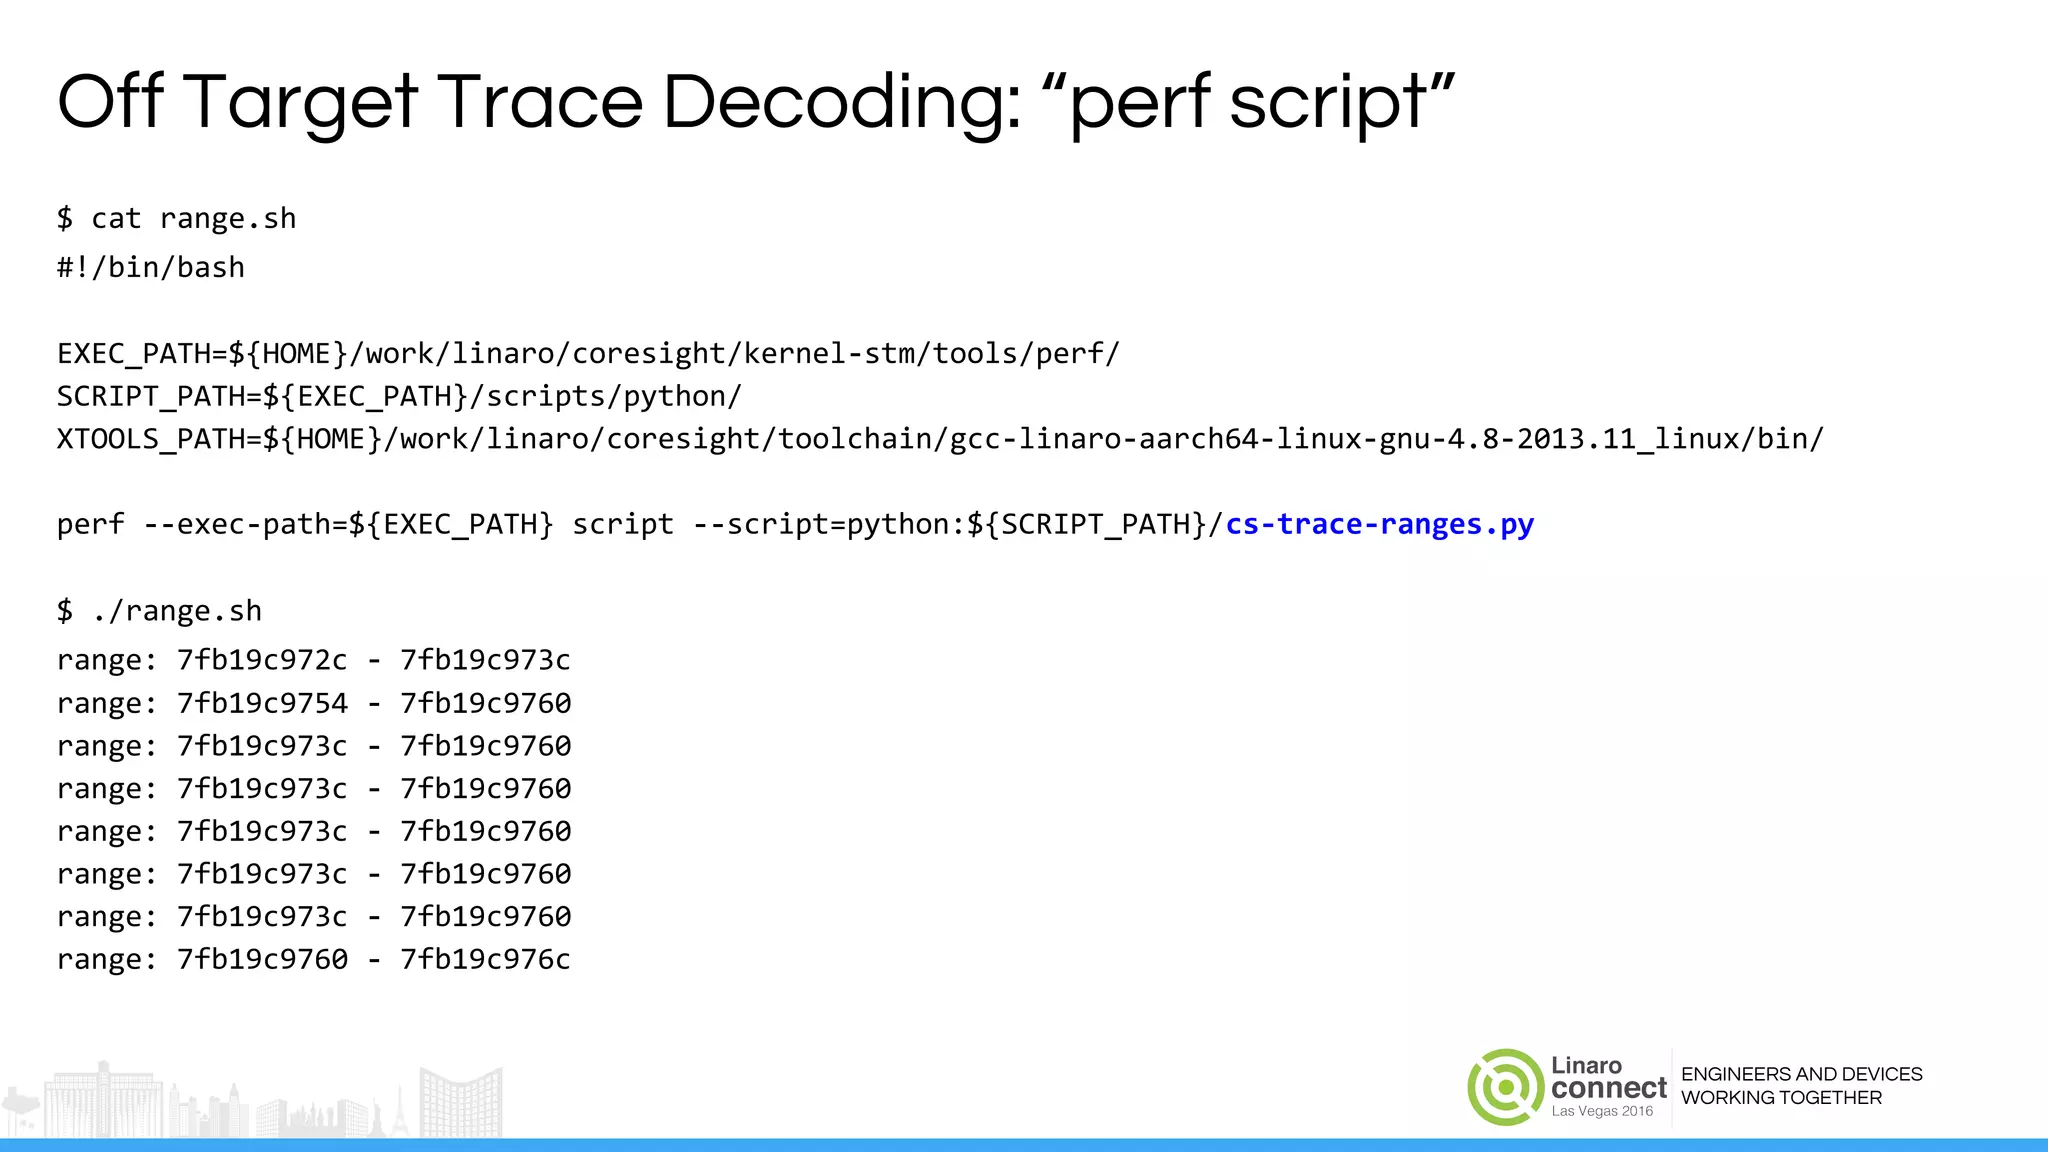
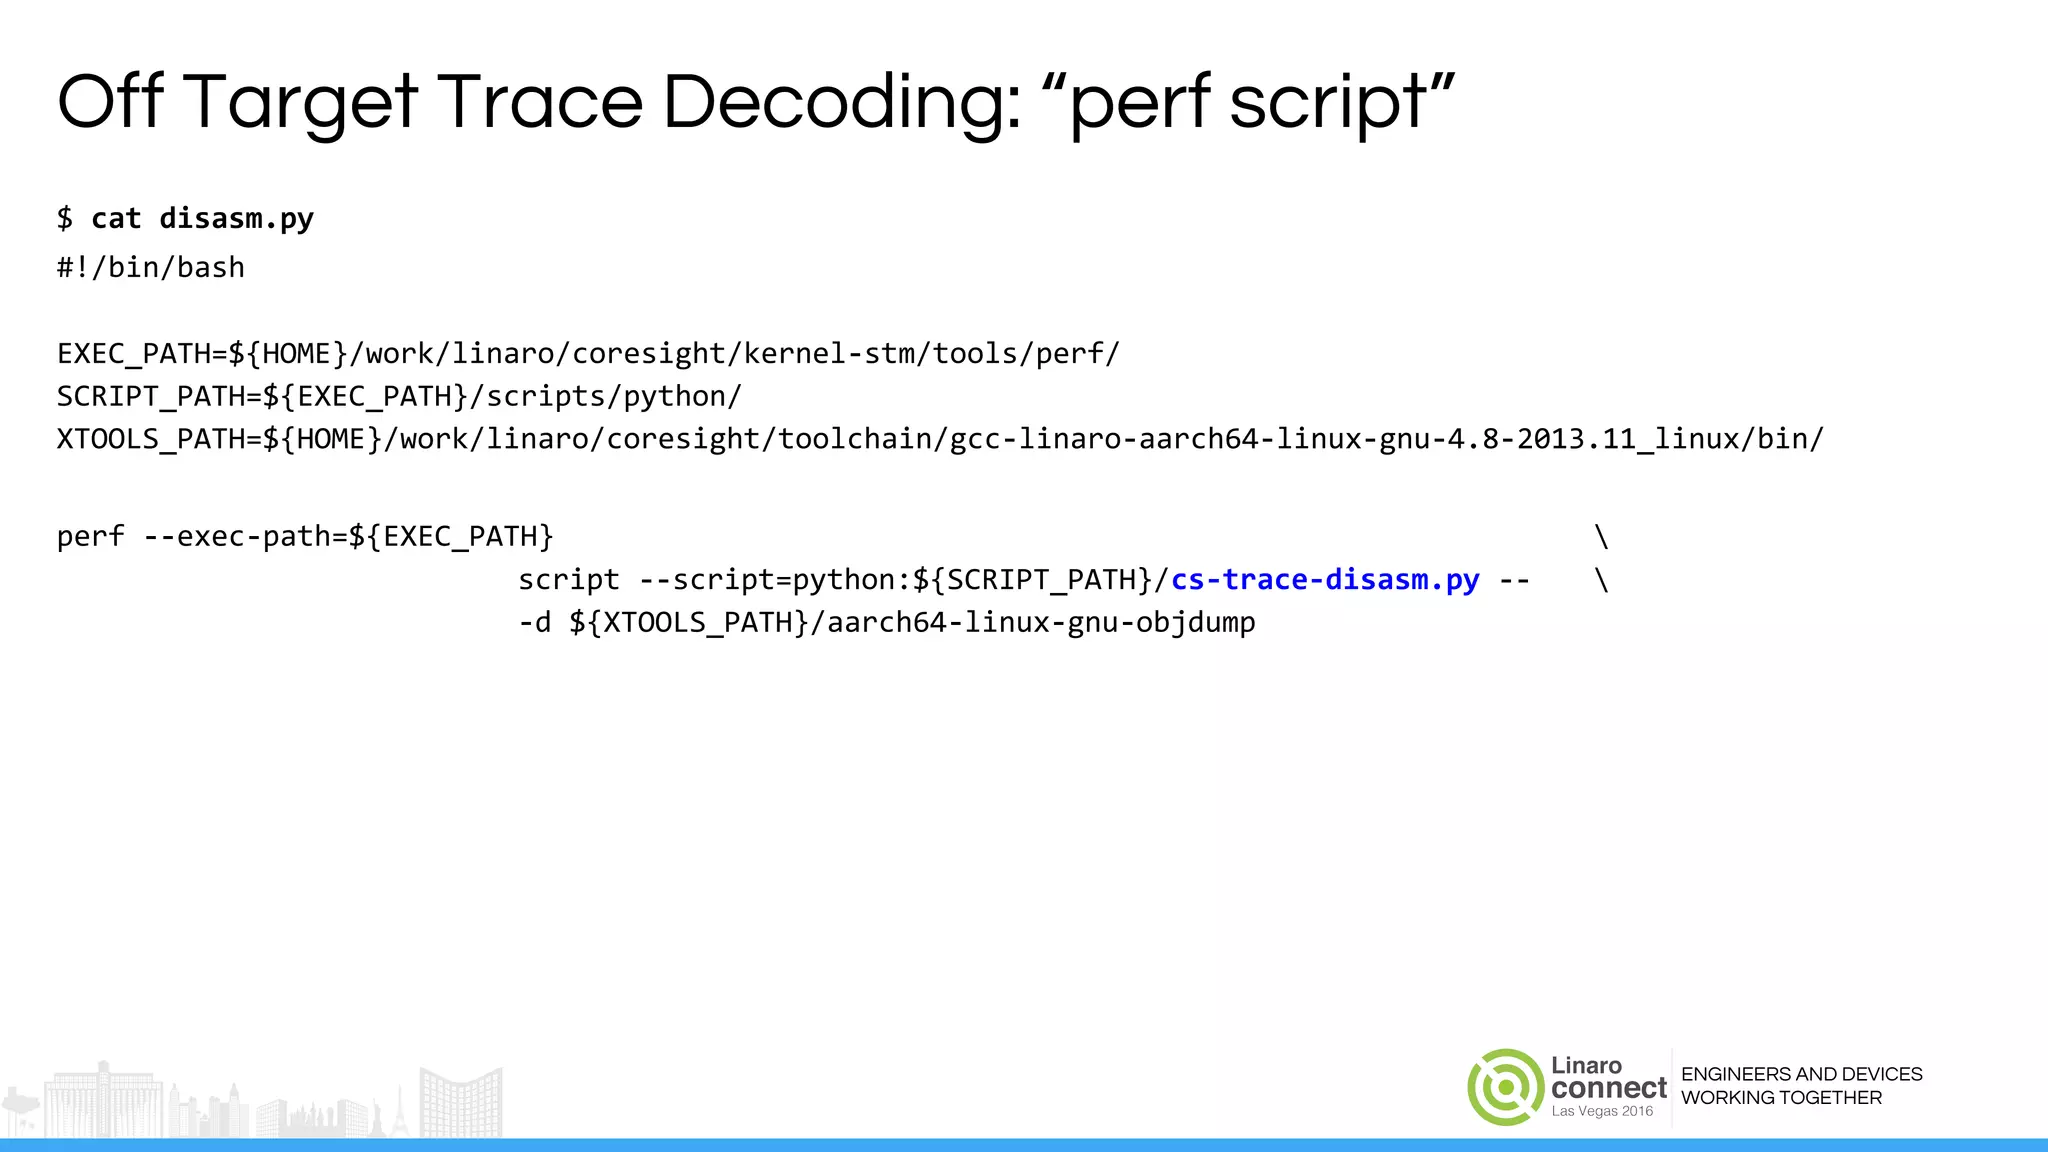
Off Target Trace Decoding: “perf script”
$ perf script
main 1796 4 instructions:u: 7fb19c972c [unknown] (/opt/lib/libcstest.so.1.0)
main 1796 3 instructions:u: 7fb19c9754 [unknown] (/opt/lib/libcstest.so.1.0)
main 1796 9 instructions:u: 7fb19c973c [unknown] (/opt/lib/libcstest.so.1.0)
main 1796 9 instructions:u: 7fb19c973c [unknown] (/opt/lib/libcstest.so.1.0)
main 1796 9 instructions:u: 7fb19c973c [unknown] (/opt/lib/libcstest.so.1.0)
main 1796 9 instructions:u: 7fb19c973c [unknown] (/opt/lib/libcstest.so.1.0)
main 1796 9 instructions:u: 7fb19c973c [unknown] (/opt/lib/libcstest.so.1.0)
main 1796 3 instructions:u: 7fb19c9760 [unknown] (/opt/lib/libcstest.so.1.0)
VMA portion ELF portion](https://image.slidesharecdn.com/las16-210-hardwareassistedtracingonarmwithcoresightandopencsd-160923210602/75/LAS16-210-Hardware-Assisted-Tracing-on-ARM-with-CoreSight-and-OpenCSD-28-2048.jpg)
![ENGINEERS AND DEVICES
WORKING TOGETHER
Off Target Trace Decoding: “perf script”
FILE: /opt/lib/libcstest.so.1.0 CPU: 3
7fb19c972c:d10083ff sub sp, sp, #0x20
7fb19c9730:b9000fe0 str w0, [sp,#12]
7fb19c9734:b9001fff str wzr, [sp,#28]
7fb19c9738:14000007 b 7fb19c9754 <__gmon_start__@plt+0x134>
● Where does the first part of the address come from?
$ perf script --show-mmap-events | grep PERF_RECORD_MMAP2
main 1796 PERF_RECORD_MMAP2 1796/1796: [0x400000(0x1000) @ 0 08:02 33169 1522333852]: r-xp /home/linaro/main
main 1796 PERF_RECORD_MMAP2 1796/1796: [0x7fb19db000(0x2f000) @ 0 08:02 574 1811179601]: r-xp
/lib/aarch64-linux-gnu/ld-2.21.so
main 1796 PERF_RECORD_MMAP2 1796/1796: [0x7fb19c9000(0x12000) @ 0 08:02 38308 4289568329]: r-xp
/opt/lib/libcstest.so.1.0
main 1796 PERF_RECORD_MMAP2 1796/1796: [0x7fb1880000(0x149000) @ 0 08:02 543 1811179570]: r-xp
/lib/aarch64-linux-gnu/libc-2.21.so](https://image.slidesharecdn.com/las16-210-hardwareassistedtracingonarmwithcoresightandopencsd-160923210602/75/LAS16-210-Hardware-Assisted-Tracing-on-ARM-with-CoreSight-and-OpenCSD-29-2048.jpg)
![ENGINEERS AND DEVICES
WORKING TOGETHER
Off Target Trace Decoding: “perf script”
FILE: /opt/lib/libcstest.so.1.0 CPU: 3
7fb19c972c:d10083ff sub sp, sp, #0x20
7fb19c9730:b9000fe0 str w0, [sp,#12]
7fb19c9734:b9001fff str wzr, [sp,#28]
7fb19c9738:14000007 b 7fb19c9754 <__gmon_start__@plt+0x134>
FILE: /opt/lib/libcstest.so.1.0 CPU: 3
7fb19c9754:b9401fe0 ldr w0, [sp,#28]
7fb19c9758:7100101f cmp w0, #0x4
7fb19c975c:54ffff0d b.le 7fb19c973c <__gmon_start__@plt+0x11c>
FILE: /opt/lib/libcstest.so.1.0 CPU: 3
7fb19c973c:b9400fe0 ldr w0, [sp,#12]
7fb19c9740:11000800 add w0, w0, #0x2
7fb19c9744:b9000fe0 str w0, [sp,#12]
7fb19c9748:b9401fe0 ldr w0, [sp,#28]
7fb19c974c:11000400 add w0, w0, #0x1
7fb19c9750:b9001fe0 str w0, [sp,#28]
7fb19c9754:b9401fe0 ldr w0, [sp,#28]
7fb19c9758:7100101f cmp w0, #0x4
7fb19c975c:54ffff0d b.le 7fb19c973c <__gmon_start__@plt+0x11c>
...
...](https://image.slidesharecdn.com/las16-210-hardwareassistedtracingonarmwithcoresightandopencsd-160923210602/75/LAS16-210-Hardware-Assisted-Tracing-on-ARM-with-CoreSight-and-OpenCSD-32-2048.jpg)


The document provides an overview of hardware-assisted tracing on ARM using the CoreSight technology, focusing on practical usage rather than in-depth theory. It covers key topics such as enabling CoreSight, integration with the perf core, the OpenCSD library for trace decoding, and common pitfalls during implementation. Additionally, it includes details on generating traces and using them effectively in real-world scenarios.


![Vibe Coding vs. Spec-Driven Development [Free Meetup]](https://cdn.slidesharecdn.com/ss_thumbnails/vibecodingvsspecdrivendevelopment-251209105622-43f455e7-thumbnail.jpg?width=640&height=640&fit=bounds)


