Downloaded 151 times
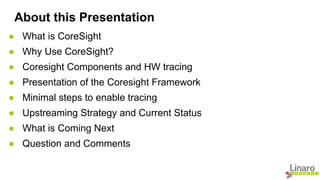
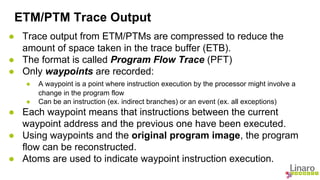
![ETM/PTM Trace Output Decoding
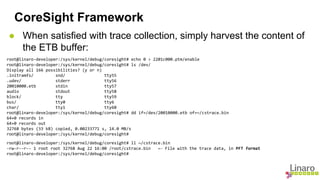
● Decoding trace output is not to be taken lightly.
● Program Linaro has experimented with:
● ptm2human [1]:
● Not bad for an experimental exercise
● List received packet, i.e, sync, atoms, timestamps
● Does not interpret the content of the packet, so no waypoint decoding
● completely free, thumbs up to “hwangcc23”
● ARM DS-5:
● Yields very detailed traces
● Program execution can be reconstructed perfectly - see [2] for more information
● Other trace decoding programs:
● Texas Instrument’s Code Composer Studio
● Lauderbach Trace32
● Trace decoding is currently a big problem.
● Linaro is weighing options on how to proceed in this area.](https://image.slidesharecdn.com/lcu14-101-coresightoverview-140908174026-phpapp01/85/Lcu14-101-coresight-overview-11-320.jpg)
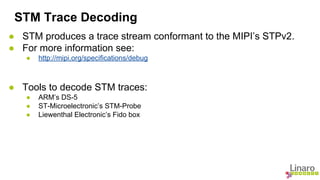
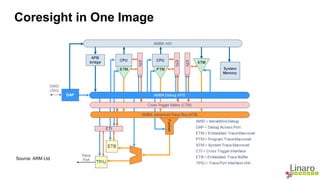
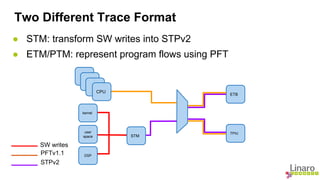
![Linaro CoreSight Framework
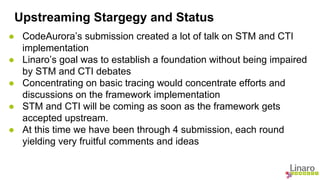
● Linaro Started working on CoreSight in March after LCA2014
● Started from the initial framework submitted by Pratik Patel [3]
● The framework provides support for:
● source: ETMv3.3 to ETMv3.5 along with PTMv1.0 and PTMv1.1
● link: 8 port funnel and non-configurable replicator
● sink: ETBv1.0, TPIU and TMC (Trace Memory Controller)
● Support for STM and CTI will be submitted when the base
framework is accepted upstream.
● With the framework it is possible to aggregate, configure and
collect trace data seamlessly on a platform.](https://image.slidesharecdn.com/lcu14-101-coresightoverview-140908174026-phpapp01/85/Lcu14-101-coresight-overview-13-320.jpg)
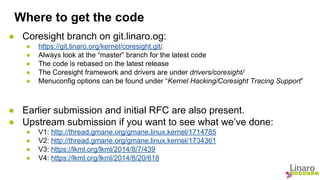
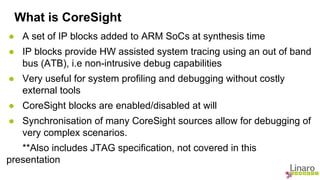
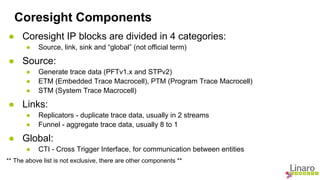
![What is Next (Cont’d)
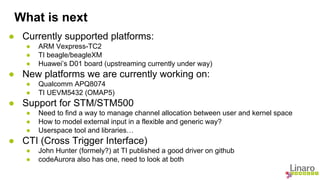
● Support for ARMv8
● The framework has been developed on ARMv7, need to see how it will work on V8
● Devices, like STM500 ant ETMv4, are tailored for V8
● STM500 may turn out to be like STM
● ETMv4 is a very different implementation than ETMv3.x
● How to support the tracing of application code?
● Integration with other kernel subsystem, i.e Perf and Ftrace
● Follow what other architectures are doing and not re-invent the
wheel:
● Intel’s PT architecture [6][7]
● MIPS ?](https://image.slidesharecdn.com/lcu14-101-coresightoverview-140908174026-phpapp01/85/Lcu14-101-coresight-overview-23-320.jpg)
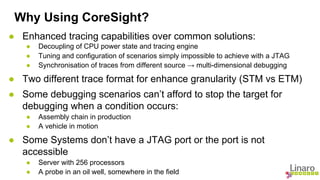
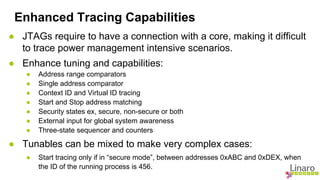
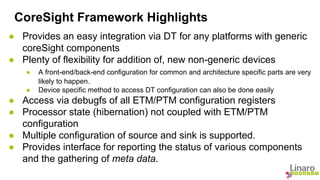
![Challenges (Preview of the Next Session)
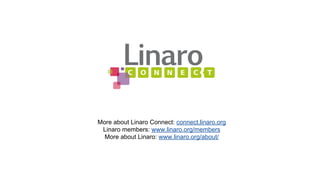
● How data is represented in the trace stream depends on how the
trace source has been configure (cycle accurate, timestamp)
● Unlike ftrace, trace streams can’t simply be exported off platform and decoded
● There has to be knowledge about the configuration and the image in memory
● Commonly called the “metadata” problem
● Identification of trace stream decoder that is open and free
● ptm2human is a very good start.
● etm-objdump[4]]5] also did a very promising decoder
● Both need to be improved (and maintained)
● How do we control traces from the kernel?
● ftrace has the capability to start and stop traces using a kernel API
● Do we need the same mechanism for coresight?
● STM channel allocation and management](https://image.slidesharecdn.com/lcu14-101-coresightoverview-140908174026-phpapp01/85/Lcu14-101-coresight-overview-24-320.jpg)
![Question and Comment
[1]. https://github.com/hwangcc23/ptm2human
[2]. https://wiki.linaro.org/WorklingGroups/Kernel/Coresight/traceDecodingWithDS5
[3]. http://lists.infradead.org/pipermail/linux-arm-kernel/2012-December/138646.html
[4]. http://lists.linaro.org/pipermail/linaro-dev/2012-November/014439.html
[5]. http://lists.linaro.org/pipermail/linaro-dev/2012-November/014476.html
[6]. http://thread.gmane.org/gmane.linux.kernel/1771197
[7]. https://software.intel.com/en-us/blogs/2013/09/18/processor-tracing](https://image.slidesharecdn.com/lcu14-101-coresightoverview-140908174026-phpapp01/85/Lcu14-101-coresight-overview-25-320.jpg)

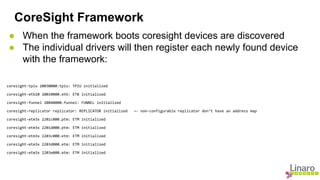
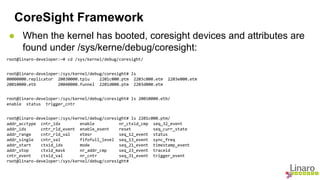
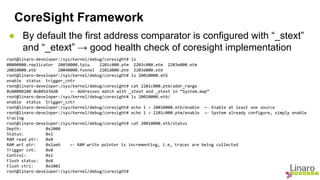
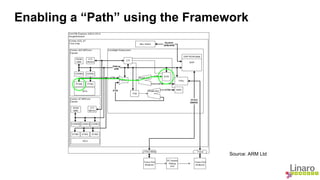
The document provides an overview of Coresight, a set of ARM IP blocks for hardware-assisted system tracing, emphasizing its advantages over traditional JTAG solutions for non-intrusive debugging. It details the components of the Coresight framework, including trace formats, devices, and how to enable tracing, along with development updates and upstream submission strategies. The framework aims to support complex debugging scenarios and is currently being developed for various ARM platforms, with future enhancements planned for architecture support and external tool integration.