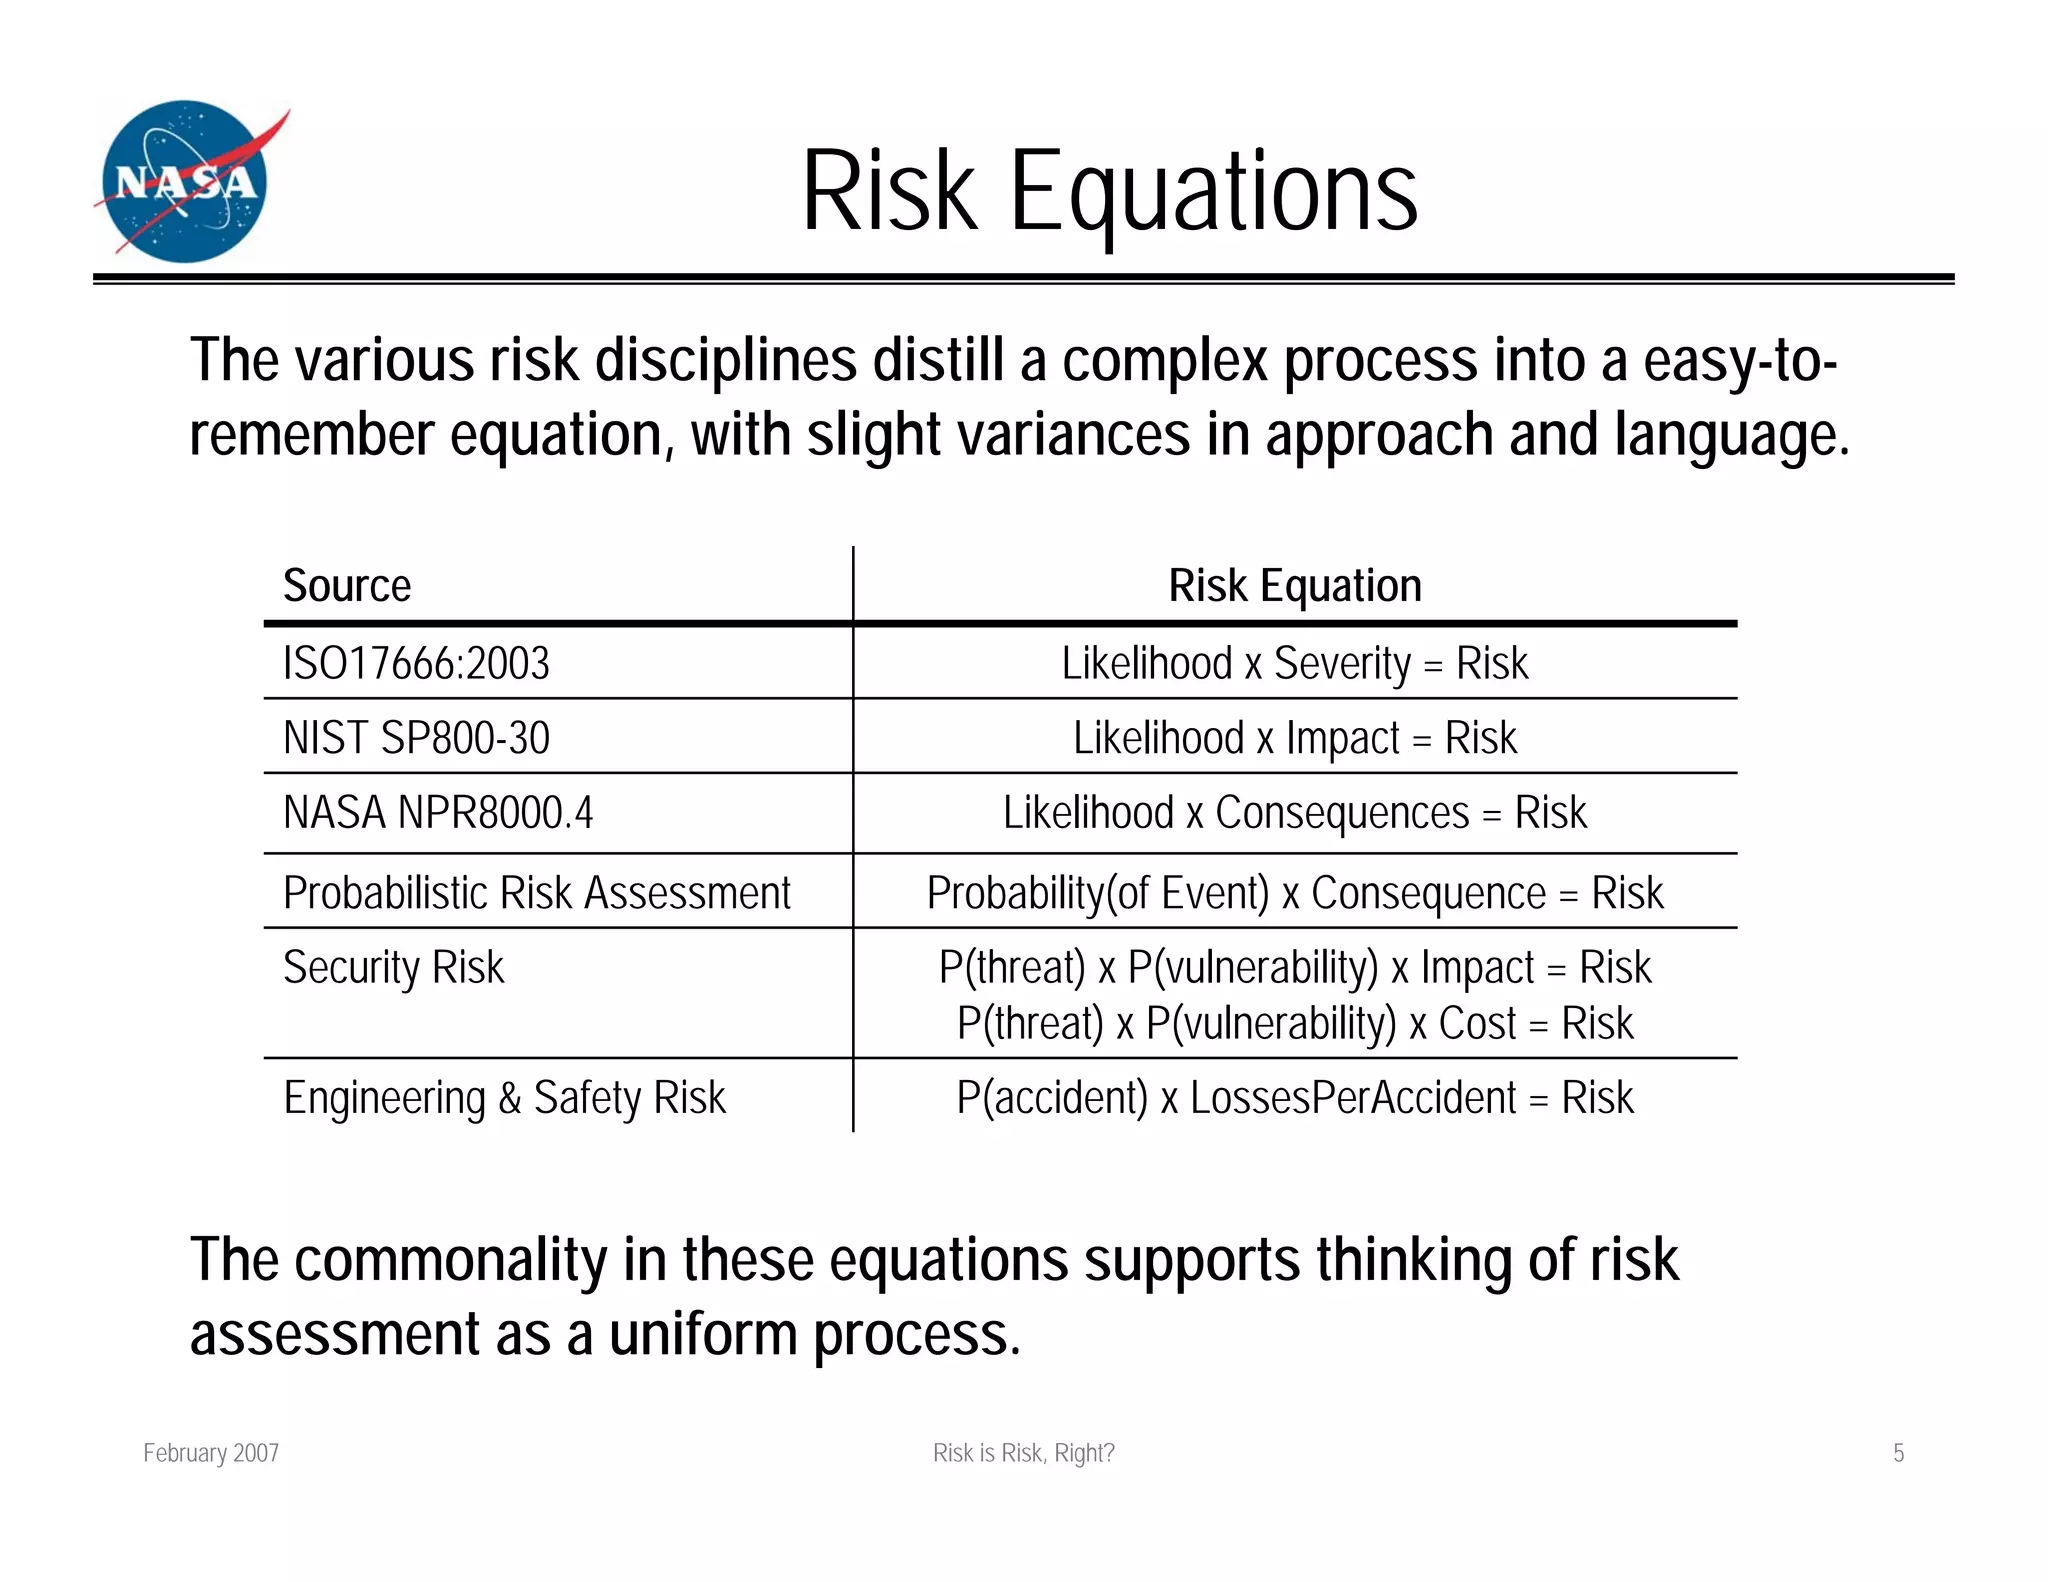
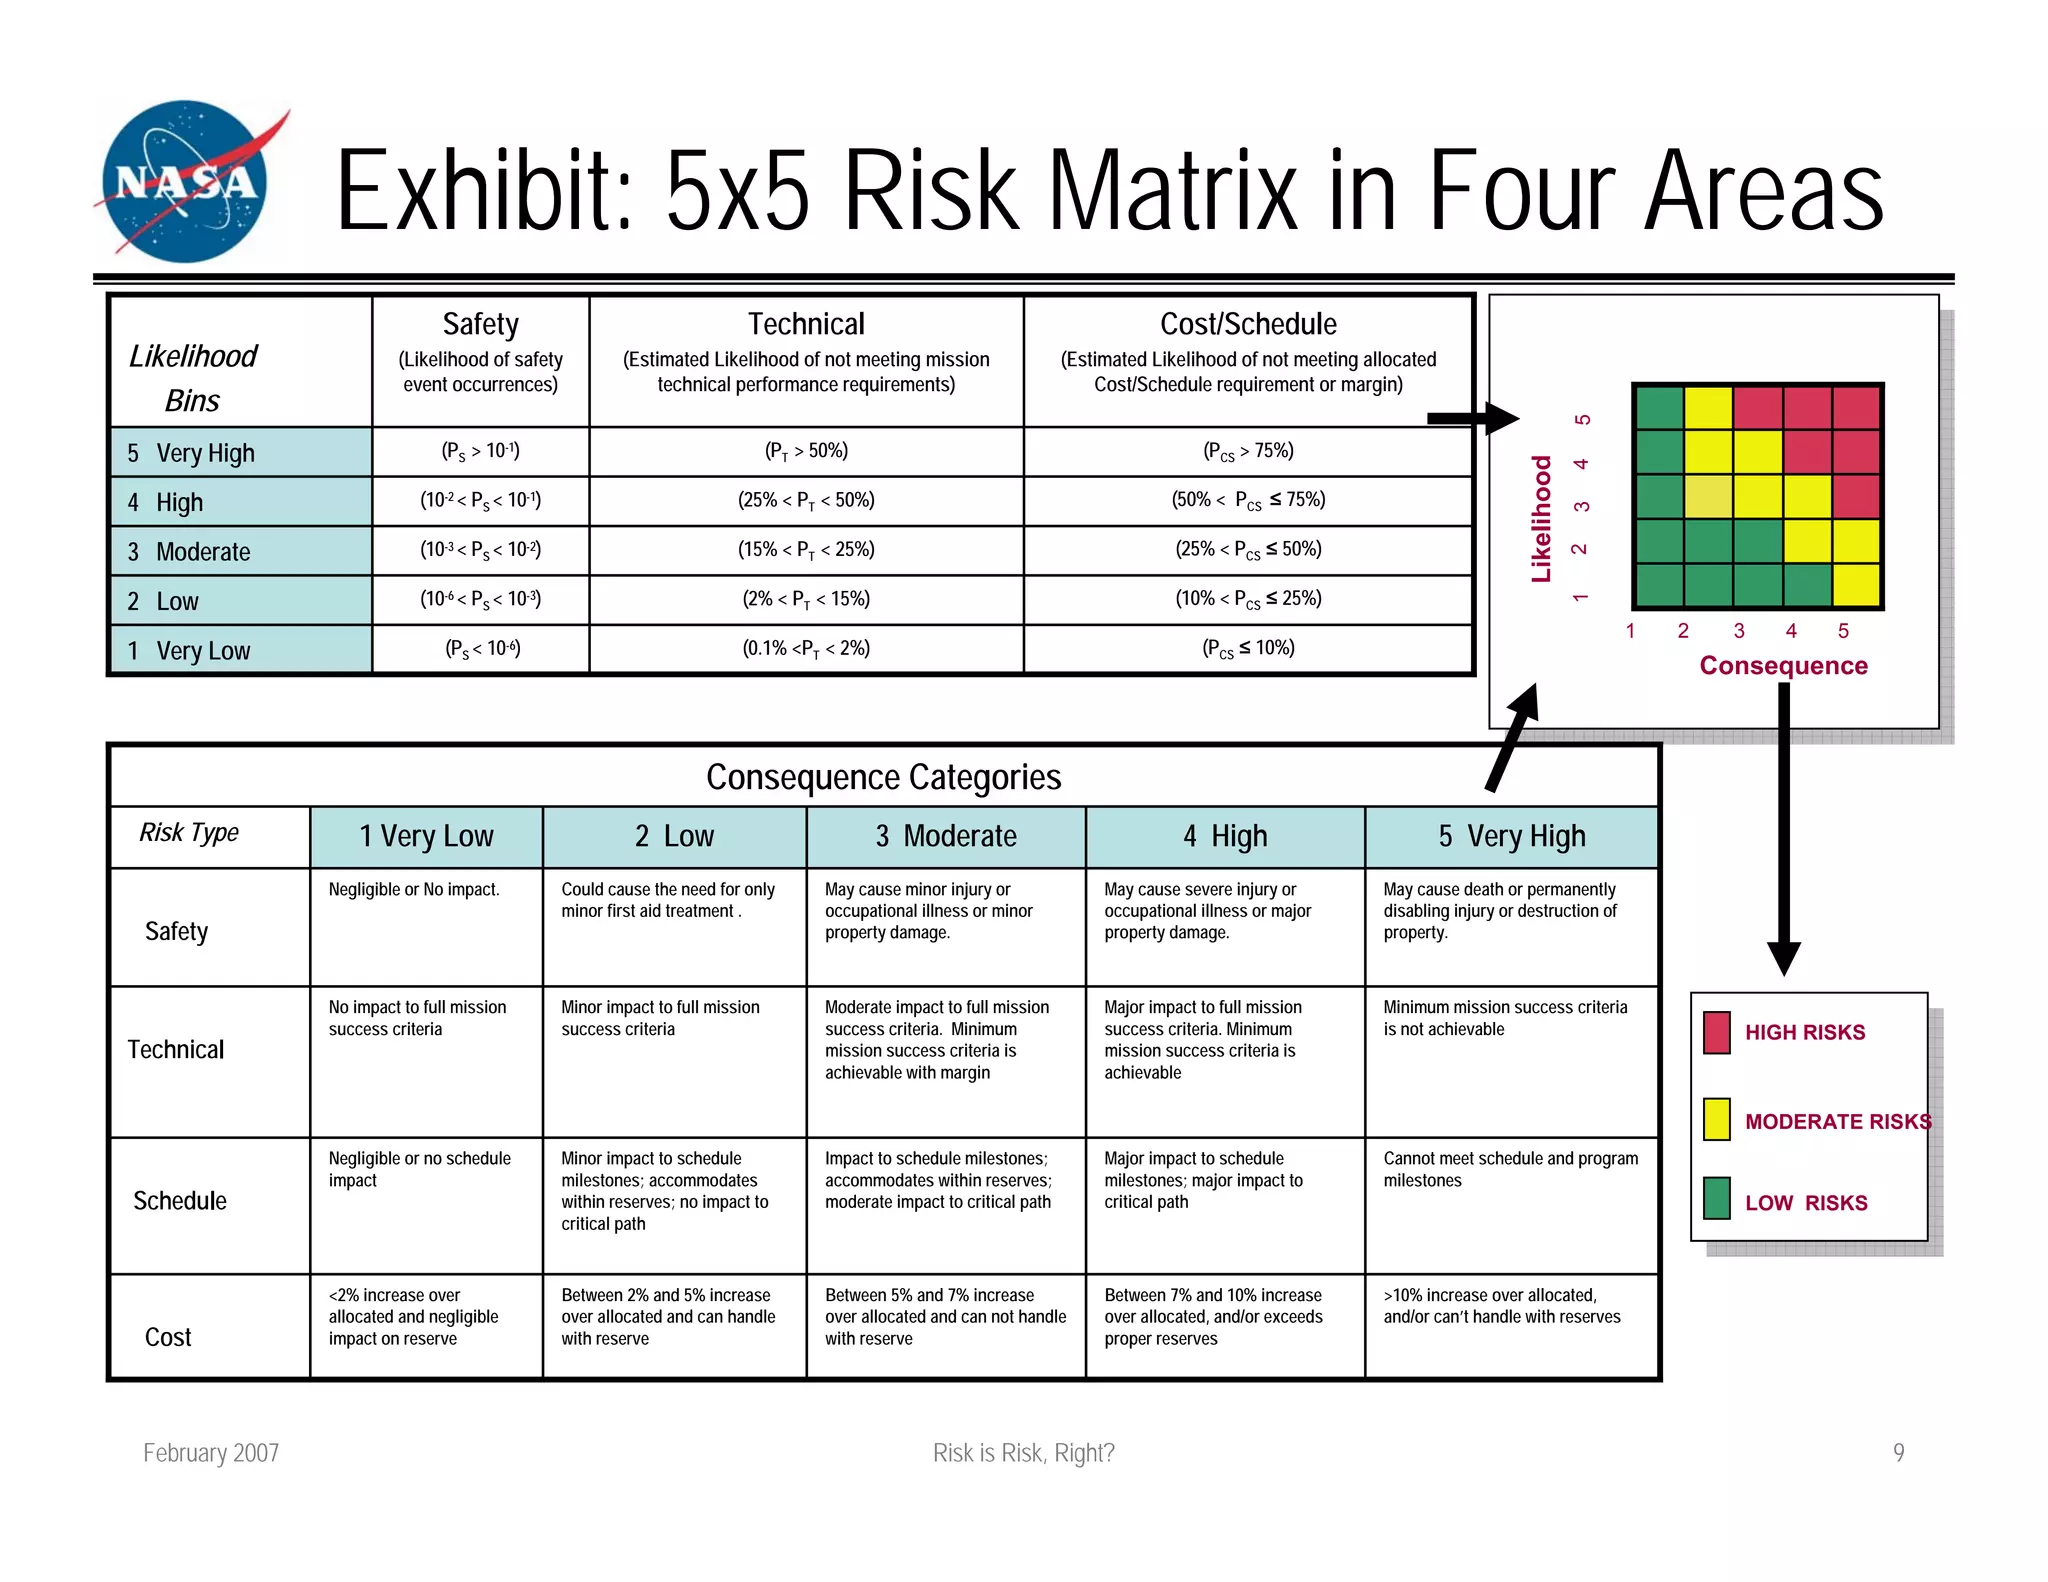
The document discusses how different fields approach risk assessment but use similar frameworks involving likelihood and impact/consequences. It reviews common risk equations and challenges in evaluating likelihood, threats/vulnerabilities, and impact. The document also compares how project management, engineering, and security approach risk management.
NASA uses two complementary processes for risk management: risk-informed decision making (RIDM) and continuous risk management (CRM). RIDM emphasizes using risk analysis to make risk-informed decisions across dimensions like safety, cost, and schedule. CRM manages risks associated with implementation and uses risk statements to document risks across multiple dimensions. Current risk analysis methods often fail to provide a complete risk picture by only considering risks one dimension at a time. MRisk addresses this by analyzing risks across all dimensions simultaneously using anchor points and Mahalanobis distance, providing a more objective and accurate assessment of total project risk.
The document discusses risk assessment and mitigation strategies for a bank. It outlines the process of assessing risk, which includes identifying prevalent risks, assessing their impact and frequency, developing controls, and reassessing exposures. It also evaluates options for mitigating risk, such as periodic assessments, maintaining a risk register, and reviewing contingency plans. Key considerations for selecting mitigation actions include ensuring effectiveness, cost efficiency, alignment with business operations, and consistency with regulatory requirements.
Identify risks and hazards that have the potential to harm any process or project. Use content-ready Risk Assessment PowerPoint Presentation Slides to analyse what can go wrong, how likely it is to happen, what potential consequences are, and how tolerable the identified is. With the help of ready-made risk assessment PowerPoint presentation slideshow, use control measures to eliminate or reduce any potential risk related situation. This deck comprises of various templates to control risks such as types of risks, risk categories, identify the risk categories, stakeholder engagement, stakeholders risk appetite, risk tolerance, procedure, risk management plan, risk register, risk identification, risk assessment, risk analysis, risk response plan, risk response matrix, risk control matrix, risk item tracking, risk impact and probability analysis, risk mitigation strategies, qualitative risk analysis, quantitative risk analysis, risk management process, risk management steps, and more. These templates are completely customizable. You can easily edit the color, text, icon and font size as per your need. Add or remove content, if needed. Grab this easy-to-understand risk assessment PowerPoint templates to figure out what could cause harm to the project, whether the hazards could be eliminated or not, what preventive measures should be taken to control the risks. Download risk assessment PPT slides now to execute the project easily. Behave in a down to earth fashion with our Risk Assessment Powerpoint Presentation Slides. Give them a glimpse of your fact based approach. https://bit.ly/3dCPKul
Jonathon Simon, a senior manager at Ernst & Young, presented on risk management. He discussed (1) defining risk management and the risk management lifecycle, (2) examples of good and bad risk management practices, and (3) critical success factors for effective risk management including being proactive and conducting regular risk assessments and scenario planning. The presentation also included an EY case study about implementing robust risk management processes for a government health project.
Risk offshoring brings cost benefits but also builds risk knowledge through centralization. It is important to set clear governance and ownership over processes, regardless of location. While market risk offshoring has been successful, credit risk results vary due to needing more client interaction. The document discusses different offshoring models and their tradeoffs regarding costs, efficiency, and challenges like cultural differences, motivation, and competitive demand for risk professionals.
Implementing Ways to Limit Risk (Risk Mitigation)JOSEPH Maas
This document discusses various methods for mitigating risks on projects. It describes:
1) The importance of ongoing risk management planning and incorporating mitigation strategies and action plans into project execution plans.
2) Characteristics risk mitigation plans should have such as identifying root causes of risks and evaluating alternative mitigation strategies.
3) Various risk response and mitigation tools including risk transfer, buffering, avoidance, control, and organizational flexibility.
4) Managing risks requires addressing preventable internal risks, strategically accepting some risks, and acknowledging external risks outside a company's control.
The Naval Aviation Enterprise Carrier Readiness Team required a quantitative risk analysis methodology to holistically assess risks to aircraft carrier availability given strategic challenges including a reduction in carriers, budget constraints, aging aircraft, and maintenance schedules; the methodology involved identifying risks, analyzing historical data, collaborating with stakeholders, modeling risks, and translating results to availability metrics to evaluate cost and schedule impacts and sensitivity. The risk analysis provided recommendations on priority areas including maintenance schedules, system dependencies, bottlenecks, and costs to inform strategic planning for carrier availability.
This complete presentation has a set of thirtyseven slides to show your mastery of the subject. Use this ready-made PowerPoint presentation to present before your internal teams or the audience. All presentation designs in this Risk Mitigation Strategies Powerpoint Presentation Slides have been crafted by our team of expert PowerPoint designers using the best of PPT templates, images, data-driven graphs and vector icons. The content has been well-researched by our team of business researchers. The biggest advantage of downloading this deck is that it is fully editable in PowerPoint. You can change the colors, font and text without any hassle to suit your business needs.
The document provides an introduction to Factor Analysis of Information Risk (FAIR), a framework for quantitative risk analysis developed in 2001. It defines key risk concepts, compares qualitative and quantitative approaches, and outlines how FAIR analyzes relationships between threats, vulnerabilities, impacts and other elements to assess overall risk and evaluate mitigation options. The summary also notes that FAIR software from Aliado Accesso can be used to prioritize issues, compare mitigation costs/benefits, and support risk-informed decision making.
Risk Assessment And Mitigation Plan PowerPoint Presentation SlidesSlideTeam
This deck consists of total of thirty three slides. It has PPT slides highlighting important topics of Risk Assessment And Mitigation Plan Powerpoint Presentation Slides. This deck comprises of amazing visuals with thoroughly researched content. Each template is well crafted and designed by our PowerPoint experts. Our designers have included all the necessary PowerPoint layouts in this deck. From icons to graphs, this PPT deck has it all. The best part is that these templates are easily customizable. Just click the DOWNLOAD button shown below. Edit the colour, text, font size, add or delete the content as per the requirement. Download this deck now and engage your audience with this ready made presentation.
Risk Evaluation And Mitigation Strategies PowerPoint Presentation SlideSlideTeam
This document provides templates and frameworks for risk management, including risk evaluation, identification, analysis, response, mitigation, and tracking. It includes templates for a risk register, risk assessment charts, risk response matrices, and risk mitigation plans. The goal is to help identify potential risks, analyze their likelihood and impact, determine the appropriate risk response strategies, and continuously monitor and control risks.
Introduction to FAIR - Factor Analysis of Information RiskOsama Salah
FAIR (Factor Analysis of Information Risk) is a framework for measuring and analyzing information risk in a logical and quantitative way. It consists of (1) an ontology that defines the factors that contribute to risk and their relationships, (2) methods for measuring these factors, and (3) a computational model that calculates risk by simulating the relationships between measured factors. FAIR aims to provide an objective, evidence-based approach to risk analysis and avoid common pitfalls like inaccurate models, poor communication, and focus on worst-case scenarios. It measures factors like threat frequency, vulnerability, and loss magnitude on quantitative scales to determine overall risk.
Information Security Risk QuantificationJoel Baese
Overview presentation given at the 8/16/2016 Fayetteville, Arkansas ISACA chapter meeting discussing quantifying risk in the information security field.
Presenting this set of slides with name - Mitigation Planning Powerpoint Presentation Slides. Enhance your audiences knowledge with this well researched complete deck. Showcase all the important features of the deck with perfect visuals. This deck comprises of total of thirtytwo slides with each slide explained in detail. Each template comprises of professional diagrams and layouts. Our professional PowerPoint experts have also included icons, graphs and charts for your convenience. All you have to do is DOWNLOAD the deck. Make changes as per the requirement. Yes, these PPT slides are completely customizable. Edit the colour, text and font size. Add or delete the content from the slide. And leave your audience awestruck with the professionally designed Mitigation Planning Powerpoint Presentation Slides complete deck.
A plan to mitigate or eliminate risk is handled well with the use of Risk Mitigation Strategy PowerPoint Presentation Slides. All the steps planned well in advance for enhancing the opportunities and reducing threats needs a professionally crafted PPT layout. Each and every fundamental area of concern and disaster recovery plan needs time to compile the data in a sequential presentation graphic thus making life much more easy and manageable. Not only there is financial and strategic impact of risk but also the execution of plans becomes difficult therefore it’s always important to keep a record of market trends in PowerPoint template. Operations can be made more effective with classic risk management presentation slides as it addresses important and functional areas like avoiding, reducing, transferring and retaining or accepting. Contingent risks can also be avoided and still if they happen can be addressed with ease as all the data and growth trend is just a click away on the PPT slide Our Risk Mitigation Strategy Powerpoint Presentation Slides are ideal for any job. It even caters for impulsive ideas. https://bit.ly/3CGDNh1
An introduction to the Open FAIR standard, a framework for analyzing and express risk in financial terms. This presentation was originally given at the Louisville Metro InfoSec Conference on 9/19/17.
If you are looking for a perfect template to showcase your business approach towards identifying and managing risk, download our risk assessment strategies PowerPoint presentation slides. This Risk Assessment Strategies PPT template of risk assessment strategies allows you to review risk strategies, risk management plans and process, evaluate and judge risks based on tactics and developments. With the help if these PowerPoint slides, you can make your plans to manage risk. Use risk response matrix and charts to showcase how your business will mitigate risks and its response strategies. This risk estimation plan presentation slide permits you to implement risk assessment strategy at organizational level and enables its employees to discuss overall risks faced by an organization. This Risk Assessment Strategies presentation template will help you conduct risk evaluations in systematic method and you will be able to review your risks on regular basis. Effective risk management template has been crafted by our team of professionals so that you can prioritize risks, assign risk and make accountable business line for decision making. Establish brand consistency with our Risk Assessment Strategies PowerPoint Presentation Slides. Give an account of enduring achievements.
Economically driven Cyber Risk ManagementOsama Salah
Why we need to move away from qualitative risk management and embrace quantitative risk management.
Advocating for FAIR as a pragmatic quantitative risk analysis model.
Presented at MESCON 2018, Dubai
This document outlines a risk management module that describes the risk management lifecycle and procedures for managing risk. It discusses introducing risk management and identifying risk categories. It then covers the full procedure for managing risk, including planning, identification, assessment, monitoring, and tracking. It also addresses stakeholder engagement, including risk appetite and tolerance. Finally, it discusses tools and practices for risk analysis, impact analysis, risk mitigation strategies, and qualitative and quantitative analysis. The overall document provides an overview of a comprehensive risk management process.
This document provides an agenda for a crash course on managing cyber risk using quantitative analysis. It covers concepts like risk, uncertainty, and risk management approaches. It then discusses qualitative, semi-quantitative, and quantitative risk analysis methods. Monte Carlo simulation and PERT distributions are presented as tools for quantitative analysis. Exercises are provided to demonstrate applying these concepts, including estimating the risk associated with unencrypted laptops being lost or stolen.
Mitigation Plan PowerPoint Presentation SlidesSlideTeam
Select Mitigation Plan PowerPoint Presentation Slides to develop an action plan to mitigate business risk.. All the steps of risk management are well explained in this business presentation. Risk mitigation strategy PowerPoint complete deck comprises slides such as risk management plan, risk identification, risk register, risk assessment, risk analysis and response plan, risk response matrix, mitigation strategy, risk mitigation plan chart, risk control matrix, risk tracker, etc. The risk analysis PPT template helps you evaluate risk management plan and processes. With the help of PPT slide you can present your risk mitigation strategies. Risk control presentation slide allows you to execute risk assessment plan at organizational level. Additionally, this also goes well with the topics like risk mitigation planning, contingency plan, risk planning, mitigation strategy, hazards mitigation and many more. Download risk analysis PowerPoint template to conduct risk evaluation in a systematic manner. Identify the cause of a gridlock with our Mitigation Plan PowerPoint Presentation Slides. Come to grips with the deadlock.
Why Traditional Risk Management fails in the Oil+Gas Sectorjanknopfler
The document discusses risk management in oil and gas projects. It finds that traditional risk management often fails for such projects due to their unique challenges, including large scale, technology requirements, and sensitivity to market conditions. The highest rated risks for projects are found to be technological and scheduling, while for plant turnarounds the top risks relate to obtaining adequate resources. The document recommends establishing a common risk breakdown structure, holding cross-functional risk workshops, quantifying risks, using specialized risk management software, and clearly communicating high impact risks without mitigation plans.
Forecasting New Product Performance Like A MeteorologistAnanda Chakravarty
Forecasting new product performance and thinking about how to build relative product metrics - challenges and obstacles in forecasting, and what product managers need to keep in mind to build a real financial business case for new product development - includes initial steps for workshop development.
Risk Management Process And Procedures PowerPoint Presentation SlidesSlideTeam
The document outlines the risk management process and procedures for a company. It introduces risk management and identifies types of risk categories. It then describes the procedure for managing risks, which includes risk planning, identification, assessment, monitoring and tracking. Tools and practices for risk analysis are also covered, along with engaging stakeholders. The document closes with an overview of the risk management lifecycle.
This document discusses approaches to managing risk in information security. It introduces the concepts of risk and outlines a multifaceted approach that includes controlling risk, developing security policies, and maintaining user awareness and training. It then describes different methods for controlling, reducing, and calculating risk from technical, operational, and managerial perspectives. These include privilege management, change management, incident management, and using metrics like likelihood of risk, impact of risk, and mitigation of risk to analyze security risks. Maintaining security policies is also discussed as an important part of the risk management process.
Finsia, Innovations In Asset Allocation Presentations, Thursday 9 Junemattmcgilton
The document discusses innovations in asset allocation strategies for dynamic investment environments. It covers measuring and managing various types of investment risk, such as market risk, credit risk, liquidity risk, and counterparty risk. Effective risk management strategies discussed include diversification, hedging, stress testing portfolios, and matching portfolio characteristics to liabilities over time through techniques like duration matching. The document emphasizes the importance of understanding an investor's objectives and timeframe when constructing portfolios to meet those objectives while managing the relevant risks.
This document provides an overview of risk management concepts. It discusses the basic concepts of risk including hazards, harm, and risk magnitude. It also examines risk as a scientific method by matching it to the scientific method steps of observing phenomena, hypothesizing explanations, predicting consequences, and testing predictions. Finally, it reviews risk identification, assessment, and management processes and models including qualitative matrix models, probabilistic models, and index/scoring semi-quantitative models.
The document discusses how to conduct a risk assessment by identifying critical assets, threats, vulnerabilities, and risk levels. It explains assessing risk as the impact multiplied by the probability of a threat exploiting a vulnerability. The process also involves developing mitigation options, determining new risk levels, and getting client approval on the acceptable level of risk.
Risk management involves identifying risks, assessing their potential impact and probability of occurring, and developing strategies to mitigate negative impacts. Key aspects of risk management include identifying risks through techniques like brainstorming and documentation reviews, quantifying risks based on their probability and impact level, developing responses to reduce, transfer or avoid risks, and ongoing monitoring and control through audits, reviews and status reports. The overall goal is to minimize threats to a project's objectives of staying on schedule, within budget and meeting quality and performance goals.
In this presentation, Joe and Brian contrast traditional risk assessment with some emerging techniques that use internal and market risk event (incident) data to drive a more accurate risk model.
Presentation by:
Joe Crampton, VP – Applications, Resolver Inc.
Brian Link, CIA, VP – GRC Strategy & Partnerships, Resolver Inc.
This document summarizes a seminar on risk management and institutional risks. It discusses definitions of risk, types of positive and negative risks, how to identify risks within an organization, and roles of senior management in defining risk tolerance and appetite. Methods of risk assessment, evaluation, and modeling are presented. The document also introduces ISO 31000 principles and framework for risk management.
This document provides an overview of key concepts related to risk management, including definitions of risk, vulnerability, probability, and impact. It discusses approaches to assessing risk such as quantifying probability and impact, analyzing threats and vulnerabilities, and measuring the effectiveness of security controls. The document is authored by Phillip Banks and copyrighted by The Banks Group Inc., which provides risk consulting and security services. It references numerous standards and guidelines for risk and security management.
Risk Management Insight
FAIR
(FACTOR ANALYSIS OF INFORMATION RISK)
Basic Risk Assessment Guide
FAIR™ Basic Risk Assessment Guide
All Content Copyright Risk Management Insight, LLC
NOTE: Before using this assessment guide…
Using this guide effectively requires a solid understanding of FAIR concepts
‣ As with any high-level analysis method, results can depend upon variables that may not be accounted for at
this level of abstraction
‣ The loss magnitude scale described in this section is adjusted for a specific organizational size and risk
capacity. Labels used in the scale (e.g., “Severe”, “Low”, etc.) may need to be adjusted when analyzing
organizations of different sizes
‣ This process is a simplified, introductory version that may not be appropriate for some analyses
Basic FAIR analysis is comprised of ten steps in four stages:
Stage 1 – Identify scenario components
1. Identify the asset at risk
2. Identify the threat community under consideration
Stage 2 – Evaluate Loss Event Frequency (LEF)
3. Estimate the probable Threat Event Frequency (TEF)
4. Estimate the Threat Capability (TCap)
5. Estimate Control strength (CS)
6. Derive Vulnerability (Vuln)
7. Derive Loss Event Frequency (LEF)
Stage 3 – Evaluate Probable Loss Magnitude (PLM)
8. Estimate worst-case loss
9. Estimate probable loss
Stage 4 – Derive and articulate Risk
10. Derive and articulate Risk
Risk
Loss Event
Frequency
Probable Loss
Magnitude
Threat Event
Frequency
Vulnerability
Contact Action
Control
Strength
Threat
Capability
Primary Loss
Factors
Secondary
Loss Factors
Asset Loss
Factors
Threat Loss
Factors
Organizational
Loss Factors
External Loss
Factors
FAIR™ Basic Risk Assessment Guide
All Content Copyright Risk Management Insight, LLC
Stage 1 – Identify Scenario Components
Step 1 – Identify the Asset(s) at risk
In order to estimate the control and value characteristics within a risk analysis, the analyst must first identify the asset
(object) under evaluation. If a multilevel analysis is being performed, the analyst will need to identify and evaluate the
primary asset (object) at risk and all meta-objects that exist between the primary asset and the threat community. This
guide is intended for use in simple, single level risk analysis, and does not describe the additional steps required for a
multilevel analysis.
Asset(s) at risk: ______________________________________________________
Step 2 – Identify the Threat Community
In order to estimate Threat Event Frequency (TEF) and Threat Capability (TCap), a specific threat community must first be
identified. At minimum, when evaluating the risk associated with malicious acts, the analyst has to decide whether the
threat community is human or malware, and internal or external. In most circumstances, it’s appropriate to define the
threat community more specifically – e.g., network engineers, cleaning crew, etc., and characterize the e.
Semi-quantitative approach to risk analysisRiskTracer
This document discusses approaches to semi-quantitative risk analysis. It defines risk as potential negative consequences and opportunity as potential positive consequences. Scenarios are defined as chains of causal events. Risk and opportunity are modeled as sets of scenarios, probabilities, and consequences. Challenges include specifying scenarios, estimating probabilities which are prone to biases, and assessing consequences. Experts' judgments on likelihoods and consequences will vary and should be mapped to probability and impact scales. Histograms can show if judgments are unimodal or multimodal to determine if a group estimate is appropriate or more information is needed.
Risk Management Insight
FAIR
(FACTOR ANALYSIS OF INFORMATION RISK)
Basic Risk Assessment Guide
FAIR™ Basic Risk Assessment Guide
All Content Copyright Risk Management Insight, LLC
NOTE: Before using this assessment guide…
Using this guide effectively requires a solid understanding of FAIR concepts
‣ As with any high-level analysis method, results can depend upon variables that may not be accounted for at
this level of abstraction
‣ The loss magnitude scale described in this section is adjusted for a specific organizational size and risk
capacity. Labels used in the scale (e.g., “Severe”, “Low”, etc.) may need to be adjusted when analyzing
organizations of different sizes
‣ This process is a simplified, introductory version that may not be appropriate for some analyses
Basic FAIR analysis is comprised of ten steps in four stages:
Stage 1 – Identify scenario components
1. Identify the asset at risk
2. Identify the threat community under consideration
Stage 2 – Evaluate Loss Event Frequency (LEF)
3. Estimate the probable Threat Event Frequency (TEF)
4. Estimate the Threat Capability (TCap)
5. Estimate Control strength (CS)
6. Derive Vulnerability (Vuln)
7. Derive Loss Event Frequency (LEF)
Stage 3 – Evaluate Probable Loss Magnitude (PLM)
8. Estimate worst-case loss
9. Estimate probable loss
Stage 4 – Derive and articulate Risk
10. Derive and articulate Risk
Risk
Loss Event
Frequency
Probable Loss
Magnitude
Threat Event
Frequency
Vulnerability
Contact Action
Control
Strength
Threat
Capability
Primary Loss
Factors
Secondary
Loss Factors
Asset Loss
Factors
Threat Loss
Factors
Organizational
Loss Factors
External Loss
Factors
FAIR™ Basic Risk Assessment Guide
All Content Copyright Risk Management Insight, LLC
Stage 1 – Identify Scenario Components
Step 1 – Identify the Asset(s) at risk
In order to estimate the control and value characteristics within a risk analysis, the analyst must first identify the asset
(object) under evaluation. If a multilevel analysis is being performed, the analyst will need to identify and evaluate the
primary asset (object) at risk and all meta-objects that exist between the primary asset and the threat community. This
guide is intended for use in simple, single level risk analysis, and does not describe the additional steps required for a
multilevel analysis.
Asset(s) at risk: ______________________________________________________
Step 2 – Identify the Threat Community
In order to estimate Threat Event Frequency (TEF) and Threat Capability (TCap), a specific threat community must first be
identified. At minimum, when evaluating the risk associated with malicious acts, the analyst has to decide whether the
threat community is human or malware, and internal or external. In most circumstances, it’s appropriate to define the
threat community more specifically – e.g., network engineers, cleaning crew, etc., and characterize the e.
Risk Management Insight
FAIR
(FACTOR ANALYSIS OF INFORMATION RISK)
Basic Risk Assessment Guide
FAIR™ Basic Risk Assessment Guide
All Content Copyright Risk Management Insight, LLC
NOTE: Before using this assessment guide…
Using this guide effectively requires a solid understanding of FAIR concepts
‣ As with any high-level analysis method, results can depend upon variables that may not be accounted for at
this level of abstraction
‣ The loss magnitude scale described in this section is adjusted for a specific organizational size and risk
capacity. Labels used in the scale (e.g., “Severe”, “Low”, etc.) may need to be adjusted when analyzing
organizations of different sizes
‣ This process is a simplified, introductory version that may not be appropriate for some analyses
Basic FAIR analysis is comprised of ten steps in four stages:
Stage 1 – Identify scenario components
1. Identify the asset at risk
2. Identify the threat community under consideration
Stage 2 – Evaluate Loss Event Frequency (LEF)
3. Estimate the probable Threat Event Frequency (TEF)
4. Estimate the Threat Capability (TCap)
5. Estimate Control strength (CS)
6. Derive Vulnerability (Vuln)
7. Derive Loss Event Frequency (LEF)
Stage 3 – Evaluate Probable Loss Magnitude (PLM)
8. Estimate worst-case loss
9. Estimate probable loss
Stage 4 – Derive and articulate Risk
10. Derive and articulate Risk
Risk
Loss Event
Frequency
Probable Loss
Magnitude
Threat Event
Frequency
Vulnerability
Contact Action
Control
Strength
Threat
Capability
Primary Loss
Factors
Secondary
Loss Factors
Asset Loss
Factors
Threat Loss
Factors
Organizational
Loss Factors
External Loss
Factors
FAIR™ Basic Risk Assessment Guide
All Content Copyright Risk Management Insight, LLC
Stage 1 – Identify Scenario Components
Step 1 – Identify the Asset(s) at risk
In order to estimate the control and value characteristics within a risk analysis, the analyst must first identify the asset
(object) under evaluation. If a multilevel analysis is being performed, the analyst will need to identify and evaluate the
primary asset (object) at risk and all meta-objects that exist between the primary asset and the threat community. This
guide is intended for use in simple, single level risk analysis, and does not describe the additional steps required for a
multilevel analysis.
Asset(s) at risk: ______________________________________________________
Step 2 – Identify the Threat Community
In order to estimate Threat Event Frequency (TEF) and Threat Capability (TCap), a specific threat community must first be
identified. At minimum, when evaluating the risk associated with malicious acts, the analyst has to decide whether the
threat community is human or malware, and internal or external. In most circumstances, it’s appropriate to define the
threat community more specifically – e.g., network engineers, cleaning crew, etc., and characterize the ex.
Crafting a presentation on risk calculator within a limited time is not an easy task. To help you out, we have come up with a professional content ready risk calculator PowerPoint presentation slides. This risk management plan presentation comprises of 25 slides using which you can explain the concept of business risk identification and management in an ideal way. This risk calculator PPT presentation covers slide on a various topic like risk management plan, risk identification, risk analysis, risk impact analysis, risk impact, and probability analysis, qualitative risk analysis, quantitative hazard analysis, and hazard track. This hazard calculator PPT presentation comprises of amazing visuals with thoroughly researched content. Each template is well crafted and designed by our PowerPoint experts. Keeping our consumer needs in mind, we provide additional slides such as meet our team, puzzle, bulb or idea, location, Venn, sticky notes, lego, pie chart, stock chart, and stacked bar to make your PPT task simple. Download our risk calculator presentation slides and impress your audience. Interact closely with the audience through our Risk Calculator PowerPoint Presentation Slides. Be able to establish intimate connections.
This complete presentation has a set of thirty two slides to show your mastery of the subject. Use this ready-made PowerPoint presentation to present before your internal teams or the audience. All presentation designs in this Risk Analysis PowerPoint Presentation Slides have been crafted by our team of expert PowerPoint designers using the best of PPT templates, images, data-driven graphs and vector icons. The content has been well-researched by our team of business researchers. The biggest advantage of downloading this deck is that it is fully editable in PowerPoint. You can change the colors, font and text without any hassle to suit your business needs.
This document summarizes a presentation on cybersecurity risk management. It introduces key concepts such as assets, threats, vulnerabilities, impacts, likelihoods, controls, and risk assessment. It describes the process of identifying assets, threats, vulnerabilities and controls. It also discusses calculating risk scores and evaluating risks. The presentation emphasizes that risk management helps prioritize limited resources and is important for compliance.
This document discusses risk assessment techniques for projects. It describes qualitative and quantitative risk analysis. Qualitative risk analysis involves defining the probability and impact of risks using classes or scores, and organizing risks into a matrix. Quantitative risk analysis uses numerical techniques like expected monetary value analysis with decision trees to assign probabilities and impacts to risks. The document outlines strategies for responding to risks like avoiding, transferring, mitigating, exploiting, and accepting risks. The goal of risk assessment is to prioritize and manage project risks.
This document discusses risk assessment and job safety analysis (JSA) for construction projects. It provides definitions and processes for identifying hazards, assessing risks, and analyzing jobs to reduce accidents. Key points include:
- Major construction accidents are often due to lack of knowledge about job steps, hazards, and controls. JSA covers this gap by training workers.
- JSA shall be conducted for critical, non-routine, permit-to-work, and routine tasks. It breaks jobs into detailed safe procedures.
- Risk assessment identifies hazards and evaluates risks to prevent injuries. It is done proactively through risk assessments and reactively through accident investigations.
- The risk assessment process involves identifying hazards and people
The document provides information on risk assessment, job safety analysis (JSA), and how to conduct them properly. It discusses that the majority of construction accidents are due to lack of knowledge about job hazards and controls. JSA covers this gap by training workers on each job task and how to perform it safely. It outlines the steps to conduct a JSA, including selecting a job, breaking it into steps, identifying hazards for each step, developing controls, and monitoring. The benefits of JSA include improved safety understanding and ensuring written work methods for all jobs.
Sample Hazard Profile/Hazard Analysis Worksheet
Hazard: _______________________________________________________________
Location: ______________________________________________________________
Threat
Frequency/probability of Occurrence:
· 4 - Highly likely (Near 100% probability in the next year)
· 3 - Likely (Between 10% and 100% probability in the next year, or at least one chance in the next 10 years)
· 2- Possible (Between 1% and 10% probability in the next year, or at least one chance in the next 100 years)
· 1 - Unlikely (Less than 1% probability in the next 100 years)
· 0 - No chance
Seasonal pattern or calendar link?
· No
· Yes. Specify season(s) or dates when hazard occurs: _____________________________________________________________
Include historic occurrences information.
Probable duration:
Potential Speed of Onset:
· Minimal or no notice
· 6 to 12 hours notice
· 12 to 24 hours notice
· More than 24 hours notice
Available warning mechanisms:
Consequences & Impacts
Potential impact on human health & safety:
· 4 - Catastrophic (Possibility for multiple deaths)
· 3- Critical (Injuries or illness resulting in permanent disability)
· 2 - Limited (Temporary injuries)
· 1 - Negligible (Injuries treatable with first aid)
Include information available from historic occurrences or other credible estimates.
Potential impact on property and infrastructure:
· 4 - Catastrophic (Shutdown of critical facilities for 1 month or more; more than 50% of property severely damaged)
· 3 - Critical (Shutdown of critical facilities for at least 2 weeks; 25% to 50% of property severely damaged)
· 2- Limited (Shutdown of critical facilities for 1-2 weeks; 10% to 25% of property severely damaged)
· 1 - Negligible (Shutdown of critical facilities for 24 hours or less; less than 10% of property severely damaged)
Include information available from historic occurrences or other credible estimates.
What are potential impacts on the environment and/or agriculture?
Include information available from historic occurrences or other credible estimates.
Potential impact on continuity of operations:
· 4 - Catastrophic(moderate- to long-term (36 hours and longer) impacts on essential functions)
· 3 - Critical(moderate-term (12-36 hour) impacts on multiple essential functions and/or longer-term impacts on all functions)
· 2 - Limited (moderate-term (12-36 hour) impacts on some functions and/or shorter-term impacts on small number of essential functions)
· 1 - Negligible (short-term (less than 12 hours) impacts on some functions
Include information available from historic occurrences or other credible estimates.
Hazard Analysis Worksheet (continued)
Potential for cascading or secondary effects?
· No
· Yes. Specify effects:
Describe historic examples or estimates, if available.
Vulnerability
Are there particular locations or areas of the city that are more vulnerable to this hazard.
Role of Data Science in ERM @ Nashville Analytics Summit Sep 2014John Liu
An overview of how organizations can leverage data science and predictive analytics to improve enterprise risk management. Applications for risk identification, mitigation and management will be discussed, as well as methods to facilitate strategic integration across an organization.
The Role of Data Science in Enterprise Risk Management, Presented by John LiuNashvilleTechCouncil
Enterprise risk management (ERM) uses a holistic approach to identify, assess, and manage risks across an organization. Data science can enhance ERM by providing comprehensive data management, predictive risk analytics through techniques like modeling loss distributions, and real-time risk reporting dashboards. While ERM traditionally relied on closed-form solutions and historical data, modern approaches use data analytics like machine learning models to better predict outliers and risks with limited data.
The document compares the operational complexity and costs of the Space Shuttle versus the Sea Launch Zenit rocket. [1] The Space Shuttle was designed for performance but not operational efficiency, resulting in costly ground, mission planning, and flight operations. [2] In contrast, the Zenit rocket was designed from the start to have automated and robust processes to keep operations simple and costs low. [3] The key lesson is that designing a launch system with operational requirements in mind from the beginning leads to much more efficient operations long-term.
The document provides an overview of project management and procurement at NASA. It discusses the key skills required for project managers, including acquisition management. It notes that 80-85% of NASA's budget is spent on contracts, and procurement processes are complex and constantly changing. The document outlines some common contract types and how they allocate risk between the government and contractor. It also discusses the relationship between contracting officers and project managers, and how successful procurement requires effective communication rather than direct control or authority.
The document introduces the NASA Engineering Network (NEN), which was created by the Office of the Chief Engineer to be a knowledge management system connecting NASA's engineering community. The NEN integrates various tools like a content management system, search engine, and collaboration tools. It provides access to key knowledge resources like NASA's Lessons Learned database and engineering databases. The NEN is working to expand by adding more communities, engineering disciplines, and knowledge repositories.
Laptops were first used in space in 1983 on the Space Shuttle, when Commander John Young brought the GRiD Compass portable computer on STS-9. Laptops are now widely used on the Space Shuttle and International Space Station for tasks like monitoring spacecraft systems, tracking satellites, inventory management, procedures viewing, and videoconferencing. Managing laptops in space presents challenges around cooling, power, and software/hardware compatibility in the harsh space environment.
Laptops were first used in space in 1983 on the Space Shuttle, when Commander John Young brought the GRiD Compass portable computer on STS-9. Laptops are now widely used on the Space Shuttle and International Space Station for tasks like monitoring spacecraft systems, planning rendezvous and proximity operations, inventory management, procedure reviews, and communication between space and ground via software like WorldMap and DOUG. Managing laptops in space presents challenges around hardware durability, cooling, and software/data management in the space environment.
This document discusses the use of market-based systems to allocate scarce resources for NASA missions and projects. It provides examples of how market-based approaches were used for instrument development for the Cassini mission, manifesting secondary payloads on the space shuttle, and mission planning for the LightSAR Earth imaging satellite project. The document finds that these applications of market-based allocation benefited or could have benefited from a decentralized, incentive-based approach compared to traditional centralized planning methods. However, it notes that resistance to new approaches and loss of managerial control are barriers to adoption of market-based systems.
The Stardust mission collected samples from comet Wild 2 and interstellar dust particles. It launched in February 1999 and encountered Wild 2 in January 2004, collecting dust samples in aerogel. It returned the samples to Earth safely in January 2006. The spacecraft used an innovative Whipple shield to protect itself from comet dust impacts during the encounter. Analysis of the Stardust samples has provided insights about comet composition and the early solar system.
This document discusses solutions for integrating schedules on NASA programs. It introduces Stuart Trahan's company, which provides Earned Value Management (EVM) solutions using Microsoft Office Project that comply with OMB and ANSI requirements. It also introduces a partner company, Pinnacle Management Systems, that specializes in enterprise project management solutions including EVM, project portfolio management, and enterprise project resource management, with experience in the aerospace, defense, and other industries. The document defines schedule integration and describes some methods including importing to a centralized Primavera database for review or using Primavera ProjectLink for updates, and challenges including inconsistent data formats and levels of detail across sub-schedules.
The document discusses NASA's implementation of earned value management (EVM) across its Constellation Program to coordinate work across multiple teams. It outlines the organizational structure, current target groups, and an EVM training suite. It also summarizes lessons learned and the need for project/center collaboration to integrate schedules horizontally and vertically.
This document summarizes a presentation about systems engineering processes for principle investigator (PI) mode missions. It discusses how PI missions face special challenges due to cost caps and lower technology readiness levels. It then outlines various systems engineering techniques used for PI missions, including safety compliance, organizational communication, design tools, requirements management, and lessons learned from past missions. Specific case studies from NASA's Explorers Program Office are provided as examples.
This document discusses changes to NASA's business practices for managing projects, including adopting a new acquisition strategy approach and implementing planning, programming, and budget execution (PPBE). The new acquisition strategy involves additional approval meetings at the strategic planning and project levels to better integrate acquisition with strategic and budgetary planning. PPBE focuses on analyzing programs and infrastructure to align with strategic goals and answer whether proposed programs will help achieve NASA's mission. The document also notes improvements in funds distribution and inter-center transfers, reducing the time for these processes from several weeks to only a few days.
Spaceflight Project Security: Terrestrial and On-Orbit/Mission
The document discusses security challenges for spaceflight projects, including protecting space assets from disruption, exploitation, or attack. It highlights national space policy principles of protecting space capabilities. It also discusses trends in cyber threats, including the increasing capabilities of adversaries and how even unskilled attackers can compromise terrestrial support systems linked to space assets if defenses are not strong. Protecting space projects requires awareness of threats, vulnerabilities, and strategies to defend, restore, and increase situational awareness of space assets and supporting systems.
Humor can positively impact many aspects of project management. It can improve communication, aid in team building, help detect team morale issues, and influence leadership, conflict management, negotiation, motivation, and problem solving. While humor has benefits, it also has risks and not all uses of humor are positive. Future research is needed on humor in multicultural teams, its relationship to team performance, how humor is learned, and determining optimal "doses" of humor. In conclusion, humor is a tool that can influence people and projects, but must be used carefully and spontaneously for best effect.
The recovery of Space Shuttle Columbia after its loss in 2003 involved a massive multi-agency effort to search a wide debris field, recover crew remains and evidence, and compensate local communities. Over 25,000 people searched over 680,000 acres, recovering 38% of Columbia's weight. Extensive engineering investigations were conducted to identify the causes of failure and implement changes to allow the safe return to flight of Discovery in 2005.
This document summarizes research on enhancing safety culture at NASA. It describes a survey developed to assess NASA's safety culture based on principles of high reliability organizations. The survey was tailored specifically for NASA and has been implemented to provide feedback and identify areas for improvement. It allows NASA to benchmark its safety culture within and across other industries pursuing high reliability.
This document summarizes a presentation about project management challenges at NASA Goddard Space Flight Center. The presentation outlines a vision for anomaly management, including establishing consistent problem reporting and analysis processes across all missions. It describes the current problem management approach, which lacks centralized information sharing. The presentation aims to close this gap by implementing online problem reporting and trend analysis tools to extract lessons learned across missions over time. This will help improve spacecraft design and operations based on ongoing anomaly experiences.
This document discusses leveraging scheduling productivity with practical scheduling techniques. It addresses scheduling issues such as unwieldy schedule databases and faulty logic. It then discusses taming the schedule beast through using a scheduler's toolkit, schedule templates, codes to manipulate MS Project data, common views/filters/tables, limiting constraints, and other best practices. The document provides examples of using codes and custom views/filters to effectively organize and display schedule information.
This document describes Ball Aerospace's implementation of a Life Cycle and Gated Milestone (LCGM) process to improve program planning, execution, and control across its diverse portfolio. The LCGM provides a standardized yet flexible framework that maps out program activities and products across phases. It was developed through cross-functional collaboration and introduced gradually across programs while allowing flexibility. Initial results showed the LCGM supported improved planning and management while aligning with Ball Aerospace's entrepreneurial culture.
This document discusses the importance of situation awareness (SA) for project team members. It defines SA as having three levels: perception of elements in the current situation, comprehension of the current situation, and projection of the future status. Good team SA is achieved by turning individual SAs into shared SA through communication. Teams with strong SA prepare more, focus on comprehending and projecting, and maintain awareness through techniques like questioning assumptions and seeking additional information.
This document discusses theories of leadership and how a project manager's leadership style may impact project success depending on the type of project. It outlines early hypotheses that a PM's competence, including leadership style, is a success factor on projects. It presents a research model linking PM leadership competencies to project success, moderated by factors like project type. Initial interviews found that leadership style is more important on complex projects, and different competencies are needed depending on if a project is technical or involves change. Certain competencies like communication skills and cultural sensitivity were seen as important for different project types and contexts.
leewayhertz.com-AI in predictive maintenance Use cases technologies benefits ...alexjohnson7307
Predictive maintenance is a proactive approach that anticipates equipment failures before they happen. At the forefront of this innovative strategy is Artificial Intelligence (AI), which brings unprecedented precision and efficiency. AI in predictive maintenance is transforming industries by reducing downtime, minimizing costs, and enhancing productivity.
Ivanti’s Patch Tuesday breakdown goes beyond patching your applications and brings you the intelligence and guidance needed to prioritize where to focus your attention first. Catch early analysis on our Ivanti blog, then join industry expert Chris Goettl for the Patch Tuesday Webinar Event. There we’ll do a deep dive into each of the bulletins and give guidance on the risks associated with the newly-identified vulnerabilities.
Main news related to the CCS TSI 2023 (2023/1695)Jakub Marek
An English 🇬🇧 translation of a presentation to the speech I gave about the main changes brought by CCS TSI 2023 at the biggest Czech conference on Communications and signalling systems on Railways, which was held in Clarion Hotel Olomouc from 7th to 9th November 2023 (konferenceszt.cz). Attended by around 500 participants and 200 on-line followers.
The original Czech 🇨🇿 version of the presentation can be found here: https://www.slideshare.net/slideshow/hlavni-novinky-souvisejici-s-ccs-tsi-2023-2023-1695/269688092 .
The videorecording (in Czech) from the presentation is available here: https://youtu.be/WzjJWm4IyPk?si=SImb06tuXGb30BEH .
Trusted Execution Environment for Decentralized Process MiningLucaBarbaro3
Presentation of the paper "Trusted Execution Environment for Decentralized Process Mining" given during the CAiSE 2024 Conference in Cyprus on June 7, 2024.
Ocean lotus Threat actors project by John Sitima 2024 (1).pptxSitimaJohn
Ocean Lotus cyber threat actors represent a sophisticated, persistent, and politically motivated group that poses a significant risk to organizations and individuals in the Southeast Asian region. Their continuous evolution and adaptability underscore the need for robust cybersecurity measures and international cooperation to identify and mitigate the threats posed by such advanced persistent threat groups.
HCL Notes und Domino Lizenzkostenreduzierung in der Welt von DLAUpanagenda
Webinar Recording: https://www.panagenda.com/webinars/hcl-notes-und-domino-lizenzkostenreduzierung-in-der-welt-von-dlau/
DLAU und die Lizenzen nach dem CCB- und CCX-Modell sind für viele in der HCL-Community seit letztem Jahr ein heißes Thema. Als Notes- oder Domino-Kunde haben Sie vielleicht mit unerwartet hohen Benutzerzahlen und Lizenzgebühren zu kämpfen. Sie fragen sich vielleicht, wie diese neue Art der Lizenzierung funktioniert und welchen Nutzen sie Ihnen bringt. Vor allem wollen Sie sicherlich Ihr Budget einhalten und Kosten sparen, wo immer möglich. Das verstehen wir und wir möchten Ihnen dabei helfen!
Wir erklären Ihnen, wie Sie häufige Konfigurationsprobleme lösen können, die dazu führen können, dass mehr Benutzer gezählt werden als nötig, und wie Sie überflüssige oder ungenutzte Konten identifizieren und entfernen können, um Geld zu sparen. Es gibt auch einige Ansätze, die zu unnötigen Ausgaben führen können, z. B. wenn ein Personendokument anstelle eines Mail-Ins für geteilte Mailboxen verwendet wird. Wir zeigen Ihnen solche Fälle und deren Lösungen. Und natürlich erklären wir Ihnen das neue Lizenzmodell.
Nehmen Sie an diesem Webinar teil, bei dem HCL-Ambassador Marc Thomas und Gastredner Franz Walder Ihnen diese neue Welt näherbringen. Es vermittelt Ihnen die Tools und das Know-how, um den Überblick zu bewahren. Sie werden in der Lage sein, Ihre Kosten durch eine optimierte Domino-Konfiguration zu reduzieren und auch in Zukunft gering zu halten.
Diese Themen werden behandelt
- Reduzierung der Lizenzkosten durch Auffinden und Beheben von Fehlkonfigurationen und überflüssigen Konten
- Wie funktionieren CCB- und CCX-Lizenzen wirklich?
- Verstehen des DLAU-Tools und wie man es am besten nutzt
- Tipps für häufige Problembereiche, wie z. B. Team-Postfächer, Funktions-/Testbenutzer usw.
- Praxisbeispiele und Best Practices zum sofortigen Umsetzen
This presentation provides valuable insights into effective cost-saving techniques on AWS. Learn how to optimize your AWS resources by rightsizing, increasing elasticity, picking the right storage class, and choosing the best pricing model. Additionally, discover essential governance mechanisms to ensure continuous cost efficiency. Whether you are new to AWS or an experienced user, this presentation provides clear and practical tips to help you reduce your cloud costs and get the most out of your budget.
Taking AI to the Next Level in Manufacturing.pdfssuserfac0301
Read Taking AI to the Next Level in Manufacturing to gain insights on AI adoption in the manufacturing industry, such as:
1. How quickly AI is being implemented in manufacturing.
2. Which barriers stand in the way of AI adoption.
3. How data quality and governance form the backbone of AI.
4. Organizational processes and structures that may inhibit effective AI adoption.
6. Ideas and approaches to help build your organization's AI strategy.
Your One-Stop Shop for Python Success: Top 10 US Python Development Providersakankshawande
Simplify your search for a reliable Python development partner! This list presents the top 10 trusted US providers offering comprehensive Python development services, ensuring your project's success from conception to completion.
Monitoring and Managing Anomaly Detection on OpenShift.pdfTosin Akinosho
Monitoring and Managing Anomaly Detection on OpenShift
Overview
Dive into the world of anomaly detection on edge devices with our comprehensive hands-on tutorial. This SlideShare presentation will guide you through the entire process, from data collection and model training to edge deployment and real-time monitoring. Perfect for those looking to implement robust anomaly detection systems on resource-constrained IoT/edge devices.
Key Topics Covered
1. Introduction to Anomaly Detection
- Understand the fundamentals of anomaly detection and its importance in identifying unusual behavior or failures in systems.
2. Understanding Edge (IoT)
- Learn about edge computing and IoT, and how they enable real-time data processing and decision-making at the source.
3. What is ArgoCD?
- Discover ArgoCD, a declarative, GitOps continuous delivery tool for Kubernetes, and its role in deploying applications on edge devices.
4. Deployment Using ArgoCD for Edge Devices
- Step-by-step guide on deploying anomaly detection models on edge devices using ArgoCD.
5. Introduction to Apache Kafka and S3
- Explore Apache Kafka for real-time data streaming and Amazon S3 for scalable storage solutions.
6. Viewing Kafka Messages in the Data Lake
- Learn how to view and analyze Kafka messages stored in a data lake for better insights.
7. What is Prometheus?
- Get to know Prometheus, an open-source monitoring and alerting toolkit, and its application in monitoring edge devices.
8. Monitoring Application Metrics with Prometheus
- Detailed instructions on setting up Prometheus to monitor the performance and health of your anomaly detection system.
9. What is Camel K?
- Introduction to Camel K, a lightweight integration framework built on Apache Camel, designed for Kubernetes.
10. Configuring Camel K Integrations for Data Pipelines
- Learn how to configure Camel K for seamless data pipeline integrations in your anomaly detection workflow.
11. What is a Jupyter Notebook?
- Overview of Jupyter Notebooks, an open-source web application for creating and sharing documents with live code, equations, visualizations, and narrative text.
12. Jupyter Notebooks with Code Examples
- Hands-on examples and code snippets in Jupyter Notebooks to help you implement and test anomaly detection models.
5th LF Energy Power Grid Model Meet-up SlidesDanBrown980551
5th Power Grid Model Meet-up
It is with great pleasure that we extend to you an invitation to the 5th Power Grid Model Meet-up, scheduled for 6th June 2024. This event will adopt a hybrid format, allowing participants to join us either through an online Mircosoft Teams session or in person at TU/e located at Den Dolech 2, Eindhoven, Netherlands. The meet-up will be hosted by Eindhoven University of Technology (TU/e), a research university specializing in engineering science & technology.
Power Grid Model
The global energy transition is placing new and unprecedented demands on Distribution System Operators (DSOs). Alongside upgrades to grid capacity, processes such as digitization, capacity optimization, and congestion management are becoming vital for delivering reliable services.
Power Grid Model is an open source project from Linux Foundation Energy and provides a calculation engine that is increasingly essential for DSOs. It offers a standards-based foundation enabling real-time power systems analysis, simulations of electrical power grids, and sophisticated what-if analysis. In addition, it enables in-depth studies and analysis of the electrical power grid’s behavior and performance. This comprehensive model incorporates essential factors such as power generation capacity, electrical losses, voltage levels, power flows, and system stability.
Power Grid Model is currently being applied in a wide variety of use cases, including grid planning, expansion, reliability, and congestion studies. It can also help in analyzing the impact of renewable energy integration, assessing the effects of disturbances or faults, and developing strategies for grid control and optimization.
What to expect
For the upcoming meetup we are organizing, we have an exciting lineup of activities planned:
-Insightful presentations covering two practical applications of the Power Grid Model.
-An update on the latest advancements in Power Grid -Model technology during the first and second quarters of 2024.
-An interactive brainstorming session to discuss and propose new feature requests.
-An opportunity to connect with fellow Power Grid Model enthusiasts and users.
Digital Marketing Trends in 2024 | Guide for Staying AheadWask
https://www.wask.co/ebooks/digital-marketing-trends-in-2024
Feeling lost in the digital marketing whirlwind of 2024? Technology is changing, consumer habits are evolving, and staying ahead of the curve feels like a never-ending pursuit. This e-book is your compass. Dive into actionable insights to handle the complexities of modern marketing. From hyper-personalization to the power of user-generated content, learn how to build long-term relationships with your audience and unlock the secrets to success in the ever-shifting digital landscape.
Dive into the realm of operating systems (OS) with Pravash Chandra Das, a seasoned Digital Forensic Analyst, as your guide. 🚀 This comprehensive presentation illuminates the core concepts, types, and evolution of OS, essential for understanding modern computing landscapes.
Beginning with the foundational definition, Das clarifies the pivotal role of OS as system software orchestrating hardware resources, software applications, and user interactions. Through succinct descriptions, he delineates the diverse types of OS, from single-user, single-task environments like early MS-DOS iterations, to multi-user, multi-tasking systems exemplified by modern Linux distributions.
Crucial components like the kernel and shell are dissected, highlighting their indispensable functions in resource management and user interface interaction. Das elucidates how the kernel acts as the central nervous system, orchestrating process scheduling, memory allocation, and device management. Meanwhile, the shell serves as the gateway for user commands, bridging the gap between human input and machine execution. 💻
The narrative then shifts to a captivating exploration of prominent desktop OSs, Windows, macOS, and Linux. Windows, with its globally ubiquitous presence and user-friendly interface, emerges as a cornerstone in personal computing history. macOS, lauded for its sleek design and seamless integration with Apple's ecosystem, stands as a beacon of stability and creativity. Linux, an open-source marvel, offers unparalleled flexibility and security, revolutionizing the computing landscape. 🖥️
Moving to the realm of mobile devices, Das unravels the dominance of Android and iOS. Android's open-source ethos fosters a vibrant ecosystem of customization and innovation, while iOS boasts a seamless user experience and robust security infrastructure. Meanwhile, discontinued platforms like Symbian and Palm OS evoke nostalgia for their pioneering roles in the smartphone revolution.
The journey concludes with a reflection on the ever-evolving landscape of OS, underscored by the emergence of real-time operating systems (RTOS) and the persistent quest for innovation and efficiency. As technology continues to shape our world, understanding the foundations and evolution of operating systems remains paramount. Join Pravash Chandra Das on this illuminating journey through the heart of computing. 🌟
GraphRAG for Life Science to increase LLM accuracyTomaz Bratanic
GraphRAG for life science domain, where you retriever information from biomedical knowledge graphs using LLMs to increase the accuracy and performance of generated answers
TrustArc Webinar - 2024 Global Privacy SurveyTrustArc
How does your privacy program stack up against your peers? What challenges are privacy teams tackling and prioritizing in 2024?
In the fifth annual Global Privacy Benchmarks Survey, we asked over 1,800 global privacy professionals and business executives to share their perspectives on the current state of privacy inside and outside of their organizations. This year’s report focused on emerging areas of importance for privacy and compliance professionals, including considerations and implications of Artificial Intelligence (AI) technologies, building brand trust, and different approaches for achieving higher privacy competence scores.
See how organizational priorities and strategic approaches to data security and privacy are evolving around the globe.
This webinar will review:
- The top 10 privacy insights from the fifth annual Global Privacy Benchmarks Survey
- The top challenges for privacy leaders, practitioners, and organizations in 2024
- Key themes to consider in developing and maintaining your privacy program
1. Risk is Risk, Right?
PM Challenge 2007
Joshua Krage
NASA Goddard Space Flight Center
Greenbelt, MD
2. Agenda
• Review of risk assessment processes
– Equations
– Likelihood
– Impact
– Human impact
• Review of risk dialects
– Management of programs and projects
– Engineering efforts
– Security concerns
• Final comparisons and recommendations
February 2007 Risk is Risk, Right? 2
3. What is Risk?
• We deal with risk every day
– Each of us has an instinctual understanding of how to discern “day-to-day” risk, and
avoid too much of it
• But… do we:
– mean the same thing?
– make the same assessments?
– manage the same risk?
• Definition:
(noun)
1: a situation involving exposure to danger.
2: the possibility that something unpleasant will happen.
3: a person or thing causing a risk or regarded in relation to risk
(Compact Oxford English Dictionary, www.askoxford.com)
February 2007 Risk is Risk, Right? 3
4. Many Risk Disciplines
• Many disciplines use risk and risk assessment language
– Psychology (decision theory)
– Statistics
– Financial institutions
– Scenario analysis
• While fascinating, these are (mostly) out of scope for
today’s discussion
• Today we focus on management, engineering, and
security risk
February 2007 Risk is Risk, Right? 4
5. Risk Equations
The various risk disciplines distill a complex process into a easy-to-
remember equation, with slight variances in approach and language.
Source Risk Equation
ISO17666:2003 Likelihood x Severity = Risk
NIST SP800-30 Likelihood x Impact = Risk
NASA NPR8000.4 Likelihood x Consequences = Risk
Probabilistic Risk Assessment Probability(of Event) x Consequence = Risk
Security Risk P(threat) x P(vulnerability) x Impact = Risk
P(threat) x P(vulnerability) x Cost = Risk
Engineering & Safety Risk P(accident) x LossesPerAccident = Risk
The commonality in these equations supports thinking of risk
assessment as a uniform process.
February 2007 Risk is Risk, Right? 5
6. Picking Apart Likelihood
• Likelihood is usually measured in terms of probability
– The probability a particular outcome will be achieved
• Ex. 98% chance the audience understands this
– Generally considered an objective measurement
– Can be derived mathematically (through proofs) or experientially
• Challenges:
– Basic probability assumes all outcomes are equal
• Ex. Flipping a coin yields either heads or tails
– True probability allows for some uncertainty
• Ex. It is statistically improbable for the coin to land on its edge; or even not to land
– Requires data from outcomes of similar situations
• The longer the baseline, the better the data
– Experiential data is generally time-bound
• Ex. Flood of the century
– If other techniques are not sufficient, then one is left with estimates and judgement calls
February 2007 Risk is Risk, Right? 6
7. Picking Apart Threats & Vulnerabilities
• Some risk assessment techniques (e.g. security) split likelihood
into threats and vulnerabilities
– Vulnerability indicates a weakness in a specific area or function, which if exploited will cause
impact
– Threat indicates the source or actor which can exploit the vulnerability
– If neither a threat nor a vulnerability exist, then no risk
– Usually have the most control over vulnerabilities, not threats
• Examples of threats (exploits) and vulnerabilities:
– Sick birds can infect healthy but non-immunized birds
– Wind can generate un-dampened oscillations in an overly fluid bridge
– Continuing resolutions will delay new work in the US Federal Government
– A cracker will break into a misconfigured database to steal credit card numbers
February 2007 Risk is Risk, Right? 7
8. Picking Apart Impact
• Impact has many measuring systems
– Cost is the most common objective measurement
– Many impacts are intangible
• Ex. Reputation/image, politics, copying intellectual property, etc.
• These are measured subjectively: mild, moderate, severe, catastrophic
– Typically rated in terms of Confidentiality, Integrity, and Availability
• Challenges:
– Accurate cost impact assessments require a sufficient level of cost data
– Intangible impacts depend on a subjective assessment
• Frequently inconsistent among reviewers
• Breaches of confidentiality and integrity are typically the most challenging to assess
February 2007 Risk is Risk, Right? 8
9. Exhibit: 5x5 Risk Matrix in Four Areas
Safety Technical Cost/Schedule
Likelihood (Likelihood of safety (Estimated Likelihood of not meeting mission (Estimated Likelihood of not meeting allocated
event occurrences) technical performance requirements) Cost/Schedule requirement or margin)
Bins
5
5 Very High (PS > 10-1) (PT > 50%) (PCS > 75%)
Likelihood
4
4 High (10-2 < PS < 10-1) (25% < PT < 50%) (50% < PCS ≤ 75%)
3
3 Moderate (10-3 < PS < 10-2) (15% < PT < 25%) (25% < PCS ≤ 50%)
2
2 Low (10-6 < PS < 10-3) (2% < PT < 15%) (10% < PCS ≤ 25%)
1
1 2 3 4 5
1 Very Low (PS < 10-6) (0.1% <PT < 2%) (PCS ≤ 10%)
Consequence
Consequence Categories
Risk Type 1 Very Low 2 Low 3 Moderate 4 High 5 Very High
Negligible or No impact. Could cause the need for only May cause minor injury or May cause severe injury or May cause death or permanently
minor first aid treatment . occupational illness or minor occupational illness or major disabling injury or destruction of
Safety property damage. property damage. property.
No impact to full mission Minor impact to full mission Moderate impact to full mission Major impact to full mission Minimum mission success criteria
success criteria success criteria success criteria. Minimum success criteria. Minimum is not achievable HIGH RISKS
Technical mission success criteria is mission success criteria is
achievable with margin achievable
MODERATE RISKS
Negligible or no schedule Minor impact to schedule Impact to schedule milestones; Major impact to schedule Cannot meet schedule and program
impact milestones; accommodates accommodates within reserves; milestones; major impact to milestones
Schedule within reserves; no impact to moderate impact to critical path critical path LOW RISKS
critical path
<2% increase over Between 2% and 5% increase Between 5% and 7% increase Between 7% and 10% increase >10% increase over allocated,
allocated and negligible over allocated and can handle over allocated and can not handle over allocated, and/or exceeds and/or can’t handle with reserves
Cost impact on reserve with reserve with reserve proper reserves
February 2007 Risk is Risk, Right? 9
10. Human Factors
• The brain does funny things with risk
– Humans have a tendency to subconsciously ignore or downplay the “edge” risks
(implicit acceptance)
• Extreme impact: don’t think about it
• Low impact: not a big deal
• High likelihood: what can you do?
• Low likelihood: will never happen
• Low occurrence rate with low impact: not a big deal
– Subjective assessments allow the brain to insert its bias and can skew results
• Mitigations:
– Use objective assessments as a baseline where possible
– Use peer reviews with common definitions to validate results
February 2007 Risk is Risk, Right? 10
11. Reviewing the Bidding
• Many disciplines, but a common terminology
– Risk = Likelihood x Impact (Threat & Vulnerability)
• Likelihood
– Typically presented in mathematical probability terms
– Frequently includes some estimation or judgement call
• Impact
– Very subjective
– Varying units of measure
• If not controlled, humans can skew assessments
• Varied results are common, despite common language
and approach
February 2007 Risk is Risk, Right? 11
12. Risk Management
• Four classic strategies to handle risk:
– Accept
• Do nothing
– Eliminate
• Force likelihood (or threat or vulnerability) OR impact to zero
– Mitigate
• Do something to limit the likelihood or reduce the impact, but not completely
– Transfer
• Assign someone else the acceptance of the risk, usually through insurance
• Risk ignorance is equivalent to implicit risk acceptance
February 2007 Risk is Risk, Right? 12
13. Management Risk
• Project risk focuses primarily on schedule and
resources (people, equipment, locations, money)
– Good project managers consider the other areas as well, but the expectations set for
the project manager are based in management risk
– New issues (nascent risks) are tracked with increasing measurements
– Lack of change or action is equal to lack of changing risk (controlled variables)
– Risks tend to be eliminated or accepted, sometimes mitigated, rarely transferred
– Politics plays a frequent (undocumented) role
• Managerial decisions define the overall project’s risk
management strategy
– Drives all other risk areas
– Can override technical concerns (appropriately)
– Generally provides the most flexibility to the project
February 2007 Risk is Risk, Right? 13
14. Engineering Risk
• Engineering risk has its base in applied technology
– Pushing the envelope of technology is a common goal of engineering risk
– Given enough freedom, engineers can address most challenges successfully
– Engineering is a critical component to mission success -- it cannot be ignored
– Impact is usually that something breaks or progress down a path is stopped
– Extensive materials and methods baselines are available
• Aggressive testing can help develop or extend the baseline, even into conditions
outside of “normal”
• Partial matches to existing baselines can be extrapolated with low uncertainty
– Not all risks can be mitigated; some have to be accepted
• Ex. Comet hits deep space probe
– Risks to others (safety) exist, but can usually be quantified
– Risks are frequently mitigated or eliminated, sometimes accepted, and rarely
transferred
February 2007 Risk is Risk, Right? 14
15. Security Risk
• Security risks (both physical and information) are
generally about people and only sometimes about
technology
– Security protects and enables the project (or it is supposed to, anyway)
– Security should be considered across the project, but is frequently underutilized
– Good security staff are creatively paranoid; they expect the unexpected
– Mitigations or eliminations are almost always possible, given sufficient resources
• Various points of diminishing returns, and mitigation is rarely 100% guaranteed
– “New” vulnerabilities are constantly identified
• Generally already exist; we were just unaware of their existence (risk ignorance)
– Risk to others is frequently challenging to quantify
• Ex. Your home computer being used to attack others
– Many security guides focus on implementing appropriate controls, not measuring or
tracking the process output (i.e. tracking how the control is effective)
– Risks are commonly mitigated, and sometimes accepted, eliminated, or transferred
February 2007 Risk is Risk, Right? 15
16. Adaptive Adversaries
• The single largest difference between security risk and
others is the concept of the “intelligent, adaptive
adversary”
– Project management has many things to deal with, but sabotage is not common
– Engineers plan to overcome natural and incidental human-triggered risks
– Security staff focus on adversaries and situations where both deliberate and
accidental actions are important
– Adversaries continually adapt and evolve, unlike most natural threats
– The adversary is the perfect example of an uncontrolled variable
• It is rare to be able to limit the adversary’s threat source
– The attacking adversary can choose which vulnerability to attack to what degree while
the defender must address all possible vulnerabilities
– Quantifying the adversary is very subjective
– The types of adversary vary widely
February 2007 Risk is Risk, Right? 16
17. Adversary Pyramid
•Advanced, tailored, exploits
nag te
pio ta
Highly •Very motivated
e
Es tion-s
Skilled •Extensive resources
Na
Attacker •Very limited penalties apply
Adversary Capabilities
•Custom exploits
pio al
Skilled attacker •Motivated (usually financial)
ge
Es ustri
na
•Many resources
Ind
•Limited penalties apply
•Limited exploit customization
me ed
Semi-skilled attacker
Cri ganiz
•Self-motivated
•Limited resources
Or
•Penalties apply
Un-skilled attacker •Use others’ tools
sm
•Out for fun
tivi
ck
•Limited resources
Ha
•Many penalties
Adversary Pool Size
February 2007 Risk is Risk, Right? 17
18. Final Comparisons
• Risk language is consistent, with common approaches
– Various dialects of the same language, with custom terminology and assumptions
– The mechanics are simple to understand, if complex to implement
– Results can be varied across the dialects
– Subjective elements can be hidden by the terminology
• Commonalities between dialects exist:
– Management and security risk is mostly about people and communications, and have the most
intangibles to assess in impact
– Engineering and security risk have the least control over external variables, and are always
identifying previously-unknown latent issues
– Management and engineering risk can depend on long baselines of prior experience
• Some uniqueness exists:
– Management risk includes politics
– Engineering risk is the most straight-forward to quantify
– Security risk includes the adaptive adversary
February 2007 Risk is Risk, Right? 18
19. Final Recommendations
• Set the risk management approach and tone early
– Ensure risk management is utilized throughout the project lifecycle
– Engage the subject matter experts early and often
– Identify the risk management approach(es) to be used for each dialect and ensure all staff are
familiar with the approach
– Be aware of the dialect differences in risk discussions
– Communicate continuously about risk issues across the project; cross-breed awareness
between the subject matter teams
– Identify the subjective elements of the risk assessment and repeatedly re-evaluate
• As with most project problem solutions, communications is a
key element to managing risk
February 2007 Risk is Risk, Right? 19
20. Questions?
• Any questions?
• Contact information:
– Joshua Krage
Joshua.Krage@nasa.gov
February 2007 Risk is Risk, Right? 20
22. Action Learning
• Need three audience volunteers
– One project manager/engineer
– Two operatives, not assigned to the project
• Project: Toss
– Mission success criteria
• Using the provided components (balls/beanbags), get as many as possible into
the target receptacle within the time provided (the schedule)
– Constraints
• Resources (staff and components) are limited to those specifically provided
• Project staff may not approach within the minimum distance indicated until all
components have been used
• Others as indicated
• Operatives receive special instructions individually
February 2007 Risk is Risk, Right? 22
23. References
• ISO17666:2003: Space Systems -- Risk Management
http://www.iso.org/ (available for purchase)
• NIST SP800-30: Risk Management Guide for Information Technology Systems
http://csrc.nist.gov/publications/nistpubs/800-30/sp800-30.pdf
• NASA NPR8705.5: Probabilistic Risk Assessment (PRA) Procedures for NASA Programs
and Projects
http://nodis.hq.nasa.gov/ (download site)
• NASA NPR8000.4: Risk Management Procedural Requirements
https://nodis.hq.nasa.gov/ (download site)
February 2007 Risk is Risk, Right? 23
24. Additional Reading
• European Network and Information Security Agency (ENISA): Risk Management:
Implementation Principles and Inventories for Risk Management/Risk Assessment
Methods and Tools
http://www.enisa.europa.eu/rmra/files/D1_Inventory_of_Methods_Risk_Management_Fina
l.pdf
• Operationally Critical Threat, Asset, and Vulnerability Evaluation (OCTAVE)
http://www.cert.org/octave/
• Information Security Management Maturity Model (ISM3)
http://www.ism3.com/ Process oriented information security management
February 2007 Risk is Risk, Right? 24