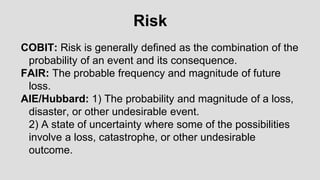
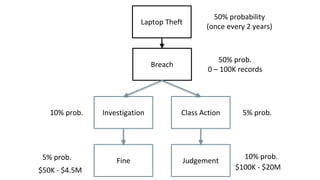
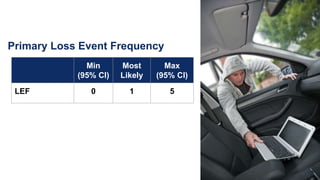
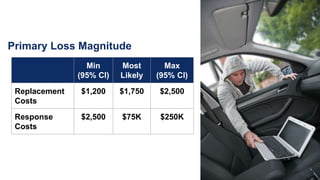
Northeast Ohio Chapter
Crash Course:
Managing Cyber Risk Using
Quantitative Analysis
Disclaimer:
I am not a lawyer This is not legal advice
Cost of cyber crime by 2019 – Juniper Networks
$231.94 Billion
Cyber Security Market by 2022
Houston,
we DON’T have
an IT
Objective
Agenda
Part 1 – Case Study
Part 2 – Concepts and Theory
Part 3 – Application of Concepts
Part 1 – Case Study:
Part 2 – Concepts and Theory
Concepts
• Risk & Uncertainty
• Risk Management
• Risk Analysis
Risk & Uncertainty
COBIT: Risk is generally defined as the combination of the
probability of an event and its consequence.
FAIR: The probable frequency and magnitude of future
loss.
AIE/Hubbard: 1) The probability and magnitude of a loss,
disaster, or other undesirable event.
2) A state of uncertainty where some of the possibilities
involve a loss, catastrophe, or other undesirable
outcome.
Risk
Measurement of Risk: A set of possibilities each with
quantified probabilities, and quantified losses. For
example: “we believe there is a 40% chance the
proposed oil well will be dry with a loss of $12 million
in exploratory drilling costs.”
Risk
AIE/Hubbard: The lack of complete certainty, that is, the
existence of more than one possibility. The “true”
outcome/state/result/value is not known.
Measurement of Uncertainty: A set of probabilities
assigned to a set of possibilities. For example: “there is
a 60% chance this market will more than double in five
years, a 30% chance it will grow at a slower rate, and a
10% chance the market will shrink in the same period”.
Uncertainty
Risk Management
FAIR: The combination of personnel, policies,
processes, and technologies that enable an
organization to cost-effectively achieve an acceptable
level of loss exposure.
AIE/Hubbard: Long definition: The identification,
assessment, and prioritization of risks followed by
coordinated and economical application of resources
to minimize, monitor, and control the probability and/or
impact of unfortunate events
Shorter definition: Being smart about taking chances
Risk Management
ISO Guide 73:2002: Coordinated activities to direct and
control an organization with regard to risk
ISACA CRISC: The coordinated activities to direct and
control an enterprise with regard to risk.
Risk management is the identification, assessment and
prioritization of risk followed by coordinated and
economical application of resources to minimize,
monitor, and control the probability and/or impact of
adverse events or to maximize the realization of
opportunities.
Risk Management
• Avoid
• Mitigate
• Transfer
• Accept
• Progress
• Risk Indicators
• Operating
Environment
Risk Factors
• Threat
• Vulnerabilities
• Impact
• Issues
• Tolerance /
Appetite
Discover Analyze
TreatMonitor
iskManagementProcess
Risk Analysis
You can’t manage
what you don’t
measure.
Why do we measure
(aka analyze) risk?
Informing Decisions
● How much risk do we have?
● How much should we invest in security?
● Where should we invest?
● What are we getting for our investment?
What if we measured
everything like we
measure cyber risk?
How far?
Distance rating: 6
How much?
Medium
Mental Models Analytical Models
How do we assess risk?
Analytical Methods
Source: NIST 800-30r1 – Guide for Conducting Risk Assessments
Qualitative Analysis
Semi-Quantitative Analysis
Risk Rating: 20.781
Quantitative Analysis
Math on
Ordinal Scales
Quantitative risk analysis:
How do we do it?
Risk Analysis Basics
1. Risk Scenarios
2. Risk Models
3. Simulations
Risk Scenario
Scenarios are a powerful tool in a risk manager’s armory—
they help professionals ask the right questions and prepare
for the unexpected. Scenario analysis has become a ‘new’
and best practice in enterprise risk management (ERM)
(Source: isaca.org)
Example Risk Scenario Statement
Risk scenario statement:
What is the risk associated with PHI being exposed
via a lost/stolen laptop?
Essentially, all
models are wrong,
but some are
useful.
- George E. P. Box
Risk Models Help Us:
●Decompose complex risk issues.
●Understand correlated relationships between variables/risk
factors.
●Diagnose disagreements/issues.
●Bring credibility to our findings.
●Enable conversations.
Simulations
Two primary tools:
a) Probability Distributions (PERT)
b) Monte Carlo Simulation (Stochastic
Modeling)
Monte Carlo Simulation
Computerized mathematical technique that
allows people to account for risk in quantitative
analysis and decision making.
Pert Distibutions
Form of probability distribution used to model
expert data.
Pert Distribution Histogram
Open
FAIR
What is FAIR?
Factor Analysis of Information Risk
Published by Jack Jones in 2005
Adopted by the Open Group in 2014
● Risk Taxonomy Standard
● Risk Analysis Standard
Forms of Loss
● Productivity
● Response
● Replacement
● Fines/Judgement
● Competitive Advantage
● Reputation
Loss
Magnitude
Risk
Loss Event
Frequency
The probable frequency and
probable magnitude of loss.
Loss Event
Frequency
Loss
Magnitude
Threat Event
Frequency
Risk
Vulnerability
Contact
Frequency
Probability
of Action
Threat
Capability
Resistance
Strength
Loss Event
Frequency
Loss
Magnitude
Threat Event
Frequency
Risk
Vulnerability
Contact
Frequency
Probability
of Action
Threat
Capability
Resistance
Strength
Loss Event
Frequency
Loss
Magnitude
Threat Event
Frequency
Risk
Vulnerability
Contact
Frequency
Probability
of Action
Threat
Capability
Resistance
Strength
Loss Event
Frequency
Loss
Magnitude
Threat Event
Frequency
Risk
Vulnerability
Contact
Frequency
Probability
of Action
Threat
Capability
Resistance
Strength
Loss Event
Frequency
Loss
Magnitude
Threat Event
Frequency
Risk
Vulnerability
Contact
Frequency
Probability
of Action
Threat
Capability
Resistance
Strength
Loss Event
Frequency
Loss
Magnitude
Threat Event
Frequency
Risk
Vulnerability
Contact
Frequency
Probability
of Action
Threat
Capability
Resistance
Strength
Loss Event
Frequency
Loss
Magnitude
Threat Event
Frequency
Risk
Vulnerability
Contact
Frequency
Probability
of Action
Threat
Capability
Resistance
Strength
Loss Event
Frequency
Loss
Magnitude
Secondary
Loss Factors
Risk
Primary Loss
Factors
Organizational
Loss Factors
External Loss
Factors
Asset Loss
Factors
Threat Loss
Factors
Loss Event
Frequency
Loss
Magnitude
Secondary
Loss Factors
Risk
Primary Loss
Factors
Organizational
Loss Factors
External Loss
Factors
Asset Loss
Factors
Threat Loss
Factors
Loss Event
Frequency
Loss
Magnitude
Secondary
Loss Factors
Risk
Primary Loss
Factors
Organizational
Loss Factors
External Loss
Factors
Asset Loss
Factors
Threat Loss
Factors
Part 3 – Exercises
Exercise 1: Guess My Weight
Exercise 1: Pert Distribution
Guess my weight
●Min:
●Max:
●Most Likely:
●Confidence:
Exercise 2:
Guess My Weight…in Hot Tamales!
Hot Tamale vs Plain M&M
Exercise 3:
Auditors report lack of laptop
encryption is a “high risk” issue.
Encryption will require a $200-250K
investment.
CFO wants to know if this is worth
the investment.
Laptop Theft
Breach
Investigation Class Action
Fine Judgement
50% probability
(once every 2 years)
50% prob.
0 – 100K records
5% prob.
10% prob.
10% prob.
5% prob.
$50K - $4.5M $100K - $20M
Primary Loss Event Frequency
Min
(95% CI)
Most
Likely
Max
(95% CI)
LEF 0 1 5
Primary Loss Magnitude
Min
(95% CI)
Most
Likely
Max
(95% CI)
Replacement
Costs
$1,200 $1,750 $2,500
Response
Costs
$2,500 $75K $250K
Secondary Loss Magnitude
Min
(95% CI)
Most
Likely
Max
(95% CI)
Response
Costs
$100K $250K $8M
Fines /
Judgement
$0 $0 $10M
Simulation Output
Simulation Output
Simulation Output
“The significant problems we face
cannot be solved at the same level of
thinking with which we created them.”
@appsgarcia
agarcia@healthguardsecurity.com
513.549.4272
Apolonio “Apps” Garcia

Crash Course: Managing Cyber Risk Using Quantitative Analysis