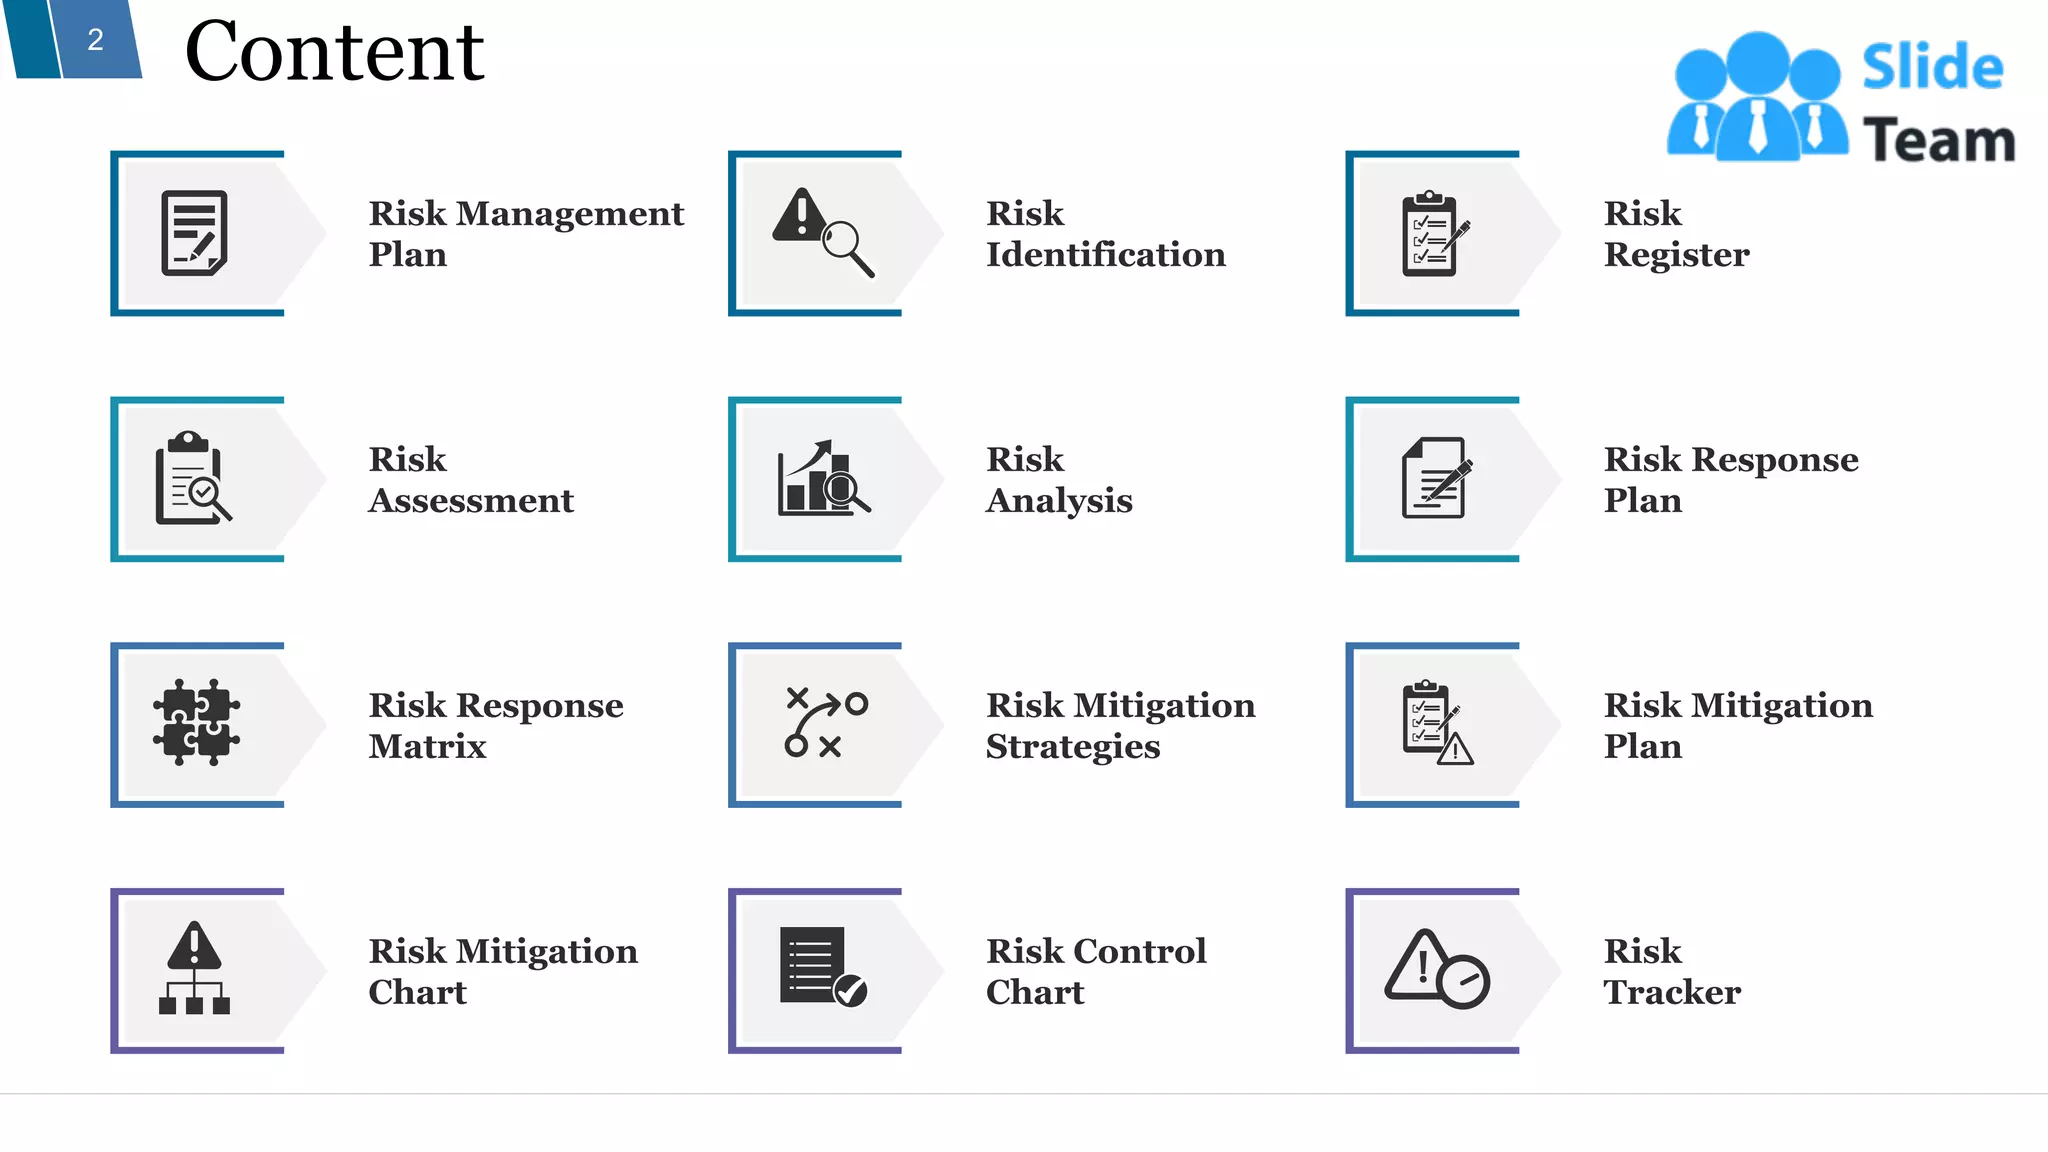
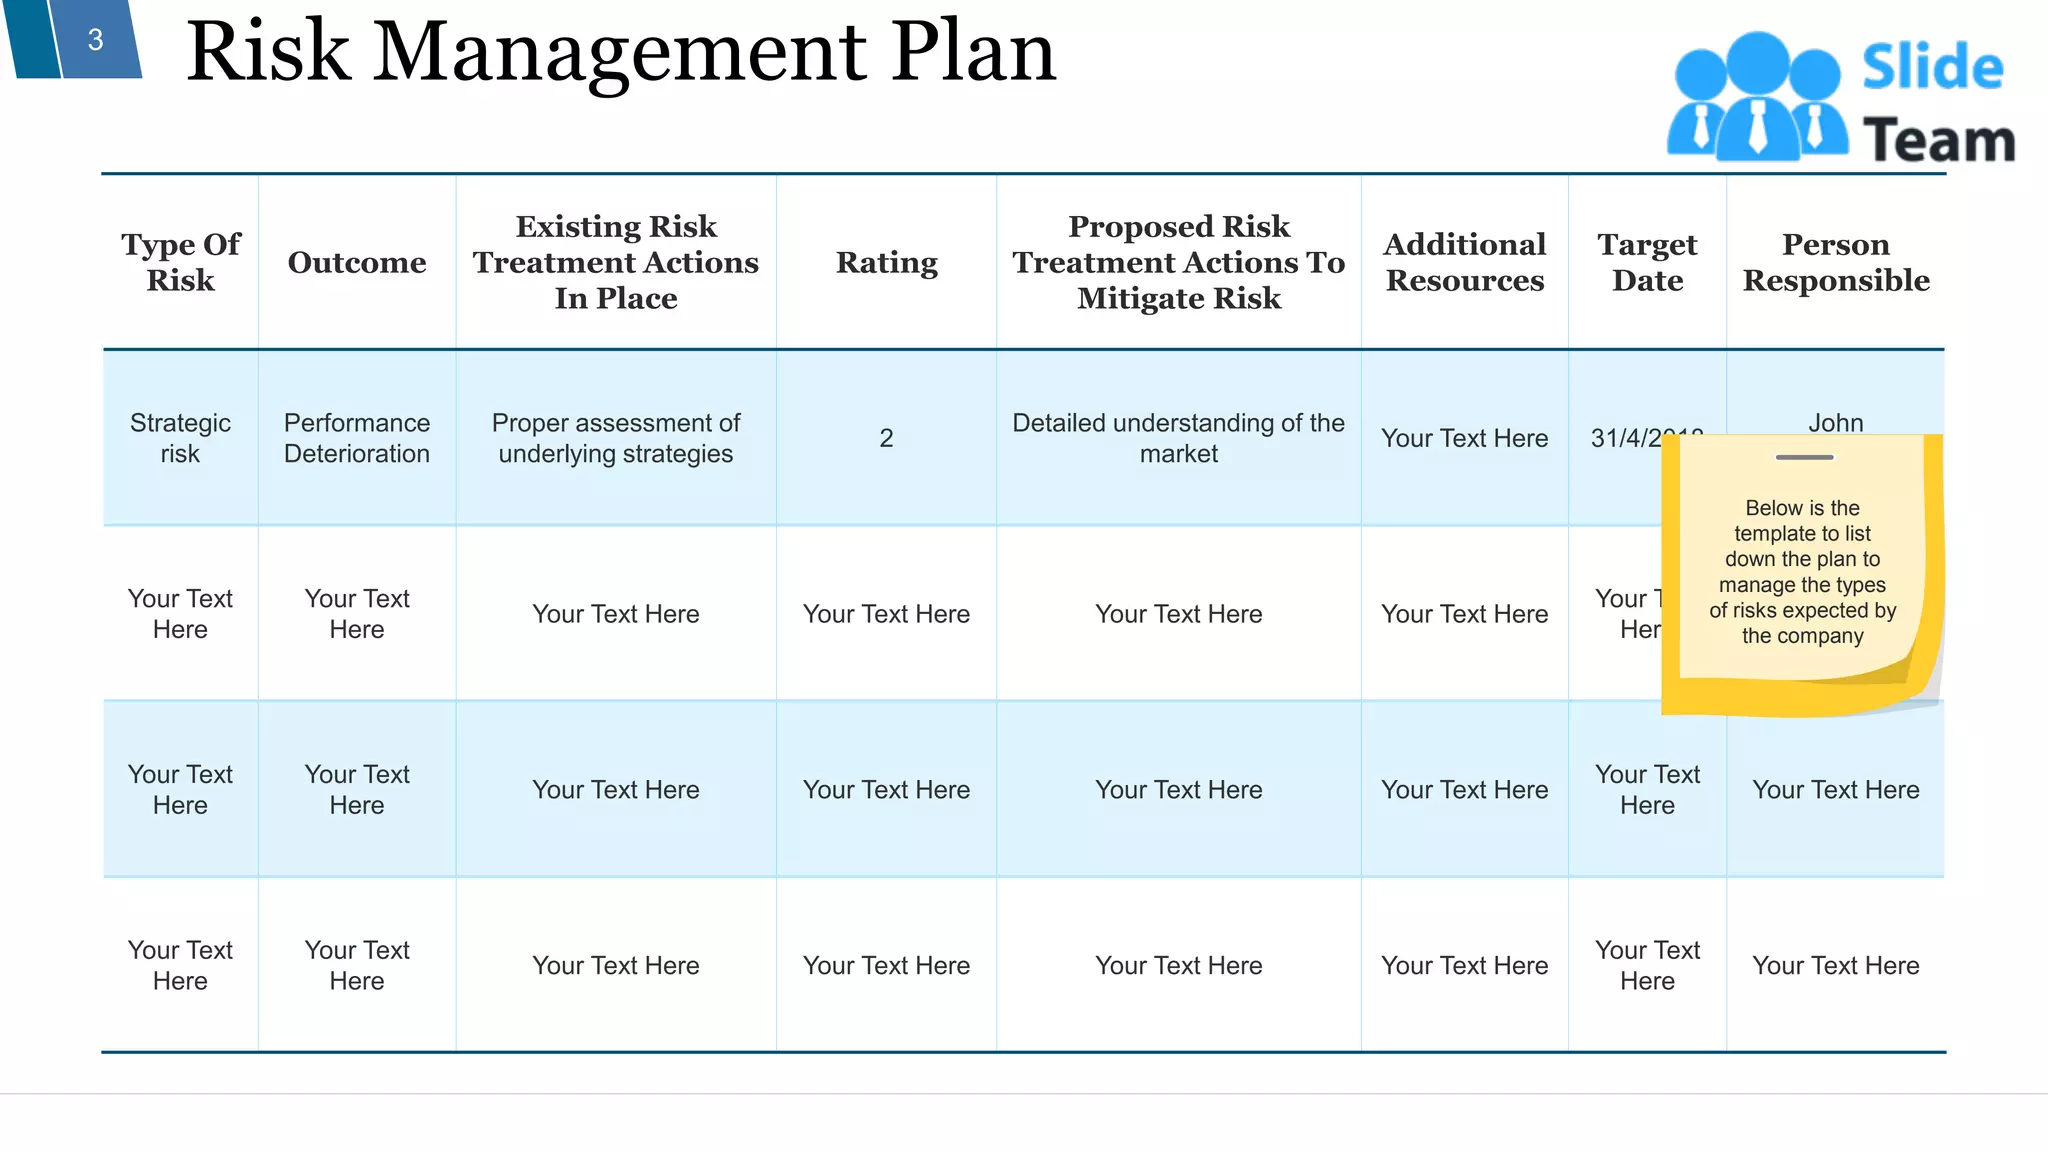
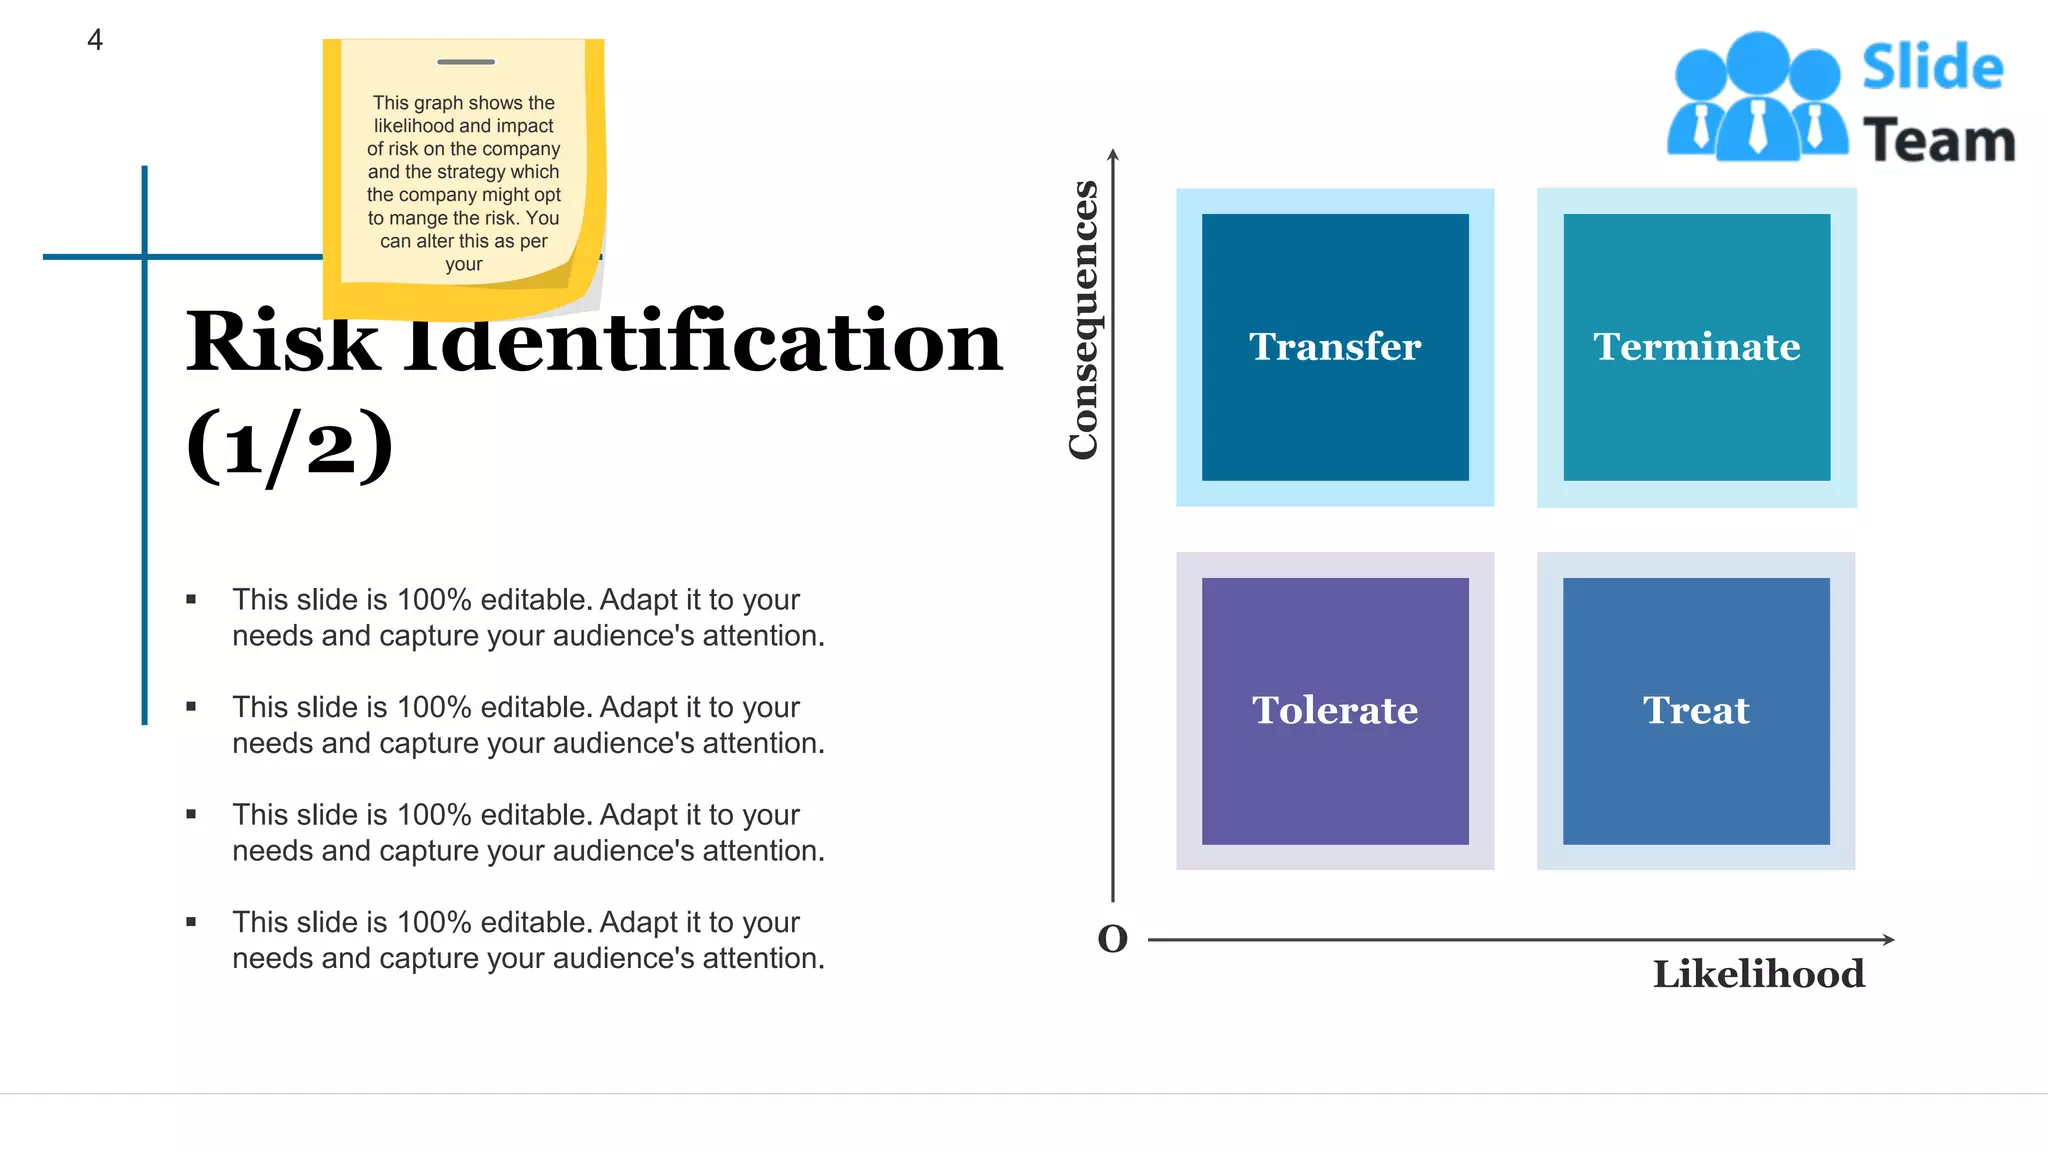
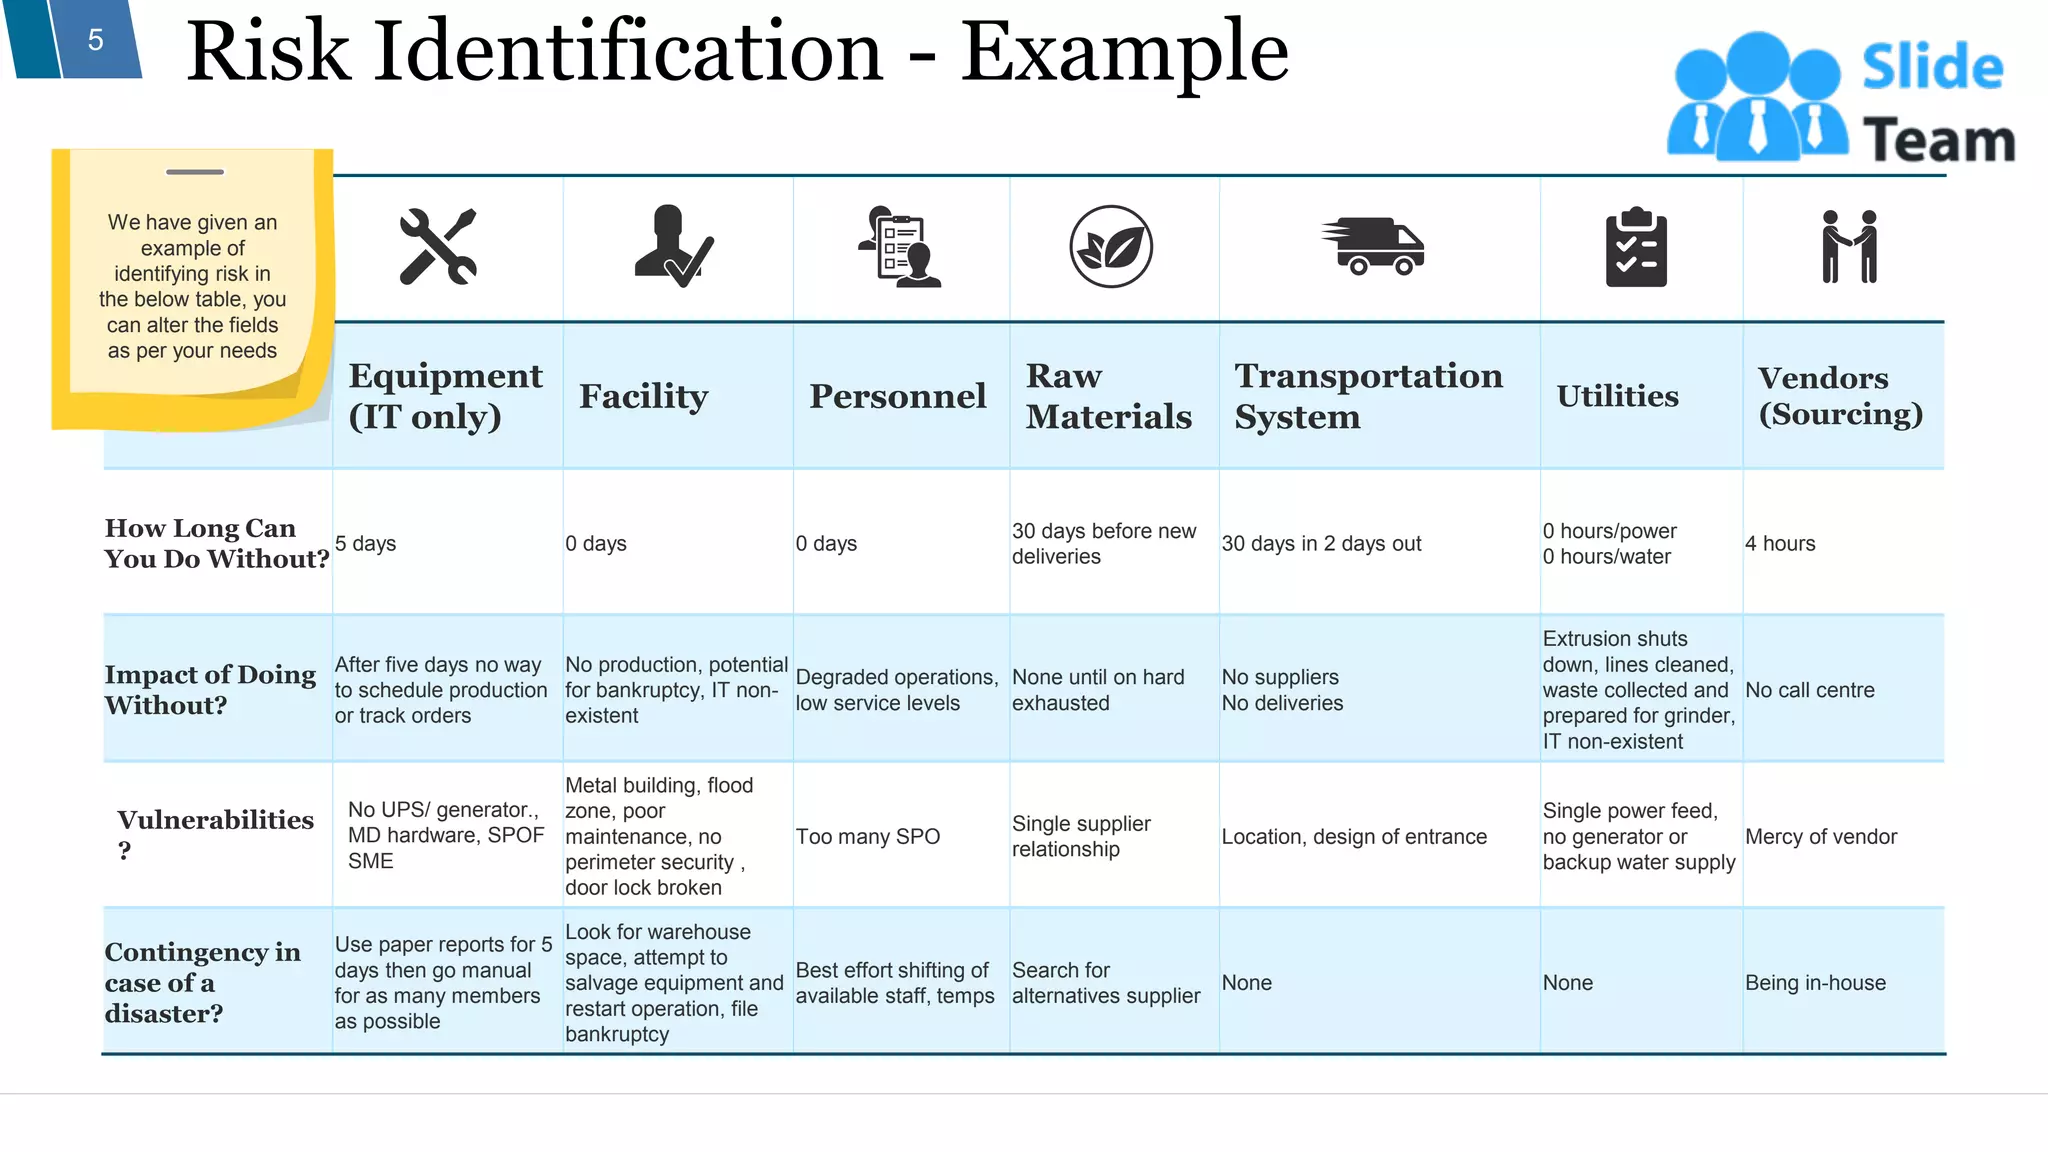
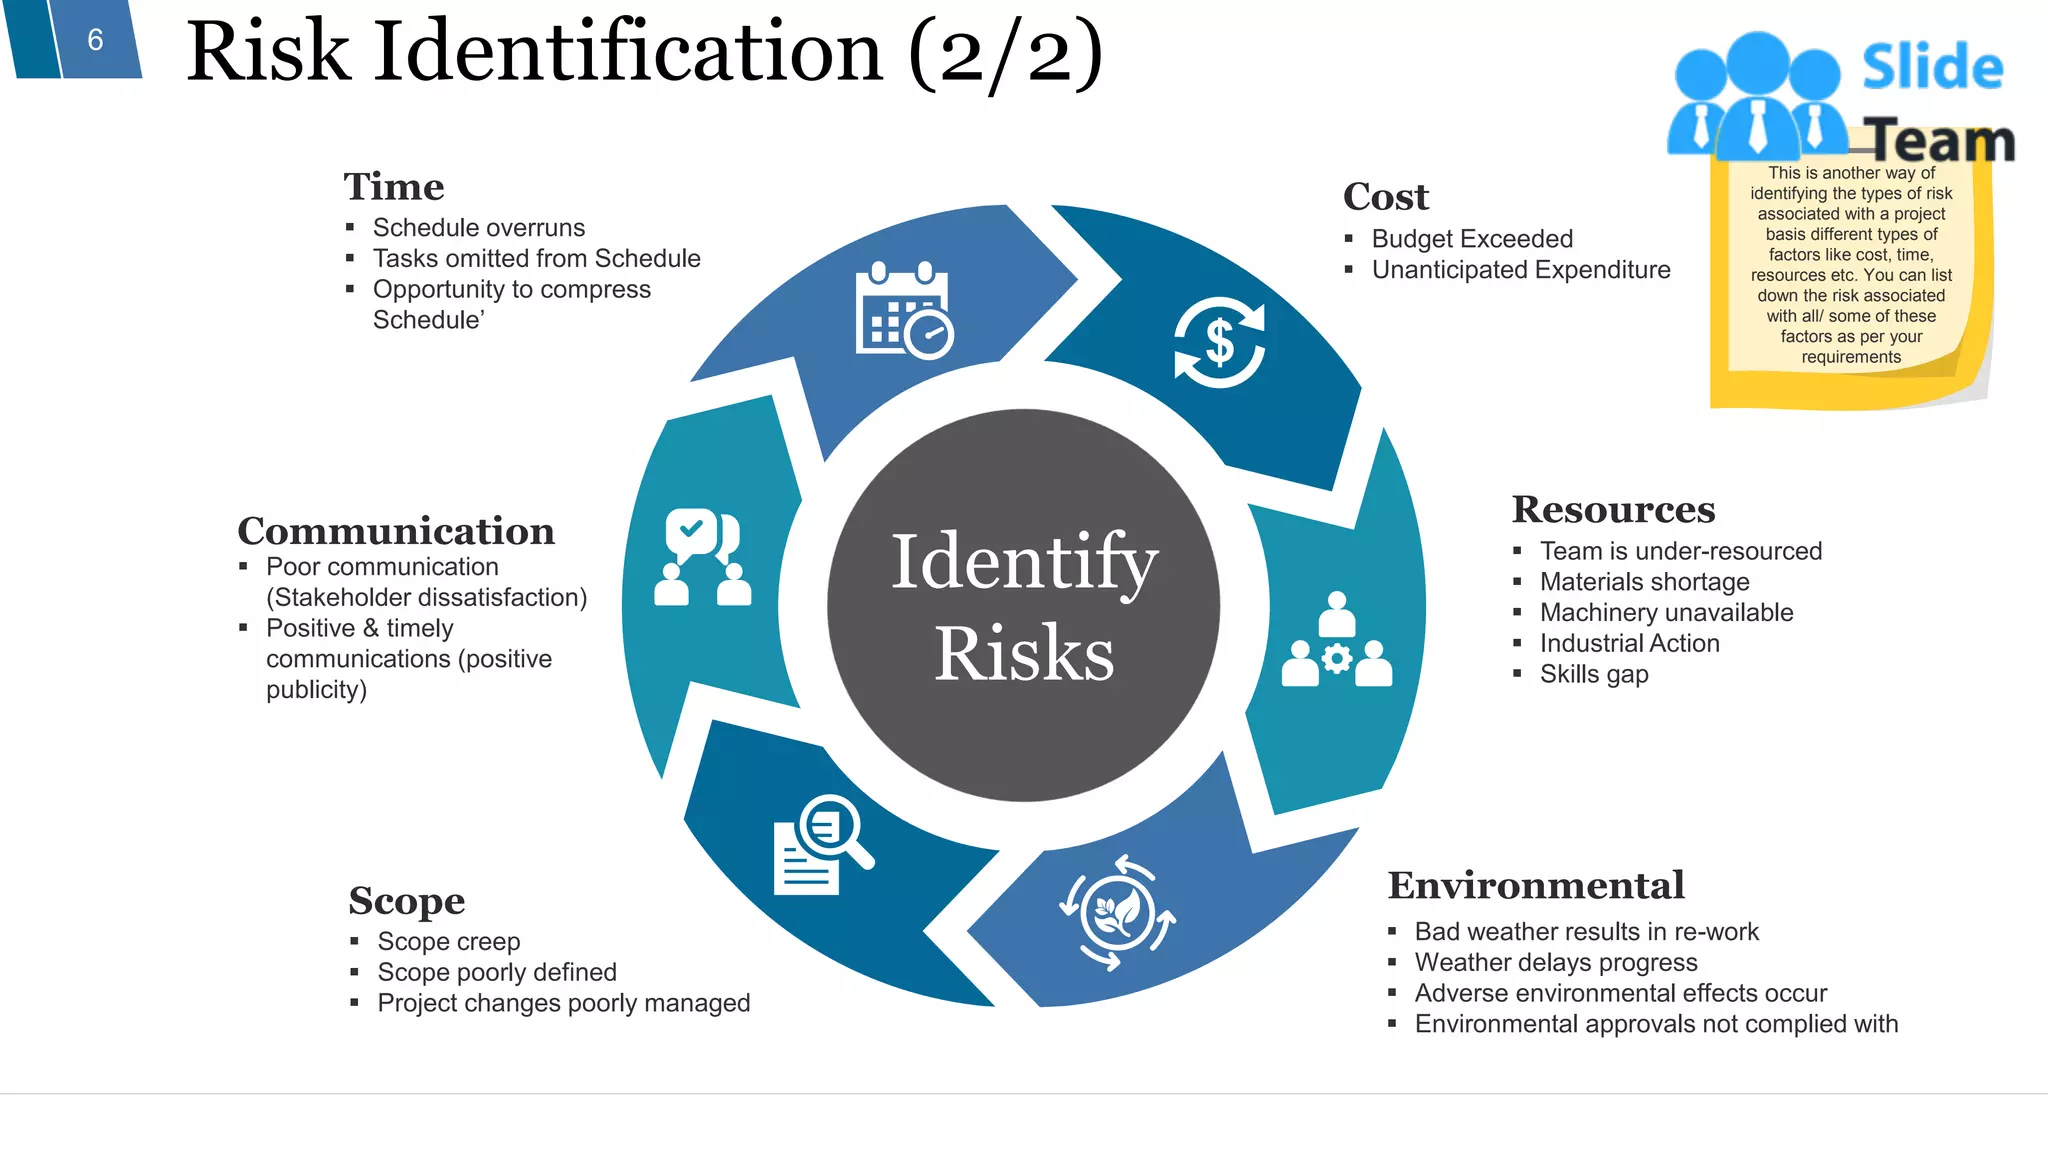
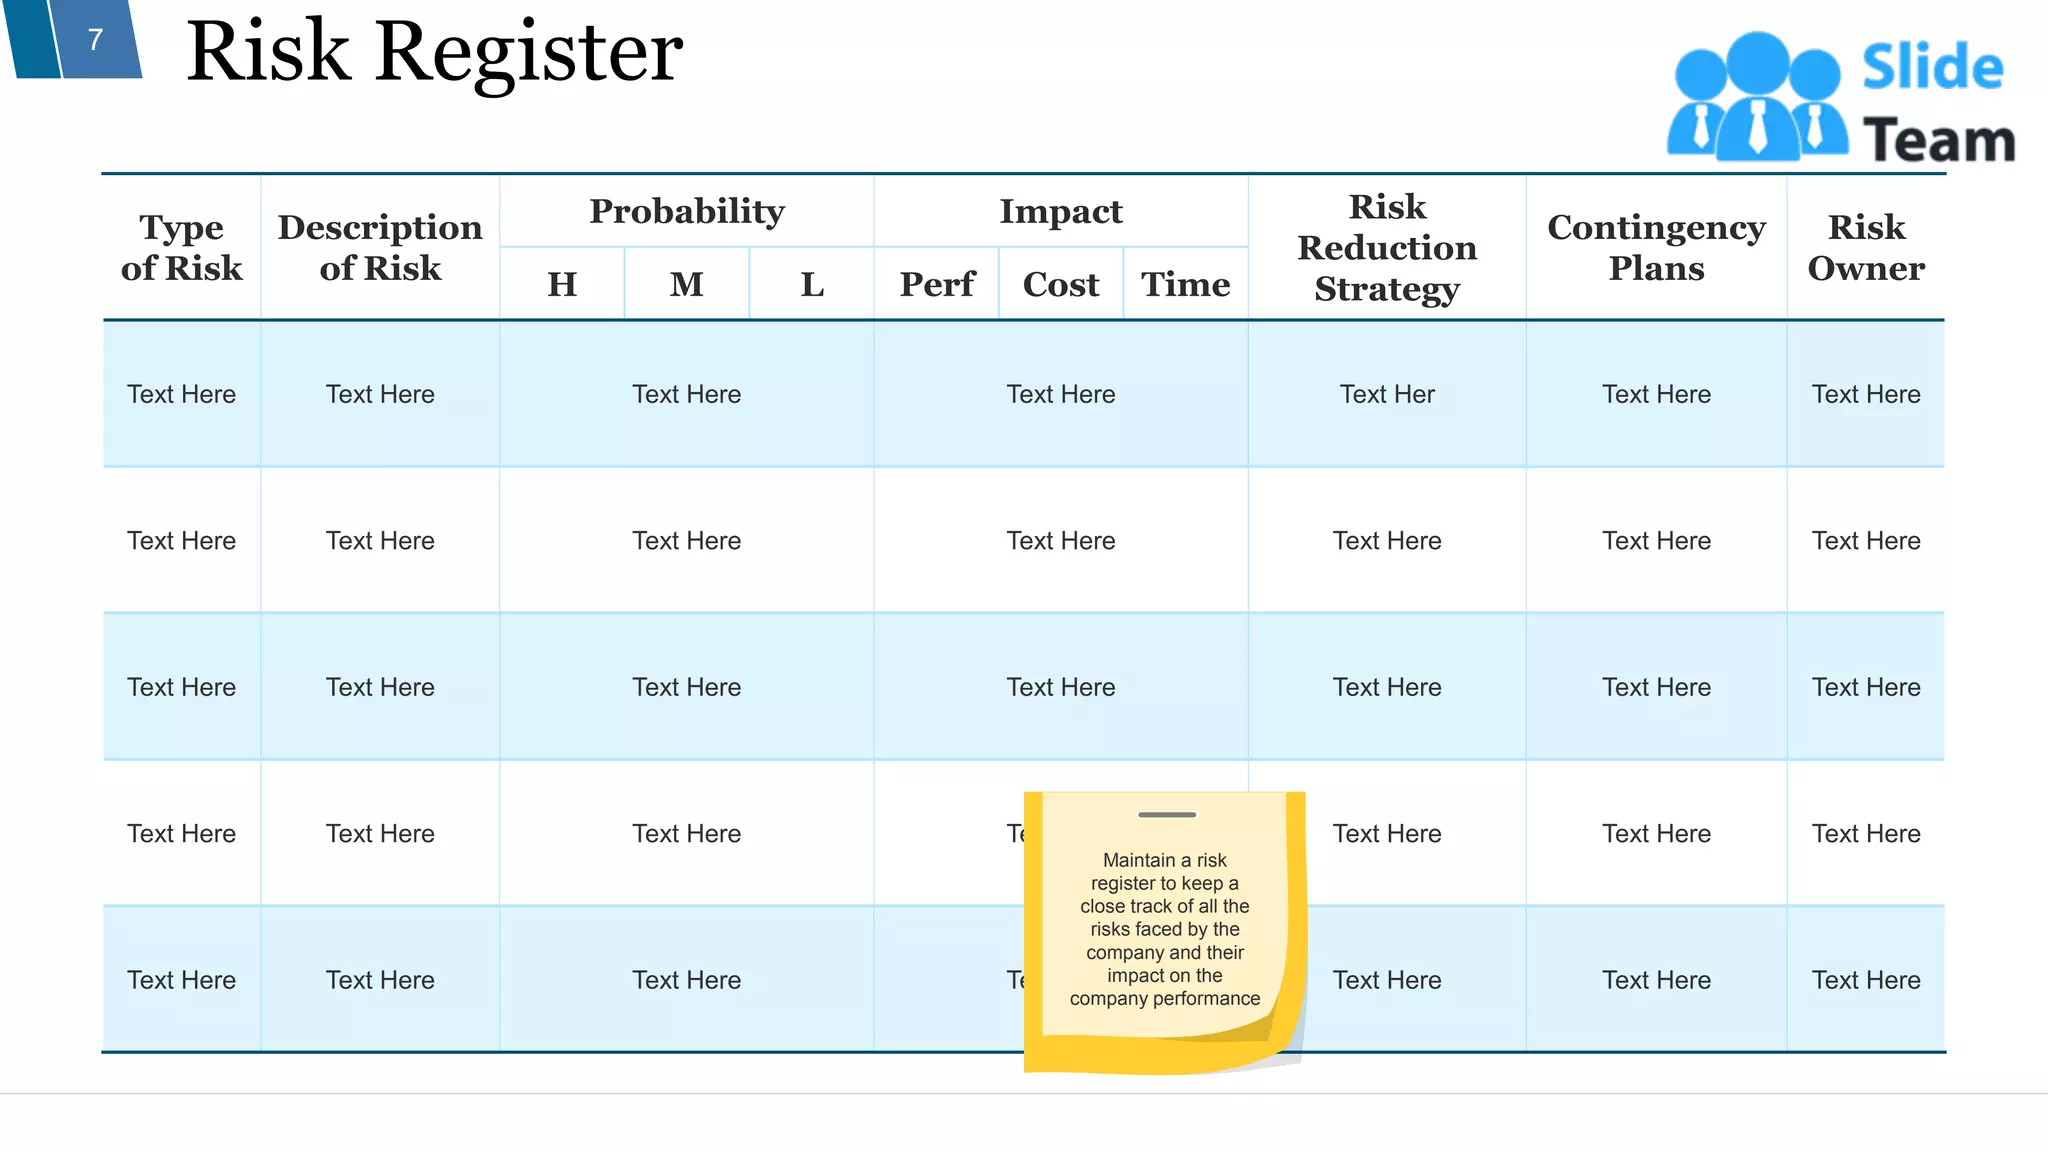
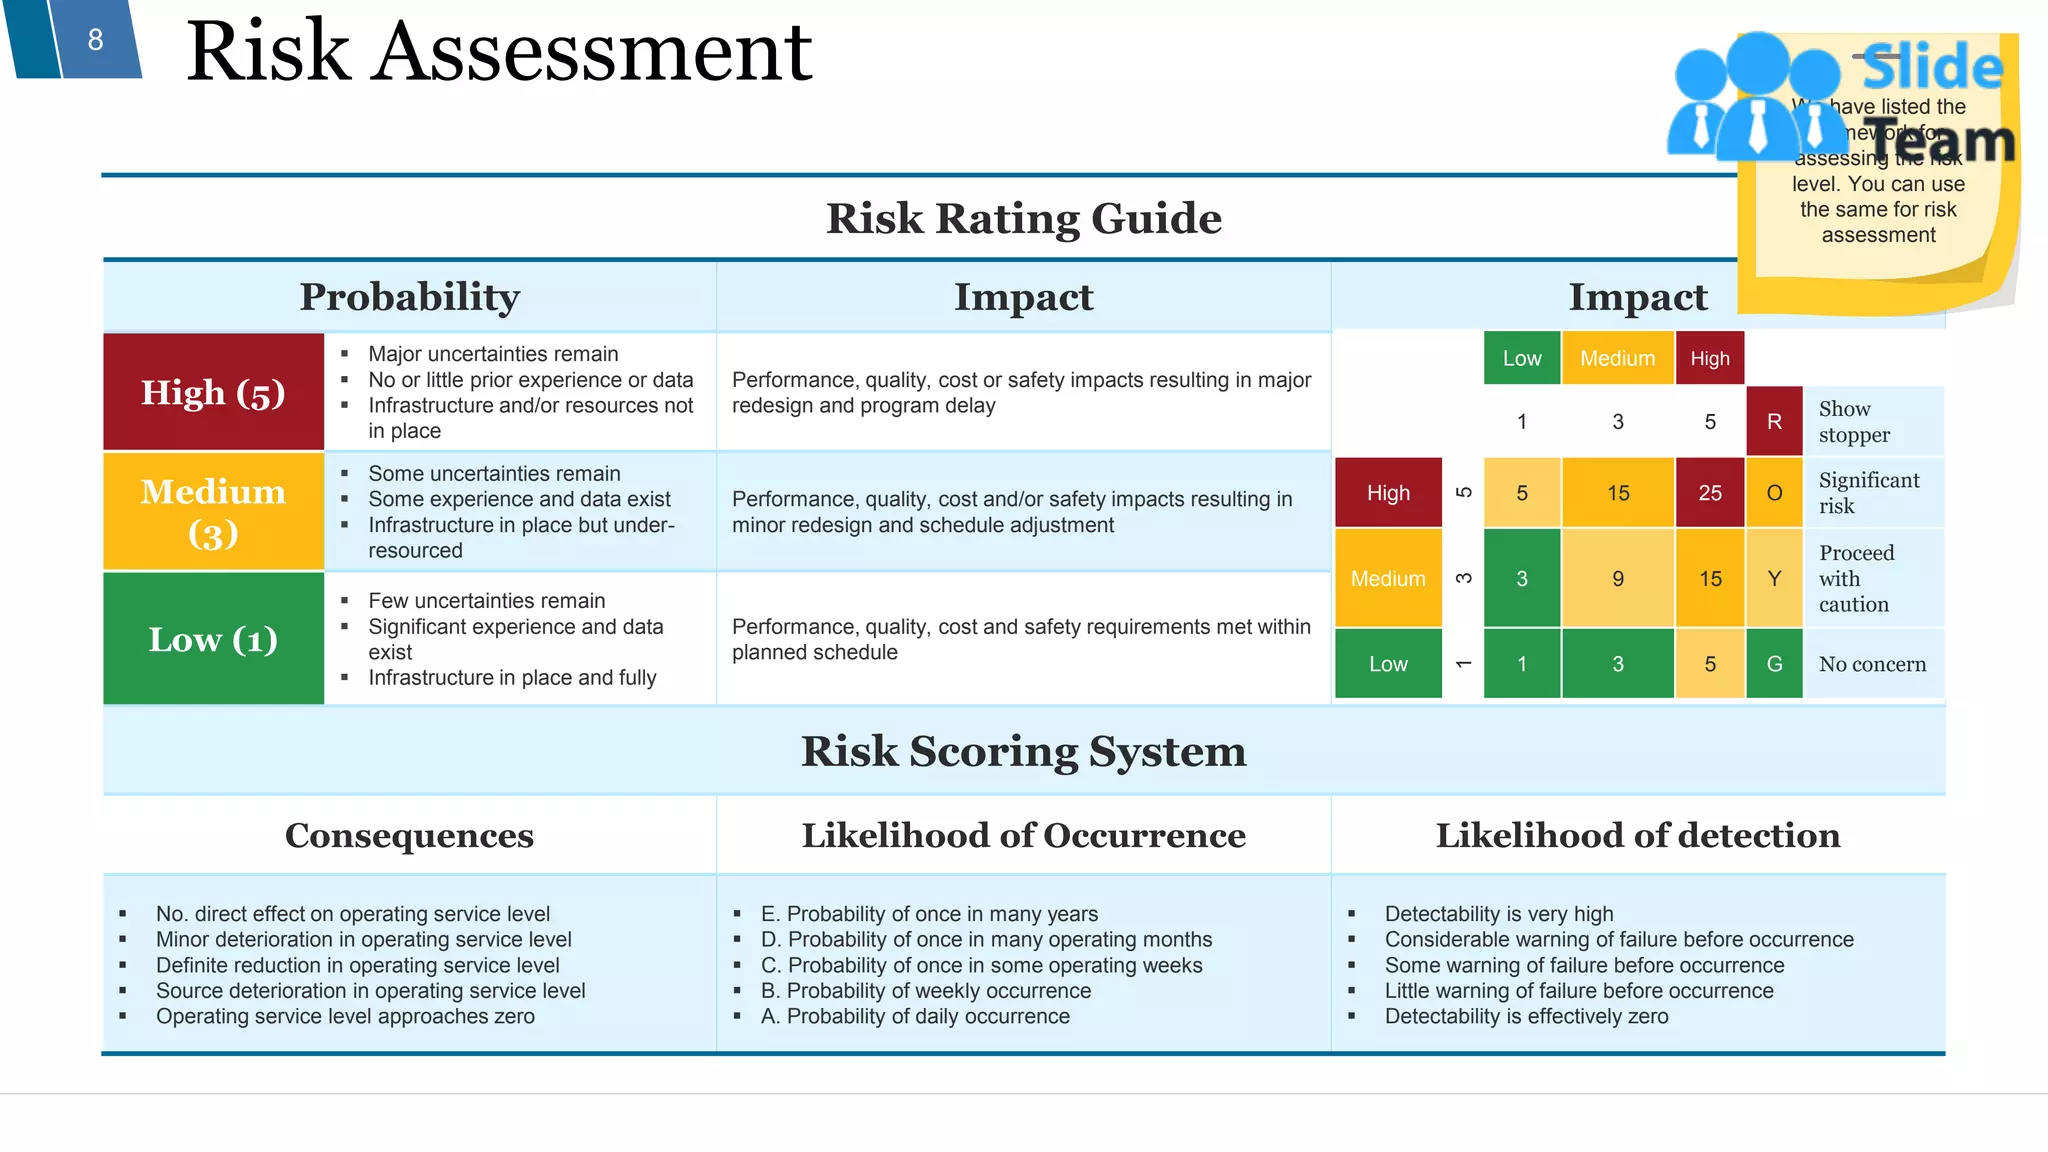
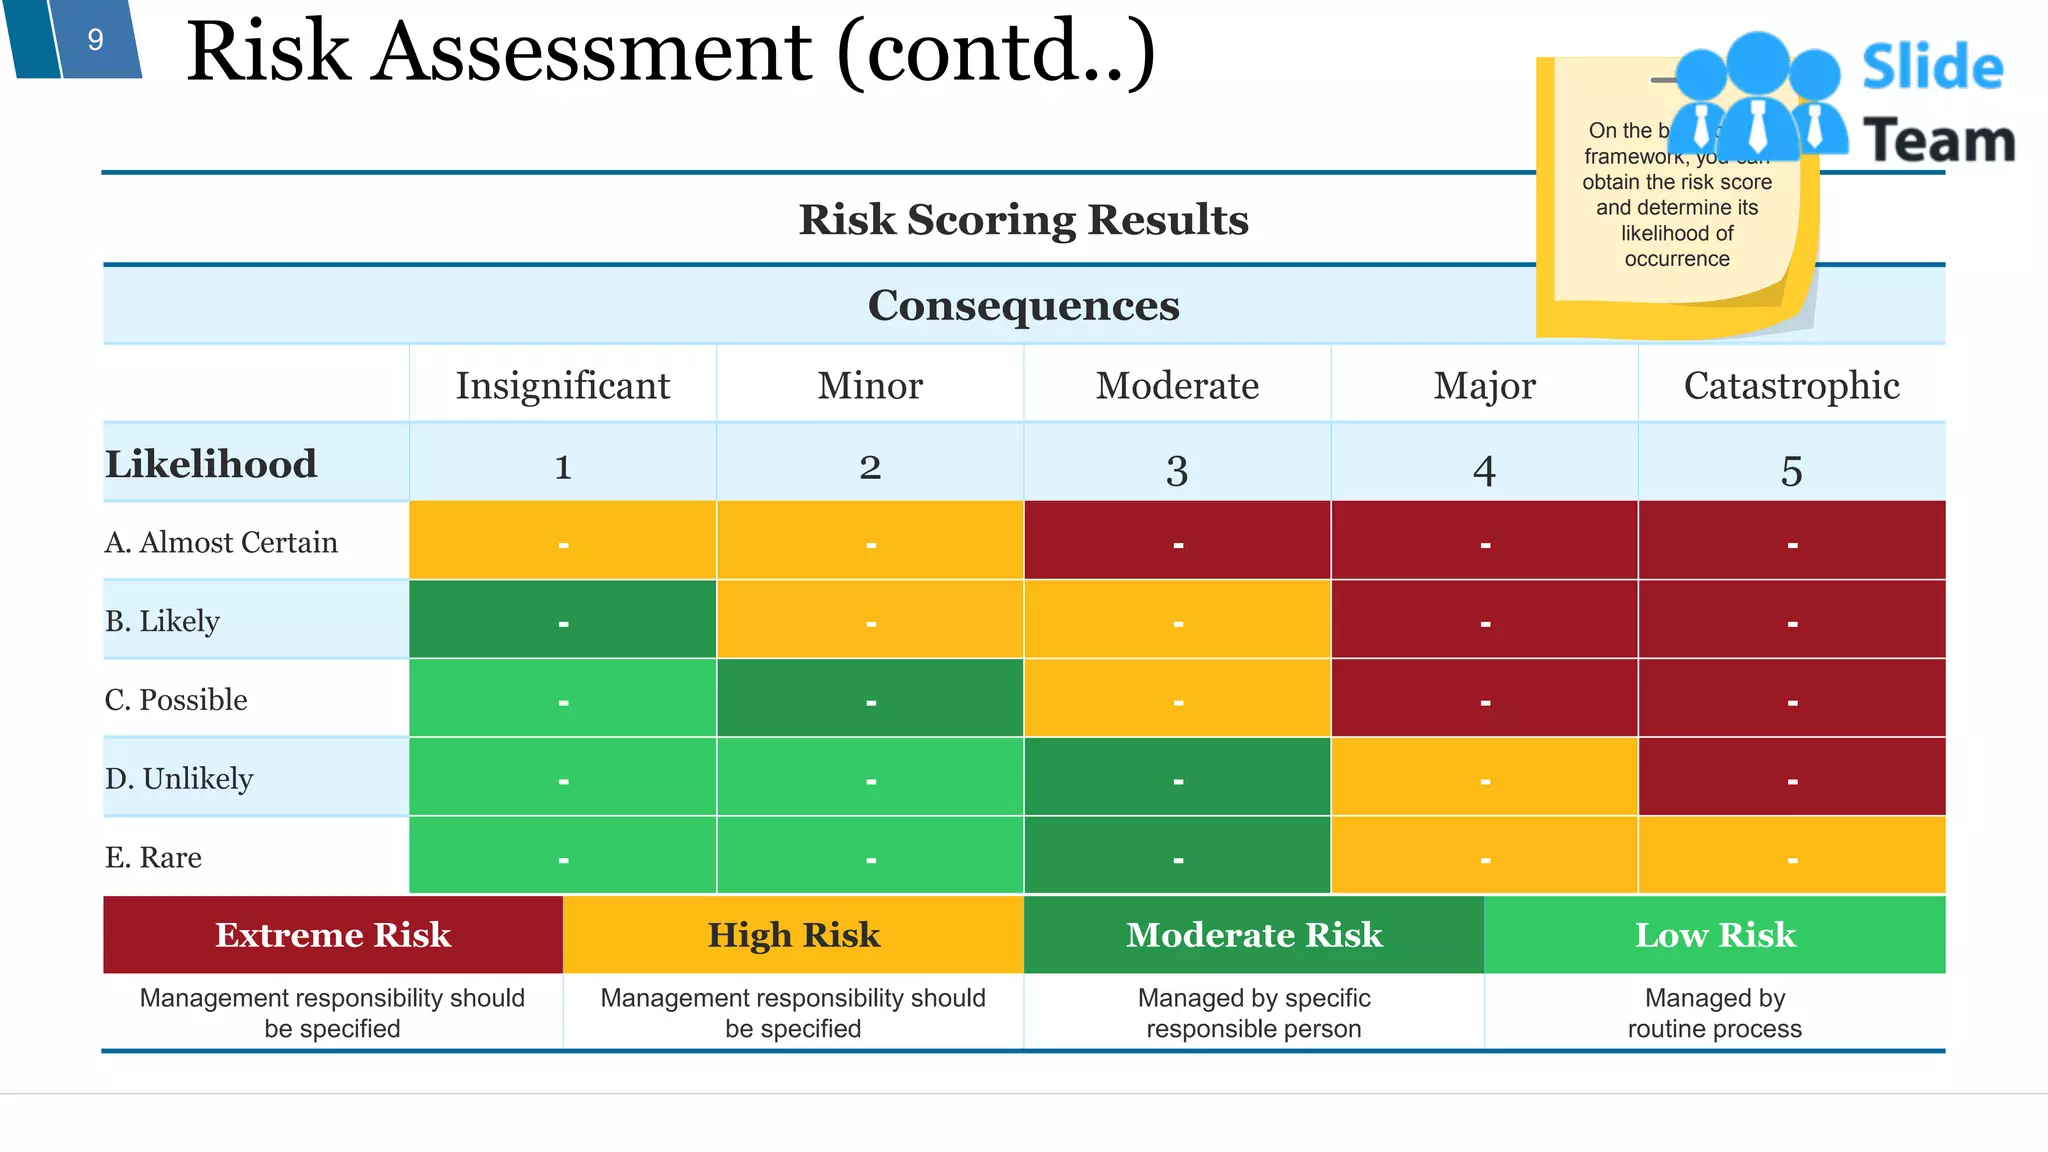
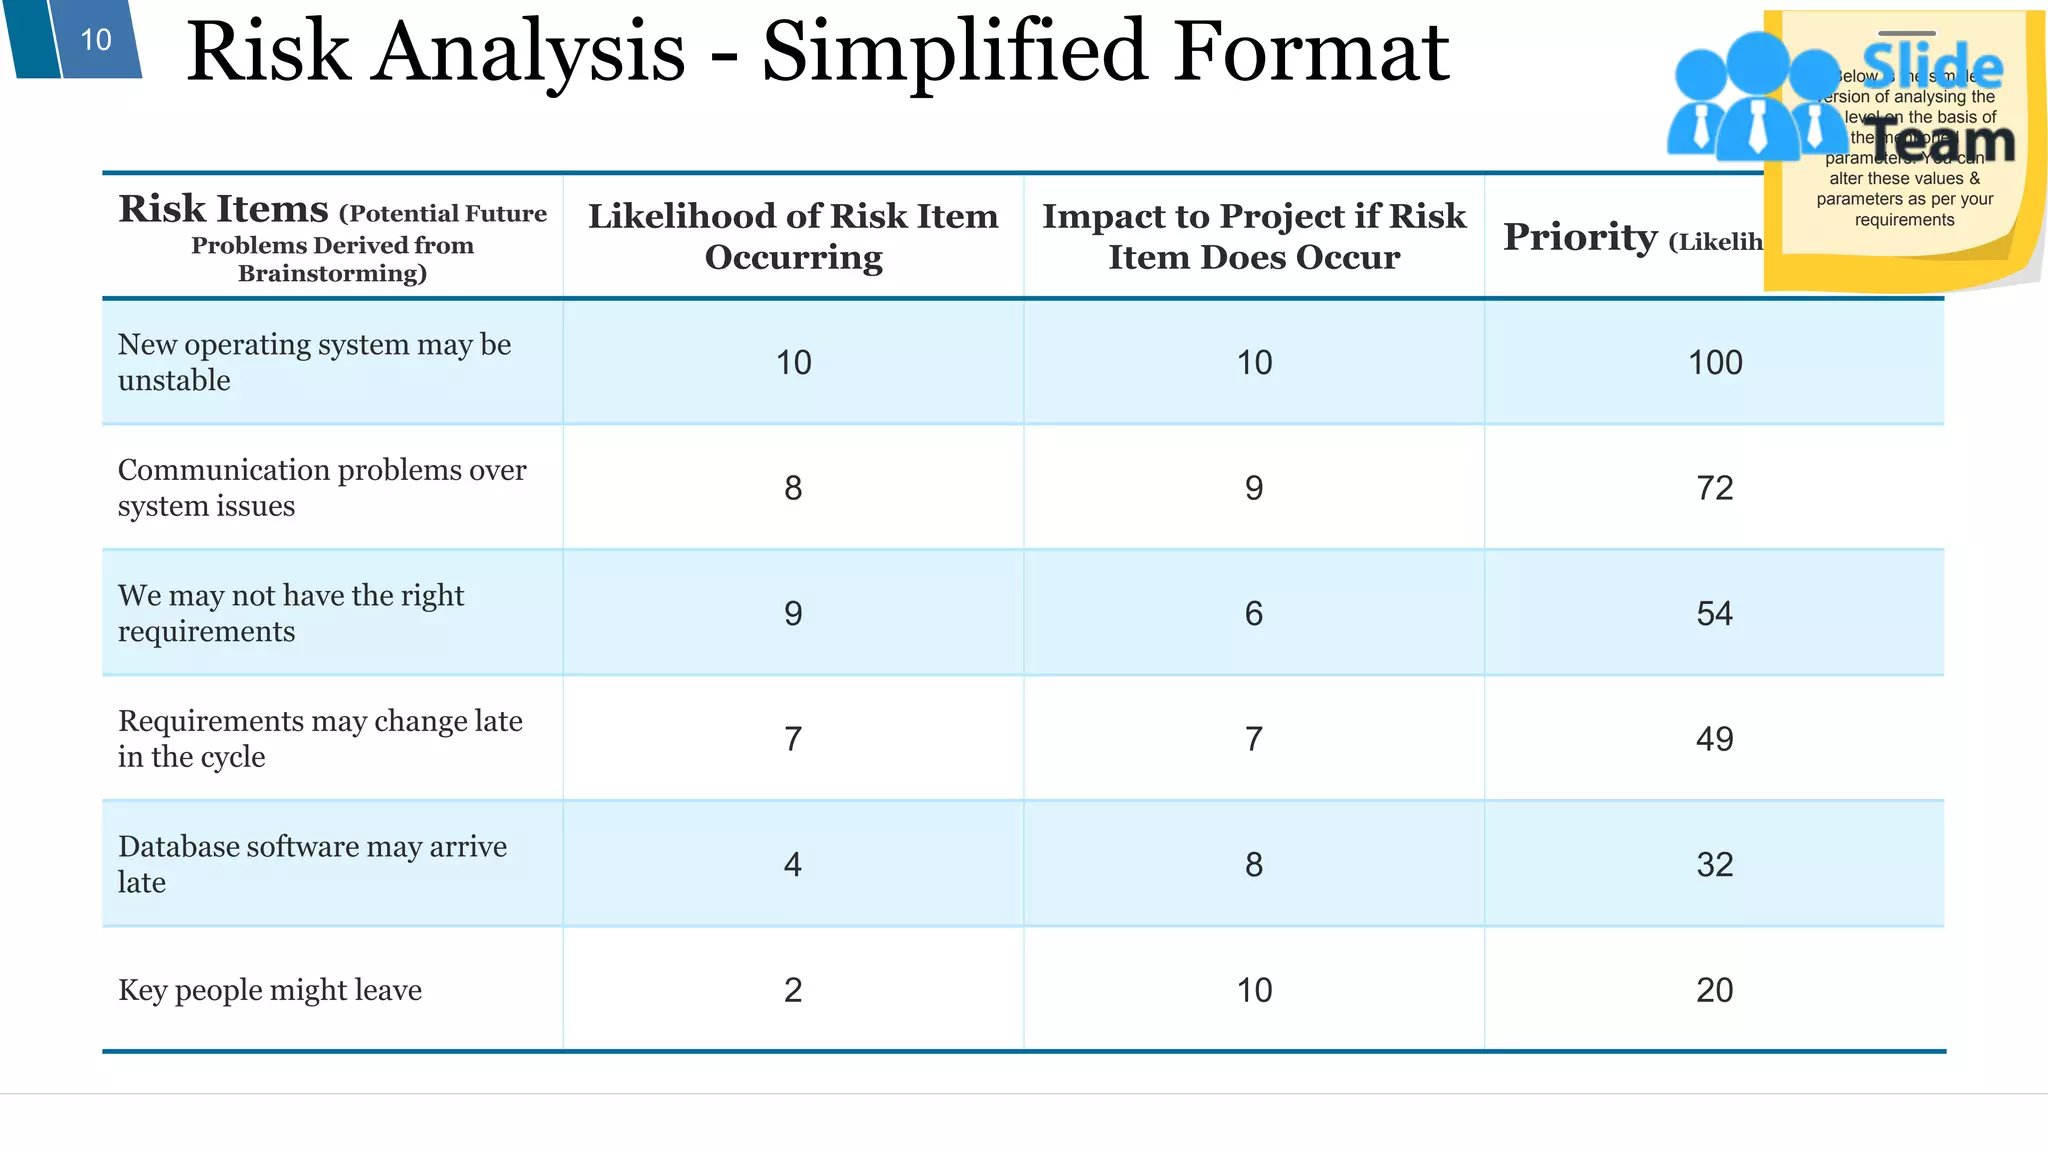
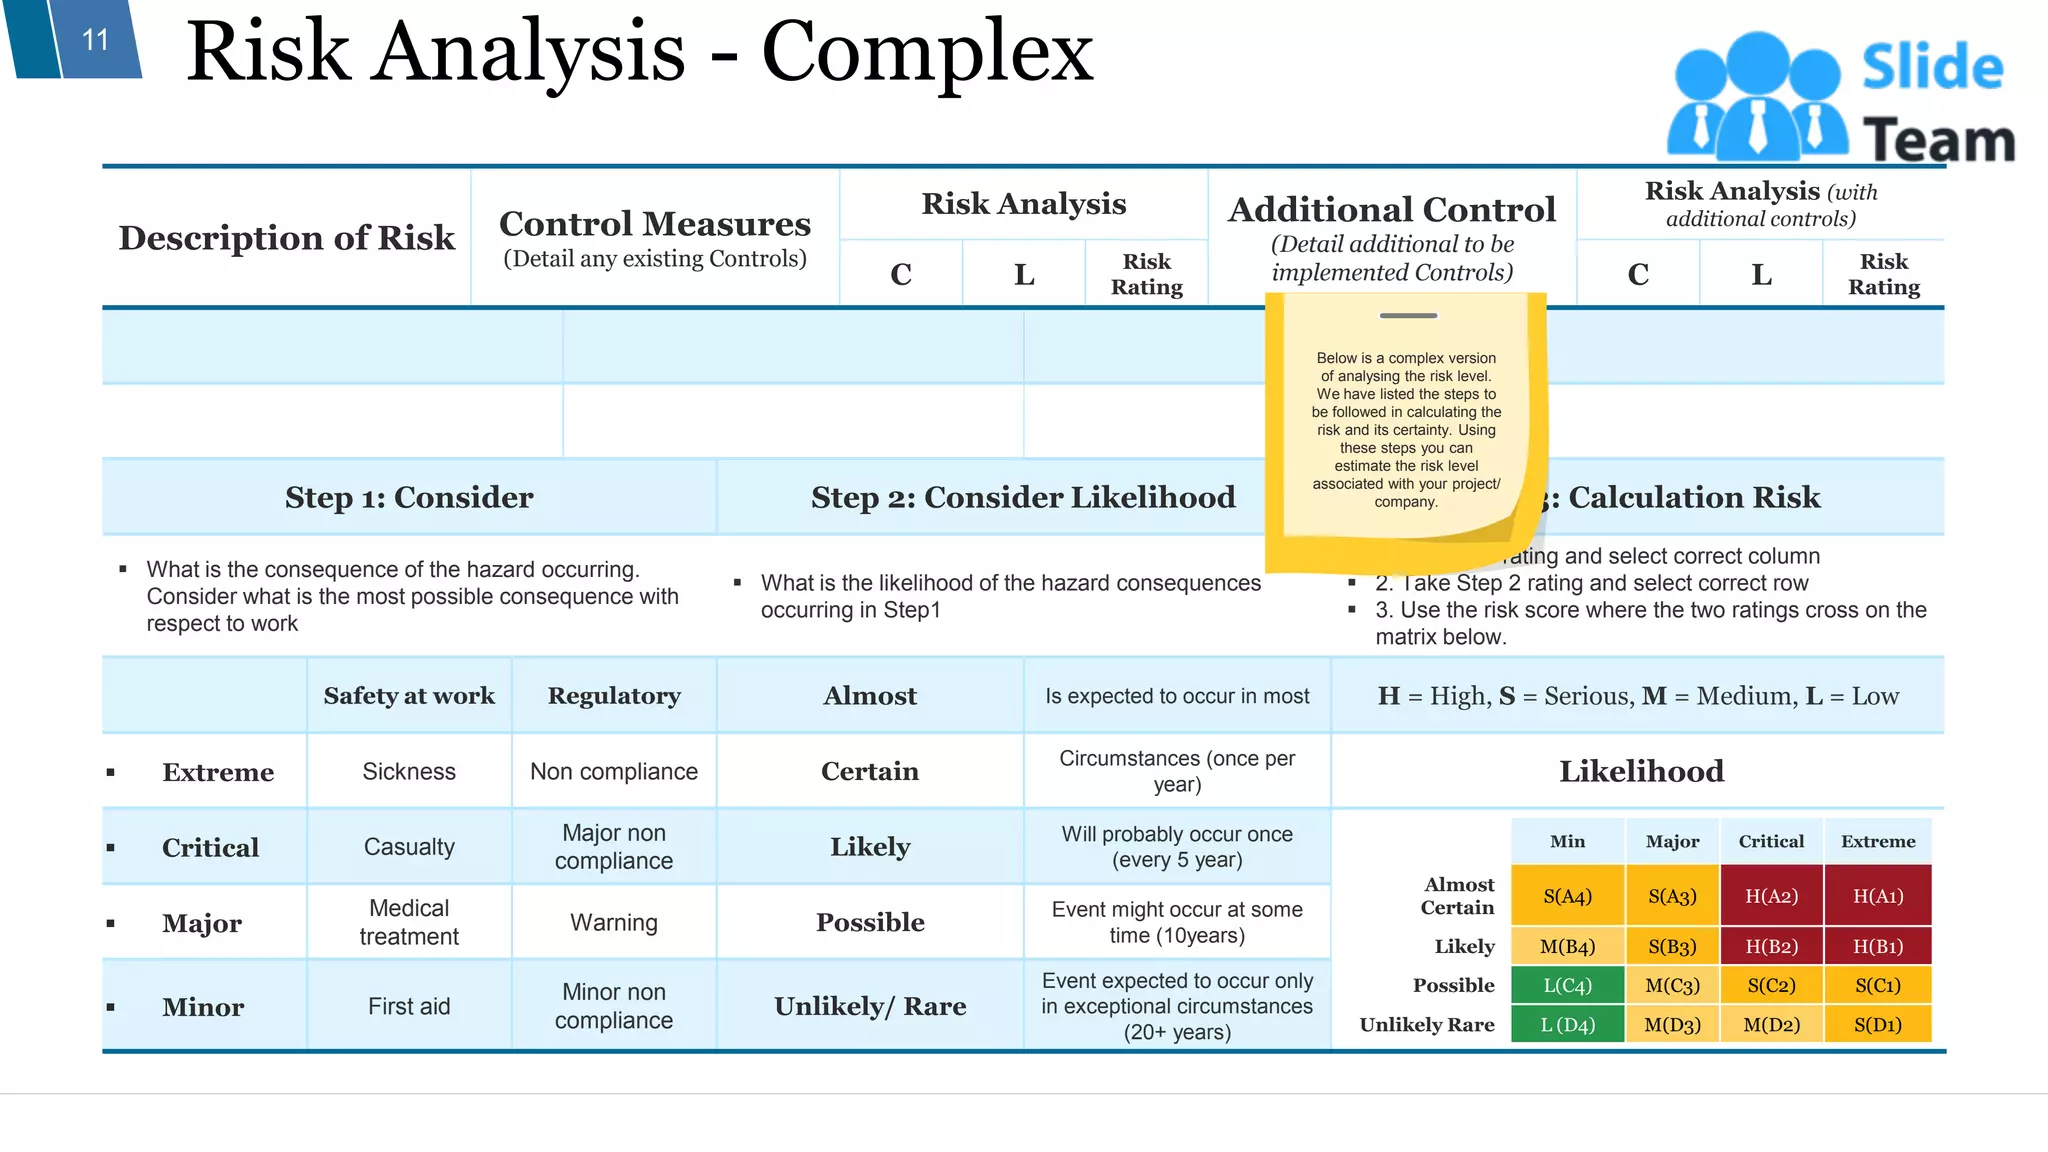
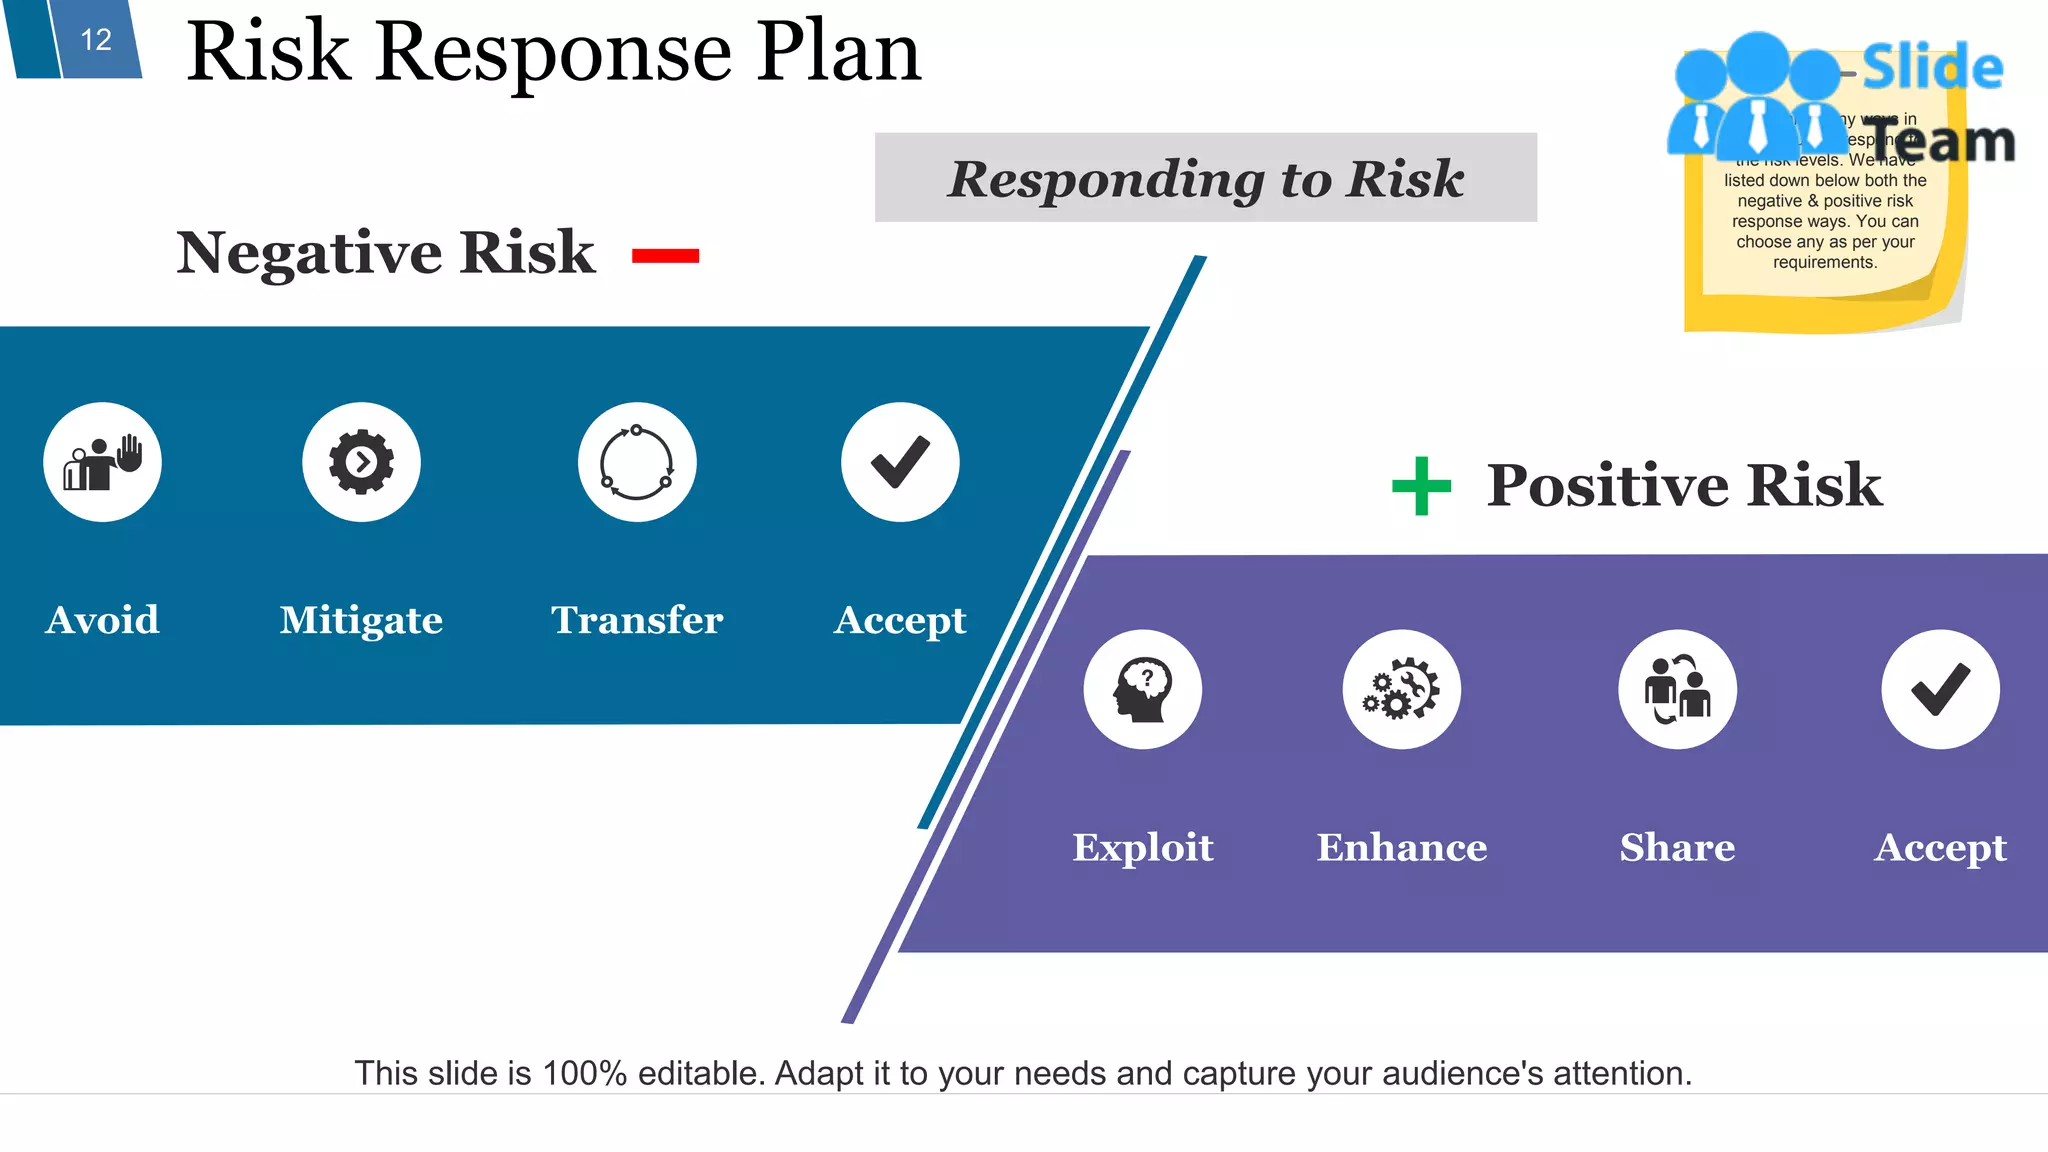
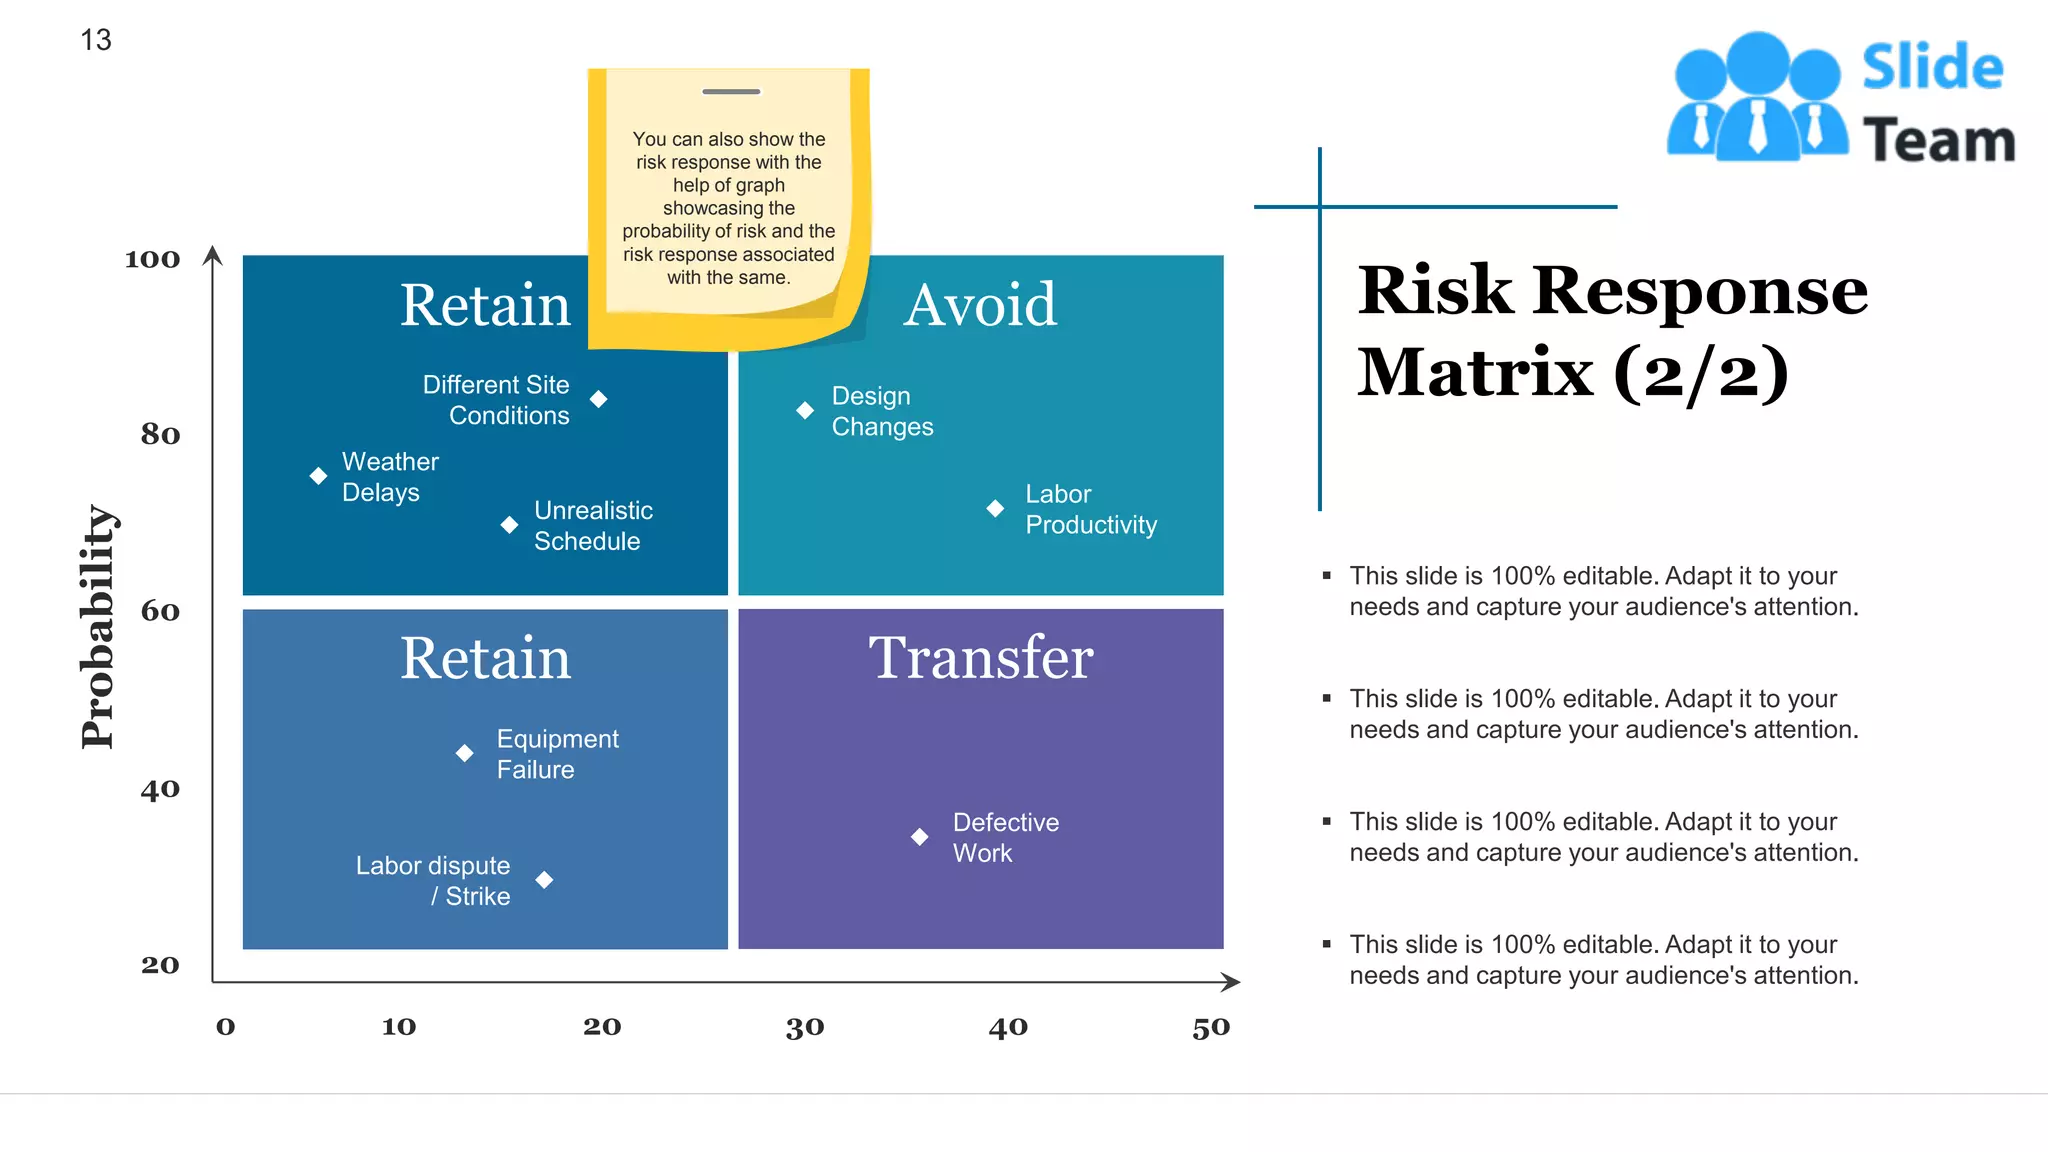
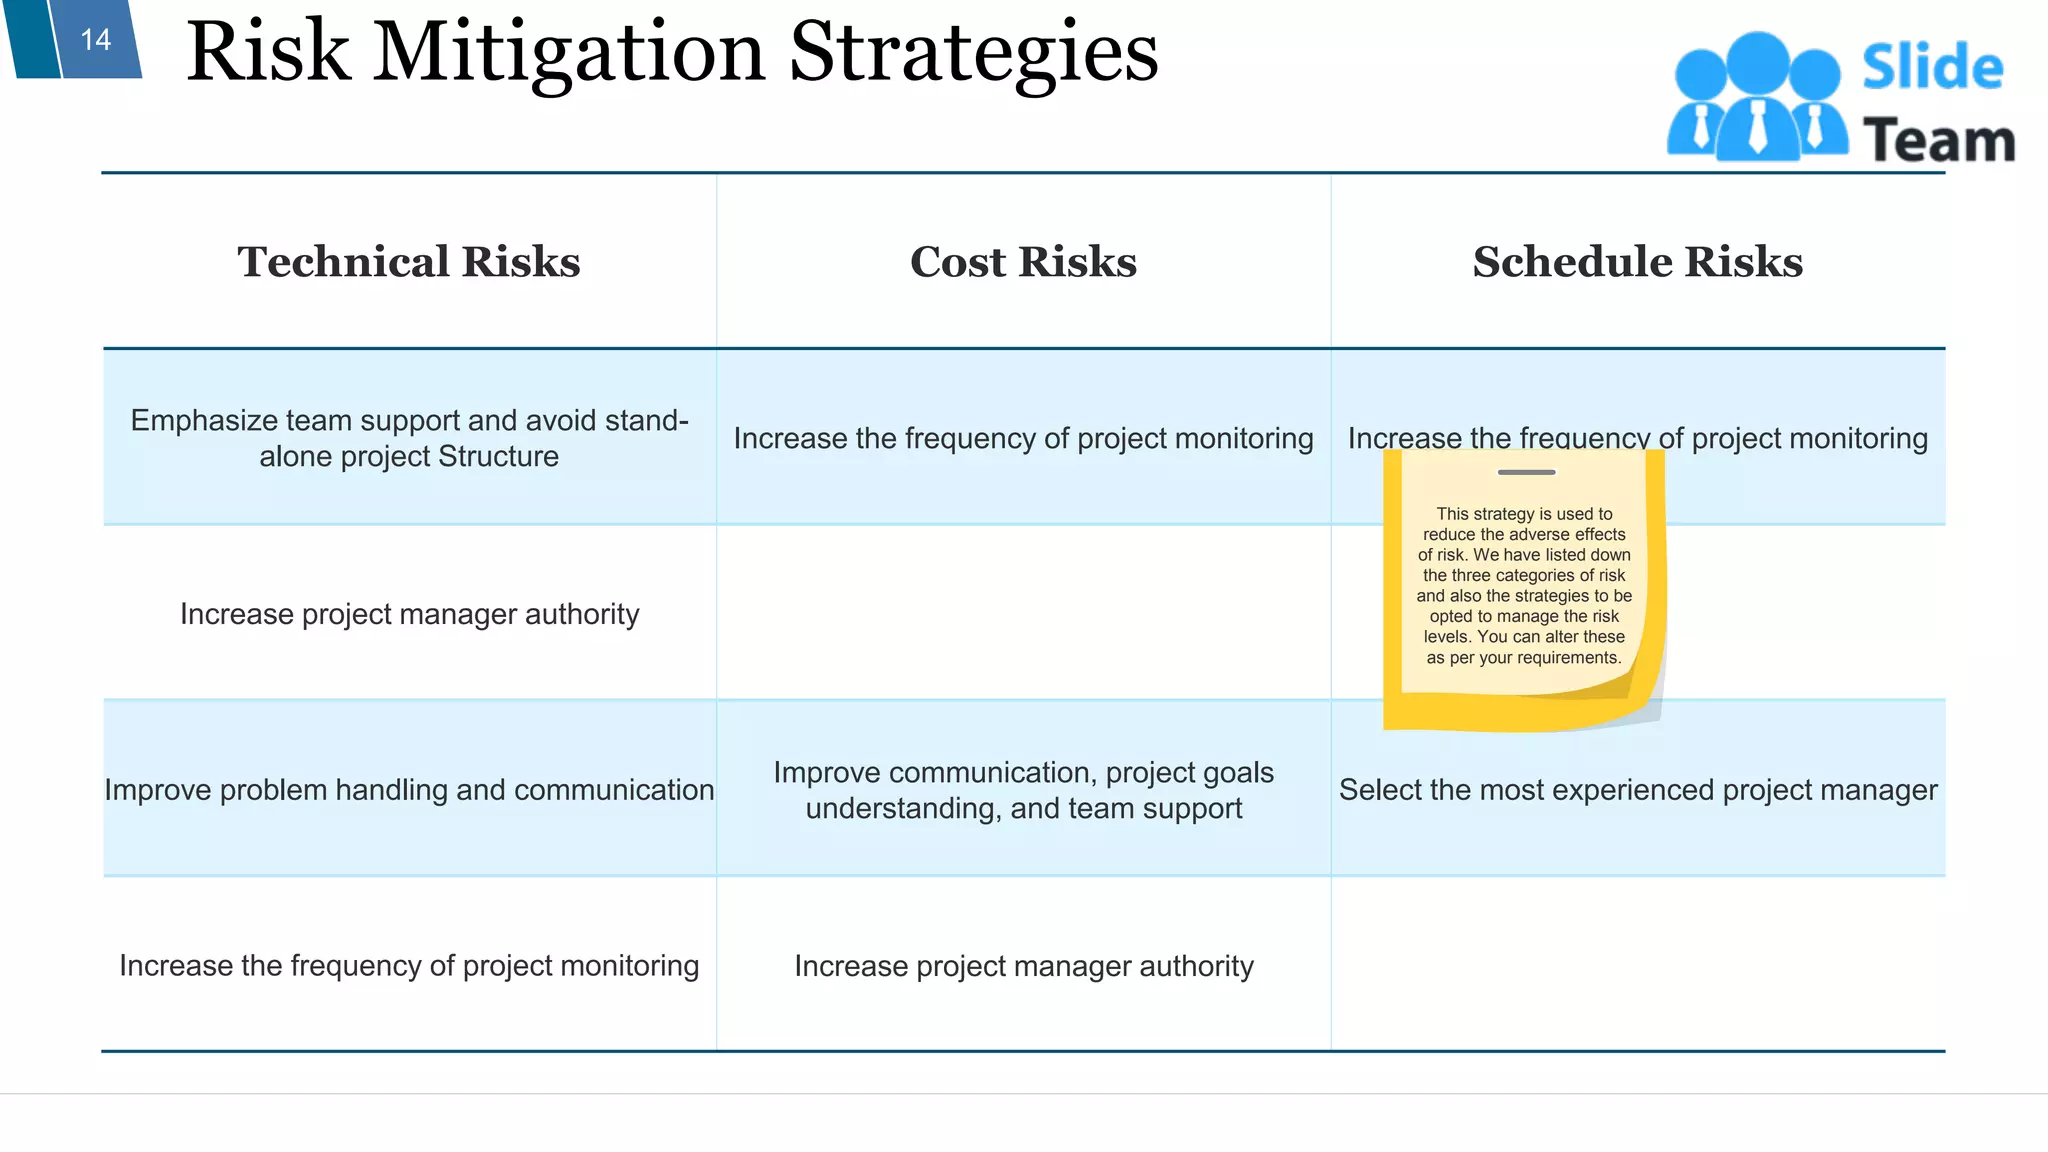
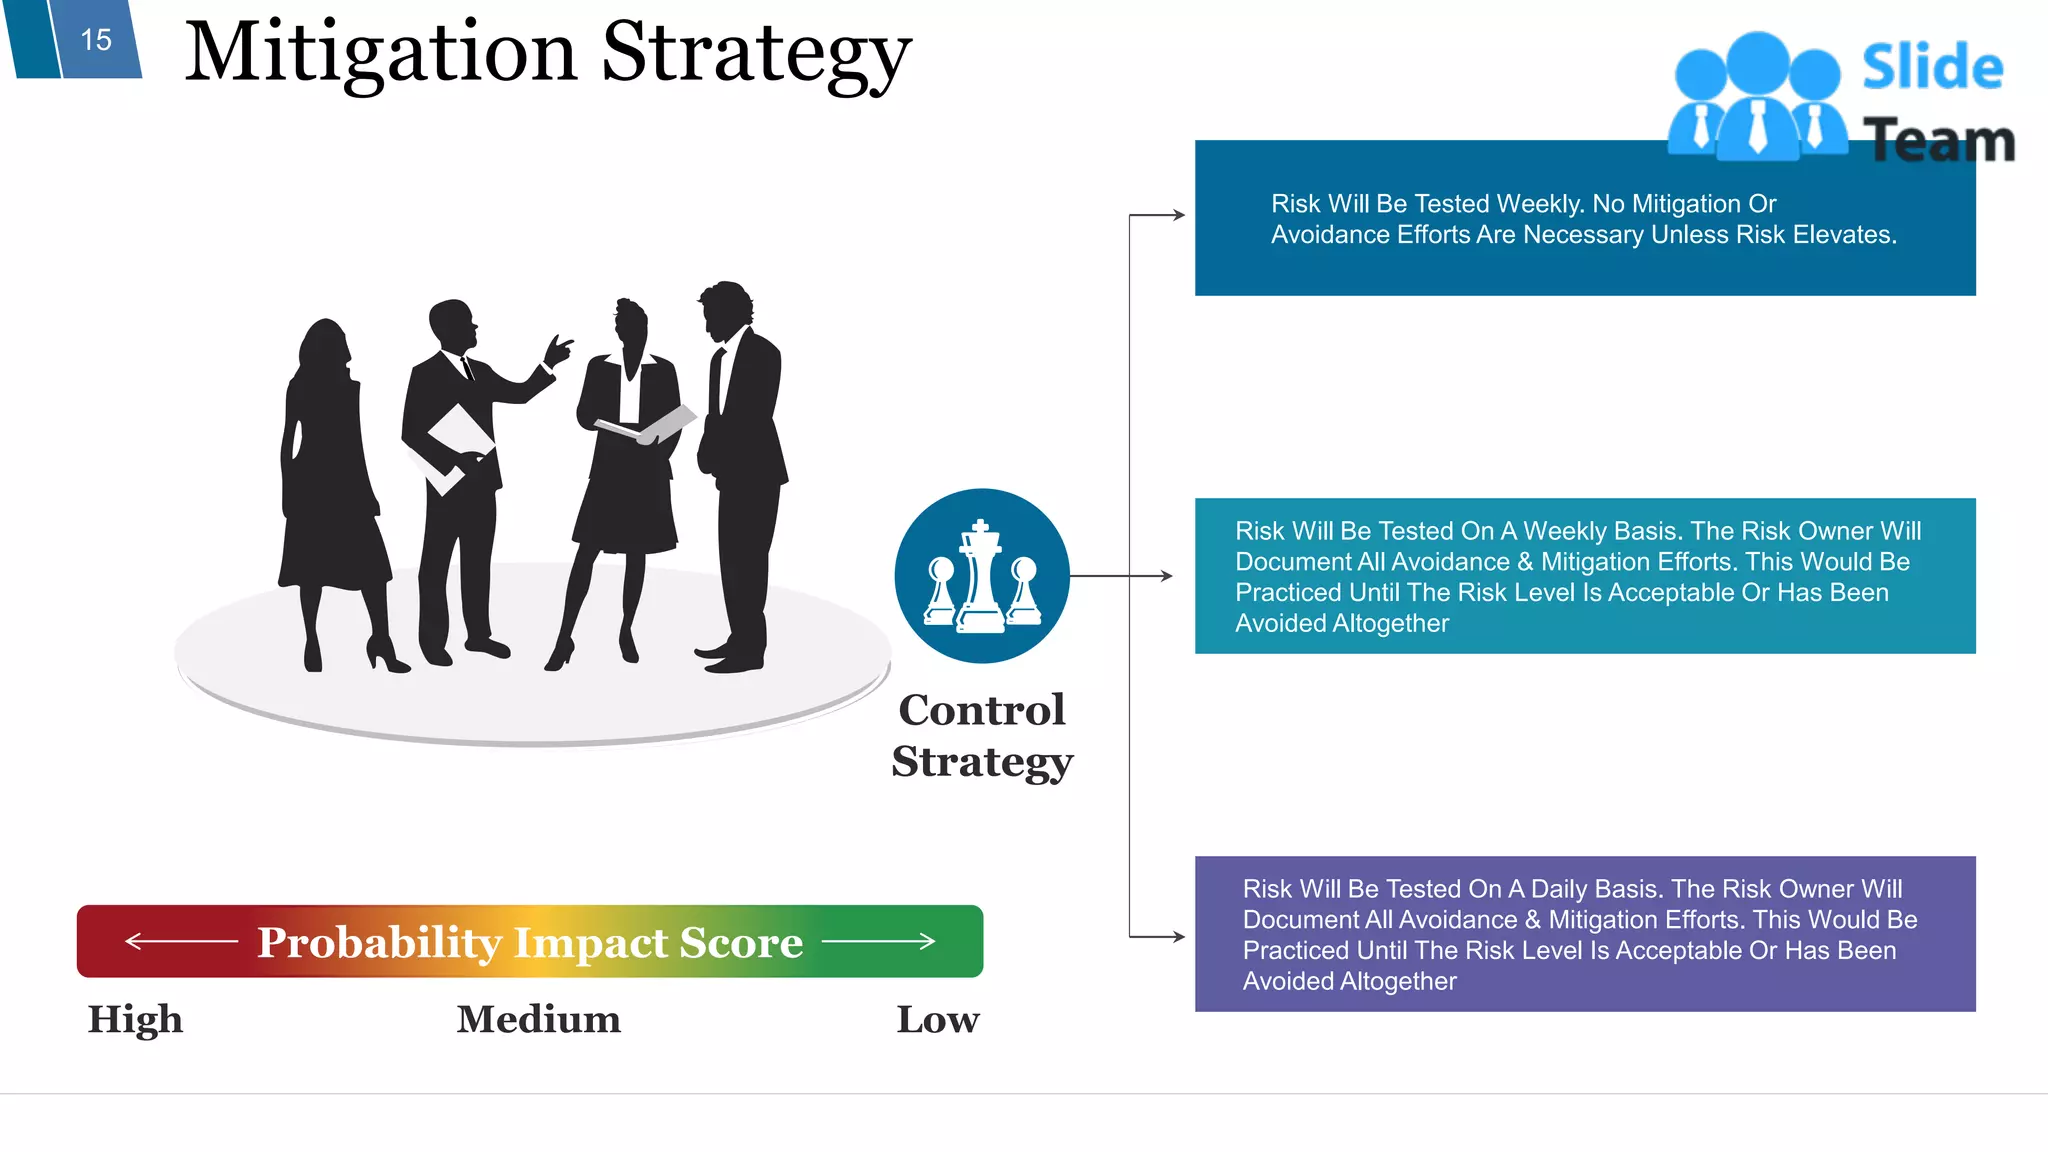
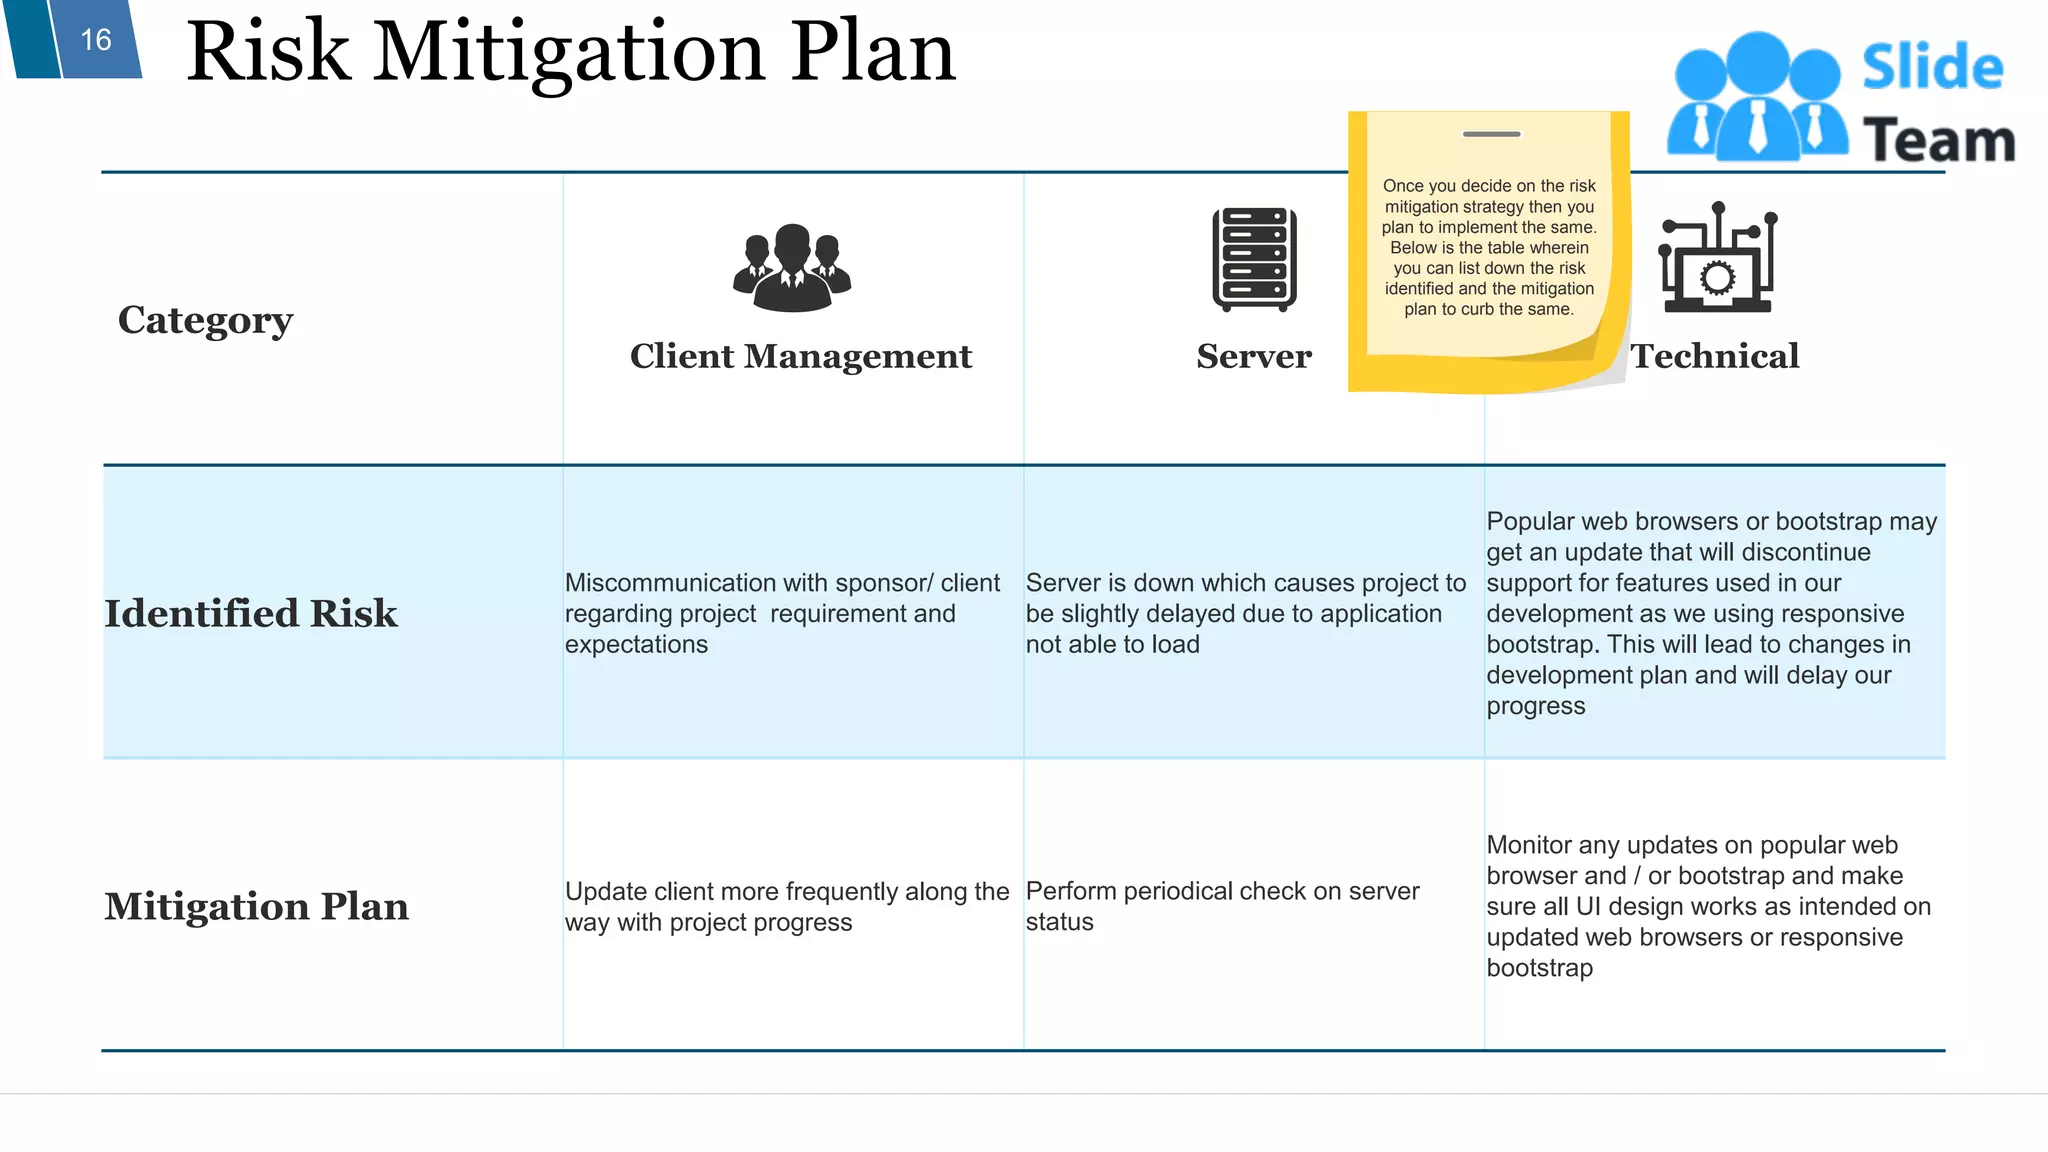
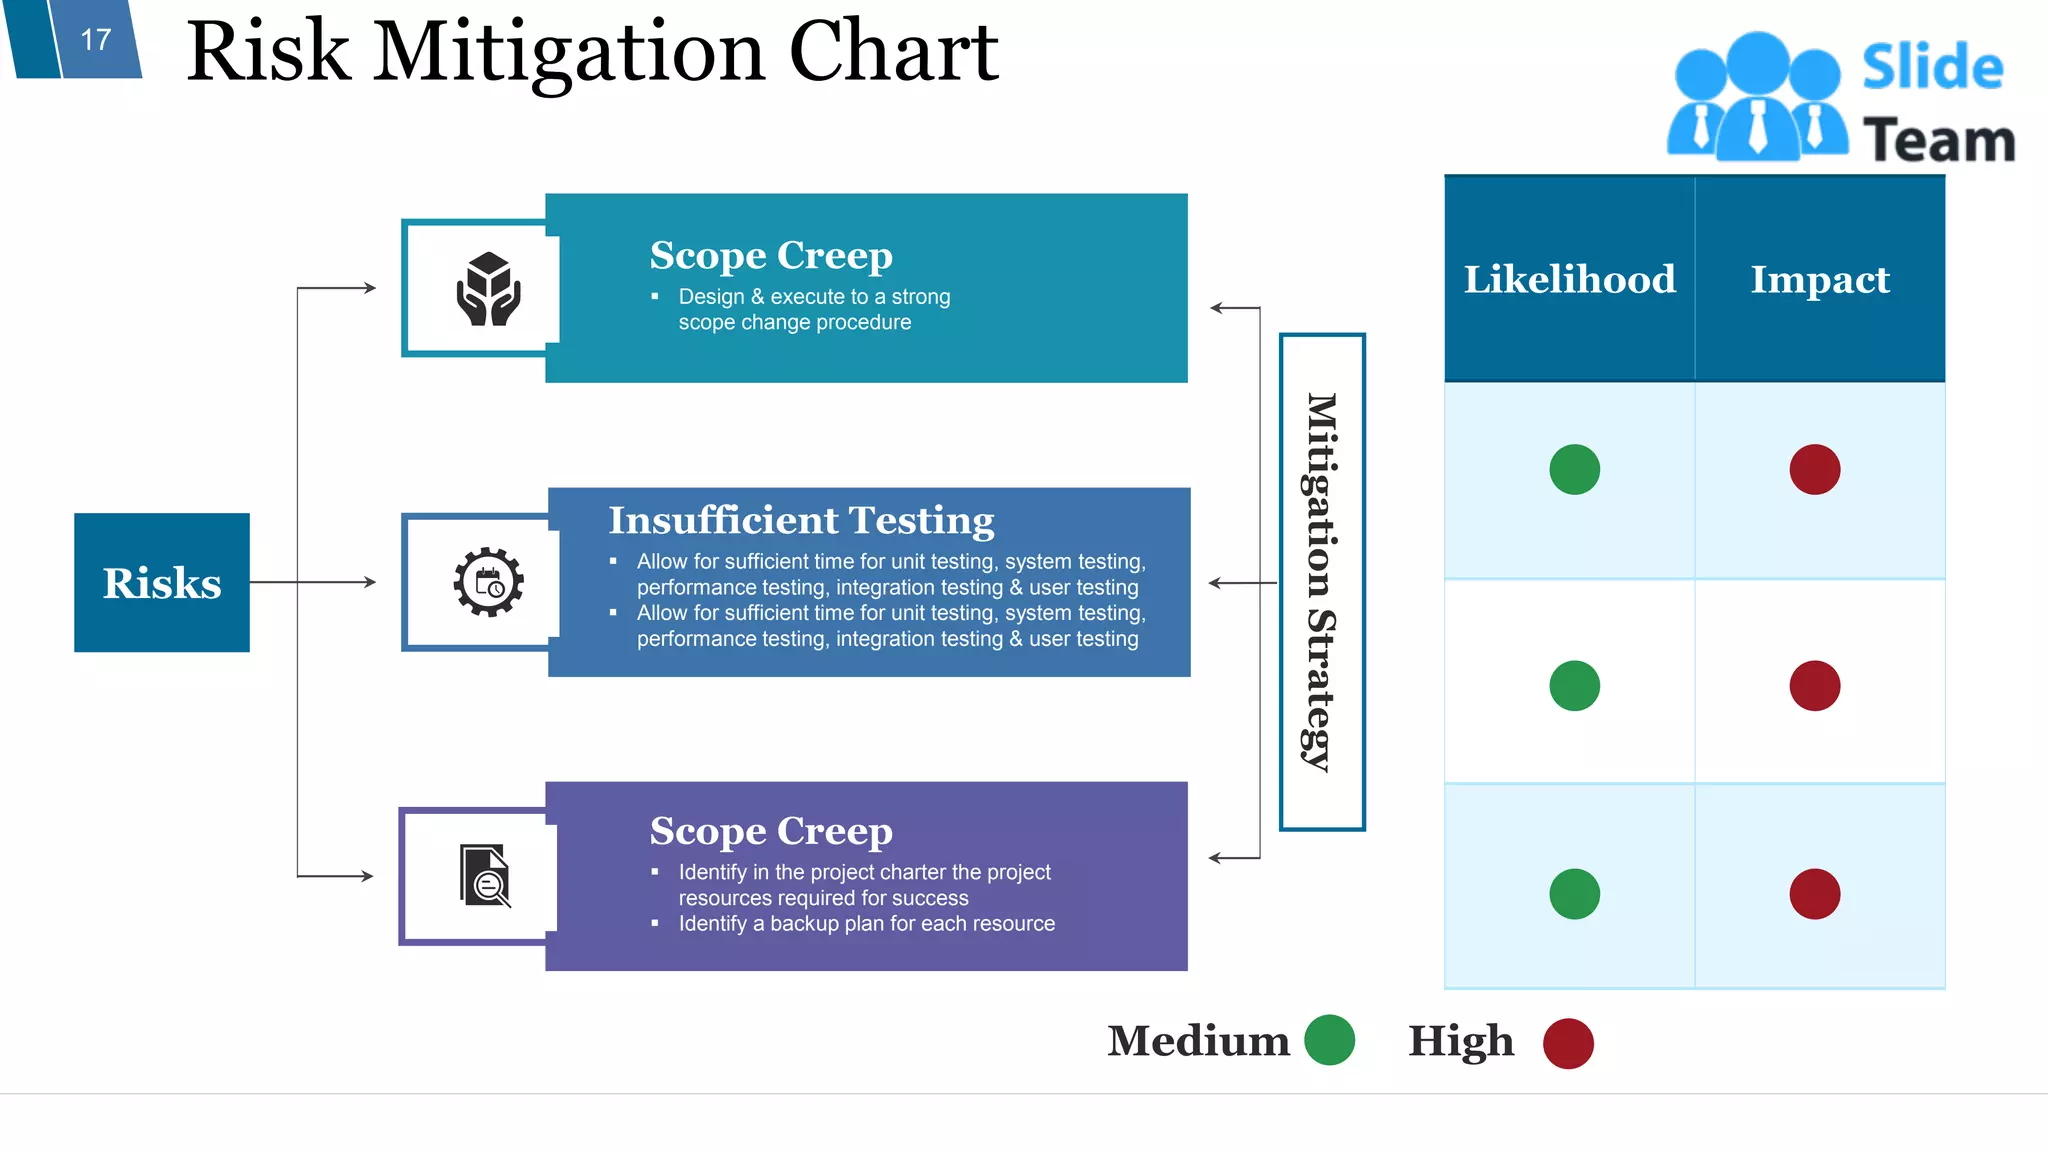
Risk Mitigation Strategy
Your Company Name
Content
2
Risk
Assessment
Risk Management
Plan
Risk Response
Matrix
Risk Mitigation
Chart
Risk Mitigation
Strategies
Risk
Analysis
Risk Control
Chart
Risk
Identification
Risk Mitigation
Plan
Risk
Tracker
Risk Response
Plan
Risk
Register
Risk Management Plan
3
Type Of
Risk
Outcome
Existing Risk
Treatment Actions
In Place
Rating
Proposed Risk
Treatment Actions To
Mitigate Risk
Additional
Resources
Target
Date
Person
Responsible
Strategic
risk
Performance
Deterioration
Proper assessment of
underlying strategies
2
Detailed understanding of the
market
Your Text Here 31/4/2018
John
Smith
Your Text
Here
Your Text
Here
Your Text Here Your Text Here Your Text Here Your Text Here
Your Text
Here
Your Text Here
Your Text
Here
Your Text
Here
Your Text Here Your Text Here Your Text Here Your Text Here
Your Text
Here
Your Text Here
Your Text
Here
Your Text
Here
Your Text Here Your Text Here Your Text Here Your Text Here
Your Text
Here
Your Text Here
Below is the
template to list
down the plan to
manage the types
of risks expected by
the company
4
Terminate
Treat
Transfer
Tolerate
Consequences
Likelihood
O
Risk Identification
(1/2)
▪ This slide is 100% editable. Adapt it to your
needs and capture your audience's attention.
▪ This slide is 100% editable. Adapt it to your
needs and capture your audience's attention.
▪ This slide is 100% editable. Adapt it to your
needs and capture your audience's attention.
▪ This slide is 100% editable. Adapt it to your
needs and capture your audience's attention.
This graph shows the
likelihood and impact
of risk on the company
and the strategy which
the company might opt
to mange the risk. You
can alter this as per
your
Risk Identification - Example
5
Equipment
(IT only)
Facility Personnel
Raw
Materials
Transportation
System
Utilities
Vendors
(Sourcing)
How Long Can
You Do Without?
5 days 0 days 0 days
30 days before new
deliveries
30 days in 2 days out
0 hours/power
0 hours/water
4 hours
Impact of Doing
Without?
After five days no way
to schedule production
or track orders
No production, potential
for bankruptcy, IT non-
existent
Degraded operations,
low service levels
None until on hard
exhausted
No suppliers
No deliveries
Extrusion shuts
down, lines cleaned,
waste collected and
prepared for grinder,
IT non-existent
No call centre
Vulnerabilities
?
No UPS/ generator.,
MD hardware, SPOF
SME
Metal building, flood
zone, poor
maintenance, no
perimeter security ,
door lock broken
Too many SPO
Single supplier
relationship
Location, design of entrance
Single power feed,
no generator or
backup water supply
Mercy of vendor
Contingency in
case of a
disaster?
Use paper reports for 5
days then go manual
for as many members
as possible
Look for warehouse
space, attempt to
salvage equipment and
restart operation, file
bankruptcy
Best effort shifting of
available staff, temps
Search for
alternatives supplier
None None Being in-house
We have given an
example of
identifying risk in
the below table, you
can alter the fields
as per your needs
Risk Identification (2/2)
6
Cost
▪ Budget Exceeded
▪ Unanticipated Expenditure
Resources
▪ Team is under-resourced
▪ Materials shortage
▪ Machinery unavailable
▪ Industrial Action
▪ Skills gap
Environmental
▪ Bad weather results in re-work
▪ Weather delays progress
▪ Adverse environmental effects occur
▪ Environmental approvals not complied with
Communication
▪ Poor communication
(Stakeholder dissatisfaction)
▪ Positive & timely
communications (positive
publicity)
Time
▪ Schedule overruns
▪ Tasks omitted from Schedule
▪ Opportunity to compress
Schedule’
Scope
▪ Scope creep
▪ Scope poorly defined
▪ Project changes poorly managed
Identify
Risks
This is another way of
identifying the types of risk
associated with a project
basis different types of
factors like cost, time,
resources etc. You can list
down the risk associated
with all/ some of these
factors as per your
requirements
Risk Register
7
Type
of Risk
Description
of Risk
Probability Impact Risk
Reduction
Strategy
Contingency
Plans
Risk
Owner
H M L Perf Cost Time
Text Here Text Here Text Here Text Here Text Her Text Here Text Here
Text Here Text Here Text Here Text Here Text Here Text Here Text Here
Maintain a risk
register to keep a
close track of all the
risks faced by the
company and their
impact on the
company performance
Risk Assessment
8
Risk Rating Guide
Probability Impact Impact
High (5)
▪ Major uncertainties remain
▪ No or little prior experience or data
▪ Infrastructure and/or resources not
in place
Performance, quality, cost or safety impacts resulting in major
redesign and program delay
Medium
(3)
▪ Some uncertainties remain
▪ Some experience and data exist
▪ Infrastructure in place but under-
resourced
Performance, quality, cost and/or safety impacts resulting in
minor redesign and schedule adjustment
Low (1)
▪ Few uncertainties remain
▪ Significant experience and data
exist
▪ Infrastructure in place and fully
Performance, quality, cost and safety requirements met within
planned schedule
Risk Scoring System
Consequences Likelihood of Occurrence Likelihood of detection
▪ No. direct effect on operating service level
▪ Minor deterioration in operating service level
▪ Definite reduction in operating service level
▪ Source deterioration in operating service level
▪ Operating service level approaches zero
▪ E. Probability of once in many years
▪ D. Probability of once in many operating months
▪ C. Probability of once in some operating weeks
▪ B. Probability of weekly occurrence
▪ A. Probability of daily occurrence
▪ Detectability is very high
▪ Considerable warning of failure before occurrence
▪ Some warning of failure before occurrence
▪ Little warning of failure before occurrence
▪ Detectability is effectively zero
Low Medium High
1 3 5 R
Show
stopper
High
5
5 15 25 O
Significant
risk
Medium
3
3 9 15 Y
Proceed
with
caution
Low
1
1 3 5 G No concern
We have listed the
framework for
assessing the risk
level. You can use
the same for risk
assessment
Risk Assessment (contd..)
9
Risk Scoring Results
Consequences
Insignificant Minor Moderate Major Catastrophic
Likelihood 1 2 3 4 5
A. Almost Certain - - - - -
B. Likely - - - - -
C. Possible - - - - -
D. Unlikely - - - - -
E. Rare - - - - -
Extreme Risk High Risk Moderate Risk Low Risk
Management responsibility should
be specified
Management responsibility should
be specified
Managed by specific
responsible person
Managed by
routine process
On the basis of the
framework, you can
obtain the risk score
and determine its
likelihood of
occurrence
Risk Analysis - Simplified Format
10
Risk Items (Potential Future
Problems Derived from
Brainstorming)
Likelihood of Risk Item
Occurring
Impact to Project if Risk
Item Does Occur
Priority (Likelihood * Impact)
New operating system may be
unstable
10 10 100
Communication problems over
system issues
8 9 72
We may not have the right
requirements
9 6 54
Requirements may change late
in the cycle
7 7 49
Database software may arrive
late
4 8 32
Key people might leave 2 10 20
Below is the simple
version of analysing the
risk level on the basis of
the mentioned
parameters. You can
alter these values &
parameters as per your
requirements
Risk Analysis - Complex
11
Description of Risk Control Measures
(Detail any existing Controls)
Risk Analysis Additional Control
(Detail additional to be
implemented Controls)
Risk Analysis (with
additional controls)
C L
Risk
Rating C L
Risk
Rating
Step 1: Consider Step 2: Consider Likelihood Step 3: Calculation Risk
▪ What is the consequence of the hazard occurring.
Consider what is the most possible consequence with
respect to work
▪ What is the likelihood of the hazard consequences
occurring in Step1
▪ Take Step 1 rating and select correct column
▪ 2. Take Step 2 rating and select correct row
▪ 3. Use the risk score where the two ratings cross on the
matrix below.
Safety at work Regulatory Almost Is expected to occur in most H = High, S = Serious, M = Medium, L = Low
▪ Extreme Sickness Non compliance Certain
Circumstances (once per
year) Likelihood
▪ Critical Casualty
Major non
compliance
Likely
Will probably occur once
(every 5 year)
▪ Major
Medical
treatment
Warning Possible
Event might occur at some
time (10years)
▪ Minor First aid
Minor non
compliance
Unlikely/ Rare
Event expected to occur only
in exceptional circumstances
(20+ years)
Min Major Critical Extreme
Almost
Certain
S(A4) S(A3) H(A2) H(A1)
Likely M(B4) S(B3) H(B2) H(B1)
Possible L(C4) M(C3) S(C2) S(C1)
Unlikely Rare L (D4) M(D3) M(D2) S(D1)
Below is a complex version
of analysing the risk level.
We have listed the steps to
be followed in calculating the
risk and its certainty. Using
these steps you can
estimate the risk level
associated with your project/
company.
Risk Response Plan
12
There are many ways in
which you can respond to
the risk levels. We have
listed down below both the
negative & positive risk
response ways. You can
choose any as per your
requirements.
This slide is 100% editable. Adapt it to your needs and capture your audience's attention.
Responding to Risk
Negative Risk
Mitigate Transfer
Avoid Accept
Positive Risk
Exploit Enhance Accept
Share
13
Probability
20
60
100
40
80
0 10 20 30 40 50
Retain
Different Site
Conditions
Unrealistic
Schedule
Weather
Delays
Transfer
Defective
Work
Retain
Labor dispute
/ Strike
Equipment
Failure
Avoid
Design
Changes
Labor
Productivity
▪ This slide is 100% editable. Adapt it to your
needs and capture your audience's attention.
▪ This slide is 100% editable. Adapt it to your
needs and capture your audience's attention.
▪ This slide is 100% editable. Adapt it to your
needs and capture your audience's attention.
▪ This slide is 100% editable. Adapt it to your
needs and capture your audience's attention.
Risk Response
Matrix (2/2)
You can also show the
risk response with the
help of graph
showcasing the
probability of risk and the
risk response associated
with the same.
Risk Mitigation Strategies
14
Technical Risks Cost Risks Schedule Risks
Emphasize team support and avoid stand-
alone project Structure
Increase the frequency of project monitoring Increase the frequency of project monitoring
Increase project manager authority
Improve problem handling and communication
Improve communication, project goals
understanding, and team support
Select the most experienced project manager
Increase the frequency of project monitoring Increase project manager authority
This strategy is used to
reduce the adverse effects
of risk. We have listed down
the three categories of risk
and also the strategies to be
opted to manage the risk
levels. You can alter these
as per your requirements.
Mitigation Strategy
15
Risk Will Be Tested Weekly. No Mitigation Or
Avoidance Efforts Are Necessary Unless Risk Elevates.
Risk Will Be Tested On A Weekly Basis. The Risk Owner Will
Document All Avoidance & Mitigation Efforts. This Would Be
Practiced Until The Risk Level Is Acceptable Or Has Been
Avoided Altogether
Risk Will Be Tested On A Daily Basis. The Risk Owner Will
Document All Avoidance & Mitigation Efforts. This Would Be
Practiced Until The Risk Level Is Acceptable Or Has Been
Avoided Altogether
Control
Strategy
High Medium Low
Probability Impact Score
Risk Mitigation Plan
16
Category
Client Management Server Technical
Identified Risk
Miscommunication with sponsor/ client
regarding project requirement and
expectations
Server is down which causes project to
be slightly delayed due to application
not able to load
Popular web browsers or bootstrap may
get an update that will discontinue
support for features used in our
development as we using responsive
bootstrap. This will lead to changes in
development plan and will delay our
progress
Mitigation Plan
Update client more frequently along the
way with project progress
Perform periodical check on server
status
Monitor any updates on popular web
browser and / or bootstrap and make
sure all UI design works as intended on
updated web browsers or responsive
bootstrap
Once you decide on the risk
mitigation strategy then you
plan to implement the same.
Below is the table wherein
you can list down the risk
identified and the mitigation
plan to curb the same.
Risk Mitigation Chart
17
Likelihood Impact
▪ Identify in the project charter the project
resources required for success
▪ Identify a backup plan for each resource
Scope Creep
▪ Allow for sufficient time for unit testing, system testing,
performance testing, integration testing & user testing
▪ Allow for sufficient time for unit testing, system testing,
performance testing, integration testing & user testing
Insufficient Testing
▪ Design & execute to a strong
scope change procedure
Scope Creep
Risks
Mitigation
Strategy
Medium High
Risk Control Matrix
18
Key
Process
Number
Process
Risk
Number
R
i
s
k
Control
Objective
Control
Number
Control
Description
Control
Owner
Process
Narrative
Control
Category
Control
type
Primary
Secondary
Control
Frequency
Design
Assessment
Text
Here
Text
Here
Text
Here
Text
Here
Text
Here
Text
Here
Text
Here
Text
Here
Text
Here
Text
Here
Text
Here
Text
Here
Text
Here
Text
Here
Text
Here
Text
Here
Text
Here
Text
Here
Text
Here
Text
Here
Text
Here
Text
Here
Text
Here
Text
Here
Text
Here
Text
Here
Text
Here
Text
Here
Prepare a risk control matrix
to have a close tap on the
risk related measures you
have intended to take. The
below table helps you to
keep a log of the control
measures you have decided
to take to manage the risk
levels.
Risk Tracker (1/2)
19
ID 01 02 03 04 05 06 07 08 09 10 11 12
Description of
Risk
Your
Text
Here
Your
Text
Here
Your
Text
Here
Text
Here
Text
Here
Text
Here
Text
Here
Text
Here
Text
Here
Text
Here
Text
Here
Text
Here
Impact
Text
Here
Text
Here
Text
Here
Text
Here
Text
Here
Text
Here
Text
Here
Text
Here
Text
Here
Text
Here
Text
Here
Text
Here
Risk Response
Text
Here
Text
Here
Text
Here
Text
Here
Text
Here
Text
Here
Text
Here
Text
Here
Text
Here
Text
Here
Text
Here
Text
Here
High Level
Text
Here
Text
Here
Text
Here
Text
Here
Text
Here
Text
Here
Text
Here
Text
Here
Text
Here
Text
Here
Text
Here
Text
Here
Risk Owner
Text
Here
Text
Here
Text
Here
Text
Here
Text
Here
Text
Here
Text
Here
Text
Here
Text
Here
Text
Here
Text
Here
Text
Here
Notes
Text
Here
Text
Here
Text
Here
Text
Here
Text
Here
Text
Here
Text
Here
Text
Here
Text
Here
Text
Here
Text
Here
Text
Here
Below is the template
which could be used to
track the risk factors
and how we are
planning to overcome
the same
Risk Item Tracking (2/2)
20
Risk Items Monthly Ranking Risk Resolution
This Month Last Month
Number of
months
Inadequate Planning 1 2 4 Working on revising the entire project plan
Poor Definition of Scope 2 3 3
Holding meetings with project customer and
sponsor to clarify scope
Absence of leadership 3 1 2
Just assigned a new project manager to lead the
project after old one quit
Poor Cost Estimates 4 4 3 Revisiting cost estimates
Poor time Estimates 5 5 3 Revisiting schedule estimates
Below is the template
which could be used to
track the risk factors
and the progress we
have made so far.
21
▪ This slide is 100% editable. Adapt it to your needs
and capture your audience's attention.
▪ This slide is 100% editable. Adapt it to your needs
and capture your audience's attention.
▪ This slide is 100% editable. Adapt it to your needs
and capture your audience's attention.
Coffee Break
15 min
Risk Mitigation Strategy
22
23
Charts &
Graphs
Stacked Bar
24
0 20 40 60 80 100
FY 01
FY 02
FY 03
FY 04 70%
55%
40%
30%
This graph/chart is linked to excel, and changes automatically based on data. Just left click on it and select “Edit Data”.
25
50%
30%
20%
▪ Product 01
This slide is 100% editable. Adapt it to your needs
and capture your audience's attention.
▪ Product 02
This slide is 100% editable. Adapt it to your needs
and capture your audience's attention.
▪ Product 03
This slide is 100% editable. Adapt it to your needs
and capture your audience's attention.
Donut
Pie Chart
This graph/chart is linked to excel, and changes automatically based on data. Just left click on it and select “Edit Data”.
Clustered Column - Line
26
0%
100%
200%
300%
400%
500%
600%
FY 01 FY 02 FY 03 FY 04
In
percentage
▪ Product 01 ▪ Product 02 ▪ Product 03
This graph/chart is linked to excel, and changes automatically based on data. Just left click on it and select “Edit Data”.
27
0
5
10
15
20
25
30
35
02-05-2017
07-05-2017
12-05-2017
16-05-2017
22-05-2017
▪ Product 01
This slide is 100% editable. Adapt it to your needs
and capture your audience's attention.
▪ Product 02
This slide is 100% editable. Adapt it to your needs
and capture your audience's attention.
Radar
Chart
This graph/chart is linked to excel, and changes automatically based on data. Just left click on it and select “Edit Data”.
28
Additional
Slides
29
▪ This slide is 100% editable. Adapt it to your needs
and capture your audience's attention.
▪ This slide is 100% editable. Adapt it to your needs
and capture your audience's attention.
▪ This slide is 100% editable. Adapt it to your needs
and capture your audience's attention.
▪ This slide is 100% editable. Adapt it to your needs
and capture your audience's attention.
Our
Mission
John Albert
Designation
This slide is 100% editable. Adapt
it to your needs and capture your
audience's attention.
Victoria Smith
Designation
This slide is 100% editable. Adapt
it to your needs and capture your
audience's attention.
Anita Parker
Designation
This slide is 100% editable. Adapt
it to your needs and capture your
audience's attention.
Our Team
30
31
About Company
▪ This slide is 100% editable. Adapt it to your needs
and capture your audience's attention.
▪ This slide is 100% editable. Adapt it to your needs
and capture your audience's attention.
▪ This slide is 100% editable. Adapt it to your needs
and capture your audience's attention.
32
Your Text Here
Your Text Here
Your Text Here
Your Text Here
01
02
▪ This slide is 100% editable. Adapt it to your
needs and capture your audience's attention.
▪ This slide is 100% editable. Adapt it to your
needs and capture your audience's attention.
▪ This slide is 100% editable. Adapt it to your
needs and capture your audience's attention.
▪ This slide is 100% editable. Adapt it to your
needs and capture your audience's attention.
Our Goal
Timeline
33
2017 25
Jan
This slide is 100%
editable. Adapt it to
your needs and
capture your
audience's attention.
10
Jun
This slide is 100%
editable. Adapt it to
your needs and
capture your
audience's attention.
12
Mar
This slide is 100%
editable. Adapt it to
your needs and
capture your
audience's attention.
23
Aug
This slide is 100%
editable. Adapt it to
your needs and
capture your
audience's attention.
Location
34
North America
50%
Asia
25%
Latin America
10%
Australia
15%
This slide is 100% editable. Adapt it to your needs and capture your audience's attention.
Post It
35
This slide is 100%
editable. Adapt it to your
needs and capture your
audience's attention.
This slide is 100%
editable. Adapt it to your
needs and capture your
audience's attention.
This slide is 100%
editable. Adapt it to your
needs and capture your
audience's attention.
This slide is 100%
editable. Adapt it to your
needs and capture your
audience's attention.
01 02 03 04
Financial
36
40%
This slide is 100%
editable. Adapt it to your
needs and capture your
audience's attention.
Minimum
50%
This slide is 100%
editable. Adapt it to your
needs and capture your
audience's attention.
Medium
60%
This slide is 100%
editable. Adapt it to your
needs and capture your
audience's attention.
Maximum
Our Target
37
This slide is 100% editable.
Adapt it to your needs and capture
your audience's attention.
This slide is 100% editable.
Adapt it to your needs and capture
your audience's attention.
This slide is 100% editable.
Adapt it to your needs and capture
your audience's attention.
38
01
04
03
02
▪ This slide is 100% editable. Adapt it to your
needs and capture your audience's attention.
▪ This slide is 100% editable. Adapt it to your
needs and capture your audience's attention.
▪ This slide is 100% editable. Adapt it to your
needs and capture your audience's attention.
▪ This slide is 100% editable. Adapt it to your
needs and capture your audience's attention.
Puzzle
Magnifying Glass
39
This slide is 100% editable.
Adapt it to your needs and capture
your audience's attention.
This slide is 100% editable.
Adapt it to your needs and capture
your audience's attention.
This slide is 100% editable. Adapt
it to your needs and capture your
audience's attention.
30%
50%
100%
40
▪ This slide is 100% editable. Adapt it to
your needs and capture your audience's
attention.
▪ This slide is 100% editable. Adapt it to
your needs and capture your audience's
attention.
▪ This slide is 100% editable. Adapt it to
your needs and capture your audience's
attention.
Bulb Or
Idea
41
Address
# street number, city, state
Contact Numbers:
0123456789
Email Address:
emailaddress@gmail.com
Thank You

Risk Mitigation Strategy Powerpoint Presentation Slides

  • 1.
  • 2.
    Content 2 Risk Assessment Risk Management Plan Risk Response Matrix RiskMitigation Chart Risk Mitigation Strategies Risk Analysis Risk Control Chart Risk Identification Risk Mitigation Plan Risk Tracker Risk Response Plan Risk Register
  • 3.
    Risk Management Plan 3 TypeOf Risk Outcome Existing Risk Treatment Actions In Place Rating Proposed Risk Treatment Actions To Mitigate Risk Additional Resources Target Date Person Responsible Strategic risk Performance Deterioration Proper assessment of underlying strategies 2 Detailed understanding of the market Your Text Here 31/4/2018 John Smith Your Text Here Your Text Here Your Text Here Your Text Here Your Text Here Your Text Here Your Text Here Your Text Here Your Text Here Your Text Here Your Text Here Your Text Here Your Text Here Your Text Here Your Text Here Your Text Here Your Text Here Your Text Here Your Text Here Your Text Here Your Text Here Your Text Here Your Text Here Your Text Here Below is the template to list down the plan to manage the types of risks expected by the company
  • 4.
    4 Terminate Treat Transfer Tolerate Consequences Likelihood O Risk Identification (1/2) ▪ Thisslide is 100% editable. Adapt it to your needs and capture your audience's attention. ▪ This slide is 100% editable. Adapt it to your needs and capture your audience's attention. ▪ This slide is 100% editable. Adapt it to your needs and capture your audience's attention. ▪ This slide is 100% editable. Adapt it to your needs and capture your audience's attention. This graph shows the likelihood and impact of risk on the company and the strategy which the company might opt to mange the risk. You can alter this as per your
  • 5.
    Risk Identification -Example 5 Equipment (IT only) Facility Personnel Raw Materials Transportation System Utilities Vendors (Sourcing) How Long Can You Do Without? 5 days 0 days 0 days 30 days before new deliveries 30 days in 2 days out 0 hours/power 0 hours/water 4 hours Impact of Doing Without? After five days no way to schedule production or track orders No production, potential for bankruptcy, IT non- existent Degraded operations, low service levels None until on hard exhausted No suppliers No deliveries Extrusion shuts down, lines cleaned, waste collected and prepared for grinder, IT non-existent No call centre Vulnerabilities ? No UPS/ generator., MD hardware, SPOF SME Metal building, flood zone, poor maintenance, no perimeter security , door lock broken Too many SPO Single supplier relationship Location, design of entrance Single power feed, no generator or backup water supply Mercy of vendor Contingency in case of a disaster? Use paper reports for 5 days then go manual for as many members as possible Look for warehouse space, attempt to salvage equipment and restart operation, file bankruptcy Best effort shifting of available staff, temps Search for alternatives supplier None None Being in-house We have given an example of identifying risk in the below table, you can alter the fields as per your needs
  • 6.
    Risk Identification (2/2) 6 Cost ▪Budget Exceeded ▪ Unanticipated Expenditure Resources ▪ Team is under-resourced ▪ Materials shortage ▪ Machinery unavailable ▪ Industrial Action ▪ Skills gap Environmental ▪ Bad weather results in re-work ▪ Weather delays progress ▪ Adverse environmental effects occur ▪ Environmental approvals not complied with Communication ▪ Poor communication (Stakeholder dissatisfaction) ▪ Positive & timely communications (positive publicity) Time ▪ Schedule overruns ▪ Tasks omitted from Schedule ▪ Opportunity to compress Schedule’ Scope ▪ Scope creep ▪ Scope poorly defined ▪ Project changes poorly managed Identify Risks This is another way of identifying the types of risk associated with a project basis different types of factors like cost, time, resources etc. You can list down the risk associated with all/ some of these factors as per your requirements
  • 7.
    Risk Register 7 Type of Risk Description ofRisk Probability Impact Risk Reduction Strategy Contingency Plans Risk Owner H M L Perf Cost Time Text Here Text Here Text Here Text Here Text Her Text Here Text Here Text Here Text Here Text Here Text Here Text Here Text Here Text Here Text Here Text Here Text Here Text Here Text Here Text Here Text Here Text Here Text Here Text Here Text Here Text Here Text Here Text Here Text Here Text Here Text Here Text Here Text Here Text Here Text Here Maintain a risk register to keep a close track of all the risks faced by the company and their impact on the company performance
  • 8.
    Risk Assessment 8 Risk RatingGuide Probability Impact Impact High (5) ▪ Major uncertainties remain ▪ No or little prior experience or data ▪ Infrastructure and/or resources not in place Performance, quality, cost or safety impacts resulting in major redesign and program delay Medium (3) ▪ Some uncertainties remain ▪ Some experience and data exist ▪ Infrastructure in place but under- resourced Performance, quality, cost and/or safety impacts resulting in minor redesign and schedule adjustment Low (1) ▪ Few uncertainties remain ▪ Significant experience and data exist ▪ Infrastructure in place and fully Performance, quality, cost and safety requirements met within planned schedule Risk Scoring System Consequences Likelihood of Occurrence Likelihood of detection ▪ No. direct effect on operating service level ▪ Minor deterioration in operating service level ▪ Definite reduction in operating service level ▪ Source deterioration in operating service level ▪ Operating service level approaches zero ▪ E. Probability of once in many years ▪ D. Probability of once in many operating months ▪ C. Probability of once in some operating weeks ▪ B. Probability of weekly occurrence ▪ A. Probability of daily occurrence ▪ Detectability is very high ▪ Considerable warning of failure before occurrence ▪ Some warning of failure before occurrence ▪ Little warning of failure before occurrence ▪ Detectability is effectively zero Low Medium High 1 3 5 R Show stopper High 5 5 15 25 O Significant risk Medium 3 3 9 15 Y Proceed with caution Low 1 1 3 5 G No concern We have listed the framework for assessing the risk level. You can use the same for risk assessment
  • 9.
    Risk Assessment (contd..) 9 RiskScoring Results Consequences Insignificant Minor Moderate Major Catastrophic Likelihood 1 2 3 4 5 A. Almost Certain - - - - - B. Likely - - - - - C. Possible - - - - - D. Unlikely - - - - - E. Rare - - - - - Extreme Risk High Risk Moderate Risk Low Risk Management responsibility should be specified Management responsibility should be specified Managed by specific responsible person Managed by routine process On the basis of the framework, you can obtain the risk score and determine its likelihood of occurrence
  • 10.
    Risk Analysis -Simplified Format 10 Risk Items (Potential Future Problems Derived from Brainstorming) Likelihood of Risk Item Occurring Impact to Project if Risk Item Does Occur Priority (Likelihood * Impact) New operating system may be unstable 10 10 100 Communication problems over system issues 8 9 72 We may not have the right requirements 9 6 54 Requirements may change late in the cycle 7 7 49 Database software may arrive late 4 8 32 Key people might leave 2 10 20 Below is the simple version of analysing the risk level on the basis of the mentioned parameters. You can alter these values & parameters as per your requirements
  • 11.
    Risk Analysis -Complex 11 Description of Risk Control Measures (Detail any existing Controls) Risk Analysis Additional Control (Detail additional to be implemented Controls) Risk Analysis (with additional controls) C L Risk Rating C L Risk Rating Step 1: Consider Step 2: Consider Likelihood Step 3: Calculation Risk ▪ What is the consequence of the hazard occurring. Consider what is the most possible consequence with respect to work ▪ What is the likelihood of the hazard consequences occurring in Step1 ▪ Take Step 1 rating and select correct column ▪ 2. Take Step 2 rating and select correct row ▪ 3. Use the risk score where the two ratings cross on the matrix below. Safety at work Regulatory Almost Is expected to occur in most H = High, S = Serious, M = Medium, L = Low ▪ Extreme Sickness Non compliance Certain Circumstances (once per year) Likelihood ▪ Critical Casualty Major non compliance Likely Will probably occur once (every 5 year) ▪ Major Medical treatment Warning Possible Event might occur at some time (10years) ▪ Minor First aid Minor non compliance Unlikely/ Rare Event expected to occur only in exceptional circumstances (20+ years) Min Major Critical Extreme Almost Certain S(A4) S(A3) H(A2) H(A1) Likely M(B4) S(B3) H(B2) H(B1) Possible L(C4) M(C3) S(C2) S(C1) Unlikely Rare L (D4) M(D3) M(D2) S(D1) Below is a complex version of analysing the risk level. We have listed the steps to be followed in calculating the risk and its certainty. Using these steps you can estimate the risk level associated with your project/ company.
  • 12.
    Risk Response Plan 12 Thereare many ways in which you can respond to the risk levels. We have listed down below both the negative & positive risk response ways. You can choose any as per your requirements. This slide is 100% editable. Adapt it to your needs and capture your audience's attention. Responding to Risk Negative Risk Mitigate Transfer Avoid Accept Positive Risk Exploit Enhance Accept Share
  • 13.
    13 Probability 20 60 100 40 80 0 10 2030 40 50 Retain Different Site Conditions Unrealistic Schedule Weather Delays Transfer Defective Work Retain Labor dispute / Strike Equipment Failure Avoid Design Changes Labor Productivity ▪ This slide is 100% editable. Adapt it to your needs and capture your audience's attention. ▪ This slide is 100% editable. Adapt it to your needs and capture your audience's attention. ▪ This slide is 100% editable. Adapt it to your needs and capture your audience's attention. ▪ This slide is 100% editable. Adapt it to your needs and capture your audience's attention. Risk Response Matrix (2/2) You can also show the risk response with the help of graph showcasing the probability of risk and the risk response associated with the same.
  • 14.
    Risk Mitigation Strategies 14 TechnicalRisks Cost Risks Schedule Risks Emphasize team support and avoid stand- alone project Structure Increase the frequency of project monitoring Increase the frequency of project monitoring Increase project manager authority Improve problem handling and communication Improve communication, project goals understanding, and team support Select the most experienced project manager Increase the frequency of project monitoring Increase project manager authority This strategy is used to reduce the adverse effects of risk. We have listed down the three categories of risk and also the strategies to be opted to manage the risk levels. You can alter these as per your requirements.
  • 15.
    Mitigation Strategy 15 Risk WillBe Tested Weekly. No Mitigation Or Avoidance Efforts Are Necessary Unless Risk Elevates. Risk Will Be Tested On A Weekly Basis. The Risk Owner Will Document All Avoidance & Mitigation Efforts. This Would Be Practiced Until The Risk Level Is Acceptable Or Has Been Avoided Altogether Risk Will Be Tested On A Daily Basis. The Risk Owner Will Document All Avoidance & Mitigation Efforts. This Would Be Practiced Until The Risk Level Is Acceptable Or Has Been Avoided Altogether Control Strategy High Medium Low Probability Impact Score
  • 16.
    Risk Mitigation Plan 16 Category ClientManagement Server Technical Identified Risk Miscommunication with sponsor/ client regarding project requirement and expectations Server is down which causes project to be slightly delayed due to application not able to load Popular web browsers or bootstrap may get an update that will discontinue support for features used in our development as we using responsive bootstrap. This will lead to changes in development plan and will delay our progress Mitigation Plan Update client more frequently along the way with project progress Perform periodical check on server status Monitor any updates on popular web browser and / or bootstrap and make sure all UI design works as intended on updated web browsers or responsive bootstrap Once you decide on the risk mitigation strategy then you plan to implement the same. Below is the table wherein you can list down the risk identified and the mitigation plan to curb the same.
  • 17.
    Risk Mitigation Chart 17 LikelihoodImpact ▪ Identify in the project charter the project resources required for success ▪ Identify a backup plan for each resource Scope Creep ▪ Allow for sufficient time for unit testing, system testing, performance testing, integration testing & user testing ▪ Allow for sufficient time for unit testing, system testing, performance testing, integration testing & user testing Insufficient Testing ▪ Design & execute to a strong scope change procedure Scope Creep Risks Mitigation Strategy Medium High
  • 18.
  • 19.
    Risk Tracker (1/2) 19 ID01 02 03 04 05 06 07 08 09 10 11 12 Description of Risk Your Text Here Your Text Here Your Text Here Text Here Text Here Text Here Text Here Text Here Text Here Text Here Text Here Text Here Impact Text Here Text Here Text Here Text Here Text Here Text Here Text Here Text Here Text Here Text Here Text Here Text Here Risk Response Text Here Text Here Text Here Text Here Text Here Text Here Text Here Text Here Text Here Text Here Text Here Text Here High Level Text Here Text Here Text Here Text Here Text Here Text Here Text Here Text Here Text Here Text Here Text Here Text Here Risk Owner Text Here Text Here Text Here Text Here Text Here Text Here Text Here Text Here Text Here Text Here Text Here Text Here Notes Text Here Text Here Text Here Text Here Text Here Text Here Text Here Text Here Text Here Text Here Text Here Text Here Below is the template which could be used to track the risk factors and how we are planning to overcome the same
  • 20.
    Risk Item Tracking(2/2) 20 Risk Items Monthly Ranking Risk Resolution This Month Last Month Number of months Inadequate Planning 1 2 4 Working on revising the entire project plan Poor Definition of Scope 2 3 3 Holding meetings with project customer and sponsor to clarify scope Absence of leadership 3 1 2 Just assigned a new project manager to lead the project after old one quit Poor Cost Estimates 4 4 3 Revisiting cost estimates Poor time Estimates 5 5 3 Revisiting schedule estimates Below is the template which could be used to track the risk factors and the progress we have made so far.
  • 21.
    21 ▪ This slideis 100% editable. Adapt it to your needs and capture your audience's attention. ▪ This slide is 100% editable. Adapt it to your needs and capture your audience's attention. ▪ This slide is 100% editable. Adapt it to your needs and capture your audience's attention. Coffee Break 15 min
  • 22.
  • 23.
  • 24.
    Stacked Bar 24 0 2040 60 80 100 FY 01 FY 02 FY 03 FY 04 70% 55% 40% 30% This graph/chart is linked to excel, and changes automatically based on data. Just left click on it and select “Edit Data”.
  • 25.
    25 50% 30% 20% ▪ Product 01 Thisslide is 100% editable. Adapt it to your needs and capture your audience's attention. ▪ Product 02 This slide is 100% editable. Adapt it to your needs and capture your audience's attention. ▪ Product 03 This slide is 100% editable. Adapt it to your needs and capture your audience's attention. Donut Pie Chart This graph/chart is linked to excel, and changes automatically based on data. Just left click on it and select “Edit Data”.
  • 26.
    Clustered Column -Line 26 0% 100% 200% 300% 400% 500% 600% FY 01 FY 02 FY 03 FY 04 In percentage ▪ Product 01 ▪ Product 02 ▪ Product 03 This graph/chart is linked to excel, and changes automatically based on data. Just left click on it and select “Edit Data”.
  • 27.
    27 0 5 10 15 20 25 30 35 02-05-2017 07-05-2017 12-05-2017 16-05-2017 22-05-2017 ▪ Product 01 Thisslide is 100% editable. Adapt it to your needs and capture your audience's attention. ▪ Product 02 This slide is 100% editable. Adapt it to your needs and capture your audience's attention. Radar Chart This graph/chart is linked to excel, and changes automatically based on data. Just left click on it and select “Edit Data”.
  • 28.
  • 29.
    29 ▪ This slideis 100% editable. Adapt it to your needs and capture your audience's attention. ▪ This slide is 100% editable. Adapt it to your needs and capture your audience's attention. ▪ This slide is 100% editable. Adapt it to your needs and capture your audience's attention. ▪ This slide is 100% editable. Adapt it to your needs and capture your audience's attention. Our Mission
  • 30.
    John Albert Designation This slideis 100% editable. Adapt it to your needs and capture your audience's attention. Victoria Smith Designation This slide is 100% editable. Adapt it to your needs and capture your audience's attention. Anita Parker Designation This slide is 100% editable. Adapt it to your needs and capture your audience's attention. Our Team 30
  • 31.
    31 About Company ▪ Thisslide is 100% editable. Adapt it to your needs and capture your audience's attention. ▪ This slide is 100% editable. Adapt it to your needs and capture your audience's attention. ▪ This slide is 100% editable. Adapt it to your needs and capture your audience's attention.
  • 32.
    32 Your Text Here YourText Here Your Text Here Your Text Here 01 02 ▪ This slide is 100% editable. Adapt it to your needs and capture your audience's attention. ▪ This slide is 100% editable. Adapt it to your needs and capture your audience's attention. ▪ This slide is 100% editable. Adapt it to your needs and capture your audience's attention. ▪ This slide is 100% editable. Adapt it to your needs and capture your audience's attention. Our Goal
  • 33.
    Timeline 33 2017 25 Jan This slideis 100% editable. Adapt it to your needs and capture your audience's attention. 10 Jun This slide is 100% editable. Adapt it to your needs and capture your audience's attention. 12 Mar This slide is 100% editable. Adapt it to your needs and capture your audience's attention. 23 Aug This slide is 100% editable. Adapt it to your needs and capture your audience's attention.
  • 34.
    Location 34 North America 50% Asia 25% Latin America 10% Australia 15% Thisslide is 100% editable. Adapt it to your needs and capture your audience's attention.
  • 35.
    Post It 35 This slideis 100% editable. Adapt it to your needs and capture your audience's attention. This slide is 100% editable. Adapt it to your needs and capture your audience's attention. This slide is 100% editable. Adapt it to your needs and capture your audience's attention. This slide is 100% editable. Adapt it to your needs and capture your audience's attention. 01 02 03 04
  • 36.
    Financial 36 40% This slide is100% editable. Adapt it to your needs and capture your audience's attention. Minimum 50% This slide is 100% editable. Adapt it to your needs and capture your audience's attention. Medium 60% This slide is 100% editable. Adapt it to your needs and capture your audience's attention. Maximum
  • 37.
    Our Target 37 This slideis 100% editable. Adapt it to your needs and capture your audience's attention. This slide is 100% editable. Adapt it to your needs and capture your audience's attention. This slide is 100% editable. Adapt it to your needs and capture your audience's attention.
  • 38.
    38 01 04 03 02 ▪ This slideis 100% editable. Adapt it to your needs and capture your audience's attention. ▪ This slide is 100% editable. Adapt it to your needs and capture your audience's attention. ▪ This slide is 100% editable. Adapt it to your needs and capture your audience's attention. ▪ This slide is 100% editable. Adapt it to your needs and capture your audience's attention. Puzzle
  • 39.
    Magnifying Glass 39 This slideis 100% editable. Adapt it to your needs and capture your audience's attention. This slide is 100% editable. Adapt it to your needs and capture your audience's attention. This slide is 100% editable. Adapt it to your needs and capture your audience's attention. 30% 50% 100%
  • 40.
    40 ▪ This slideis 100% editable. Adapt it to your needs and capture your audience's attention. ▪ This slide is 100% editable. Adapt it to your needs and capture your audience's attention. ▪ This slide is 100% editable. Adapt it to your needs and capture your audience's attention. Bulb Or Idea
  • 41.
    41 Address # street number,city, state Contact Numbers: 0123456789 Email Address: emailaddress@gmail.com Thank You