Downloaded 45 times


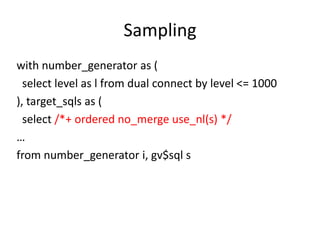
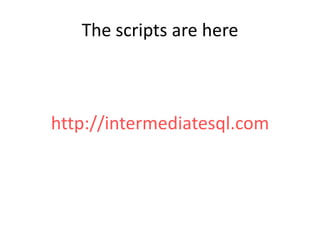
![Monitoring
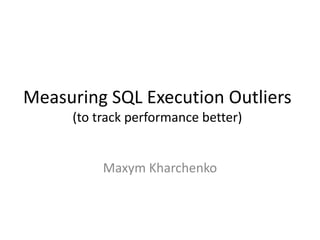
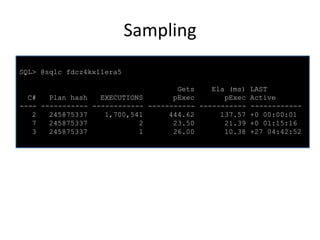
NAME
-----------------------------_sqlmon_binds_xml_format
_sqlmon_max_plan
VALUE
------default
480
_sqlmon_max_planlines
_sqlmon_recycle_time
_sqlmon_threshold
300
60
5
DESCRIPTION
-----------------------------------------------------------format of column binds_xml in [G]V$SQL_MONITOR
Maximum number of plans entry that can be monitored. Defaults
to 20 per CPU
Number of plan lines beyond which a plan cannot be monitored
Minimum time (in s) to wait before a plan entry can be recycled
CPU/IO time threshold before a statement is monitored. 0 is
disabled
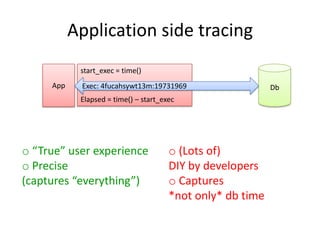
o Precise
(captures “everything”)
o SQL access to data
o Capture size is limited
(think: “seconds”)](https://image.slidesharecdn.com/kharchenko-outliers-140211120833-phpapp01/85/Finding-SQL-execution-outliers-36-320.jpg)
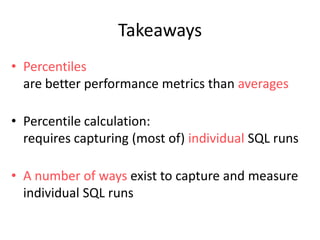


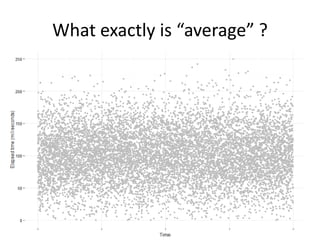
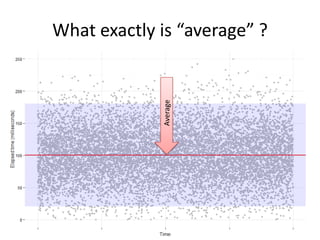
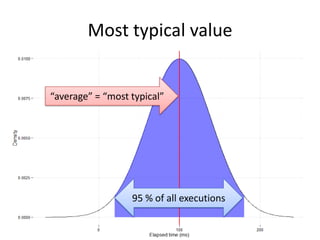
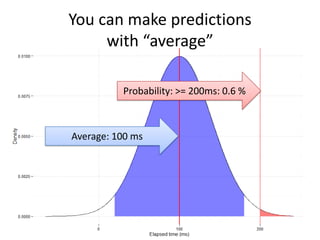
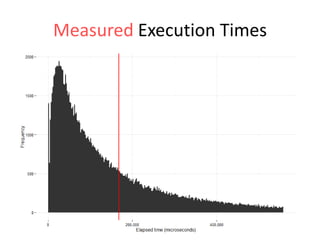
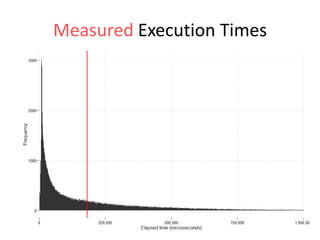
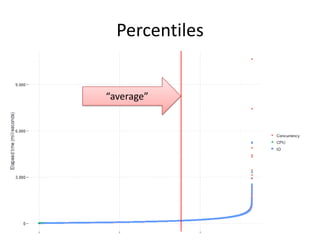
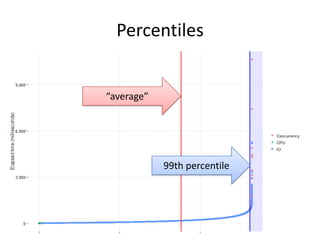
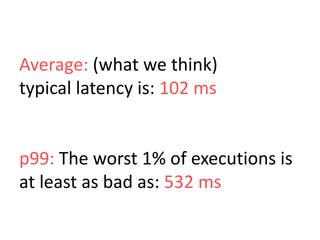
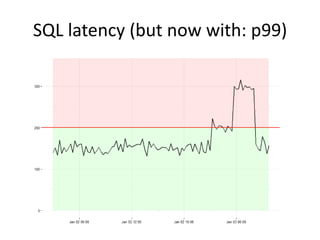
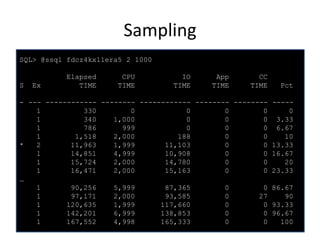
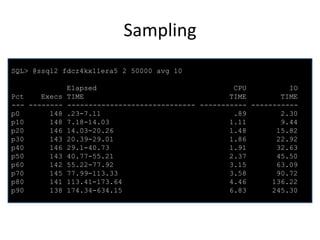
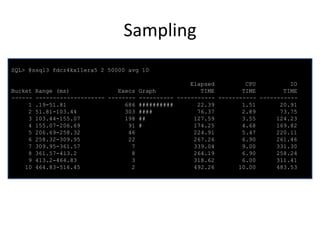
The document discusses the measurement of SQL execution outliers to improve performance tracking, emphasizing the limitations of average execution times in favor of percentiles for more accurate assessment. It outlines methods for capturing individual query times both on the application and database sides, detailing the importance of these metrics for understanding user experience and SQL latency. The takeaways highlight the need for capturing individual SQL runs to accurately calculate percentiles, which provide better insights into performance than mere averages.