Download as PDF, PPTX


![(No)Correlation ..why?
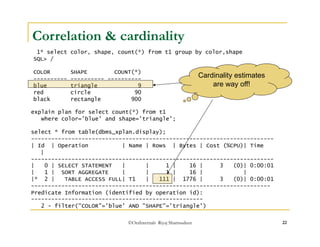
Selectivity of first single column predicate
color = ‘blue’ is 1/3.
Selectivity of next single column predicate
shape=‘triangle’ is 1/3.
Combined selectivity of both predicates are
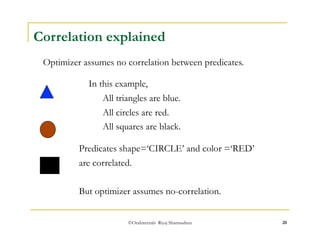
Optimizer assumes no
Correlation between
Predicates.
sel(p1) * sel(p2) =(1/3)*(1/3)=1/9 [ Probablity theory ]
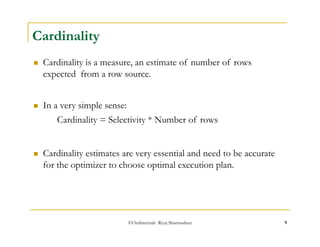
Cardinality estimates, then, becomes
999 * (1/9) = 111
©OraInternals Riyaj Shamsudeen 23](https://image.slidesharecdn.com/introductiontocbo-141006153428-conversion-gate01/85/Demystifying-cost-based-optimization-23-320.jpg)
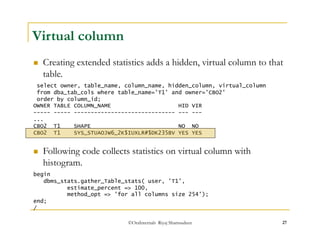


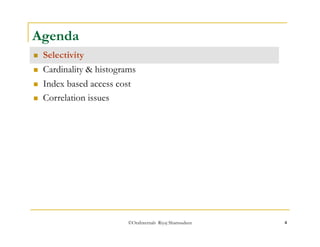
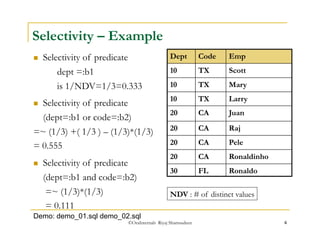
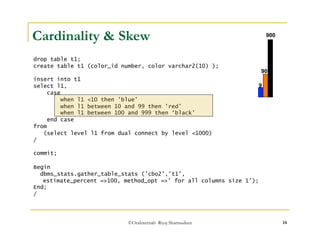
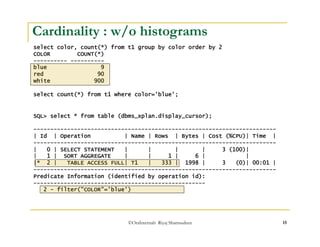
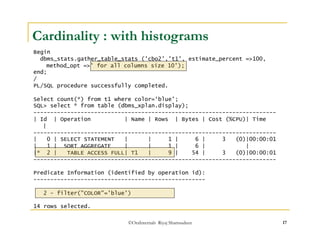
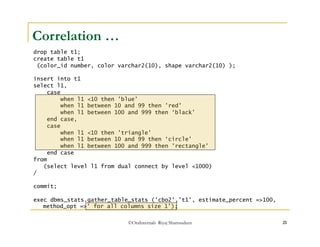
This document provides an introduction to cost based optimization. It discusses key concepts like selectivity, cardinality, histograms, and correlation issues. The author is Riyaj Shamsudeen, an Oracle expert with 18 years of experience. Sample code and examples are provided to illustrate how to calculate selectivity and cardinality accurately to improve query optimization. Extended statistics are highlighted as a way to address correlation between column predicates in Oracle 11g and above.