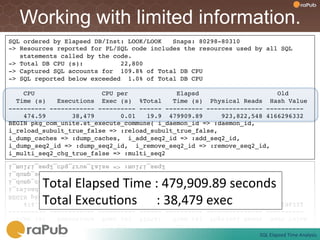
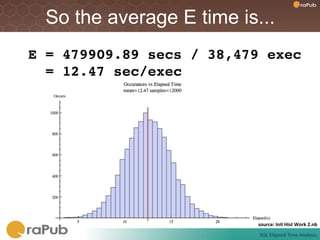
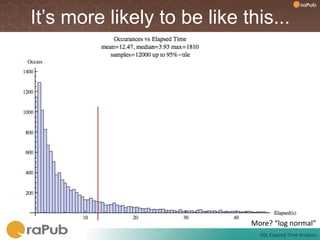
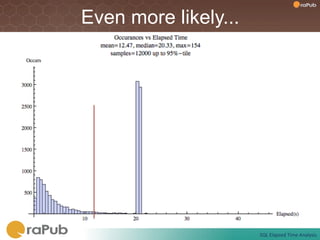
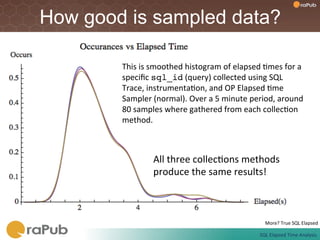
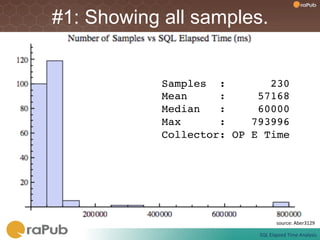
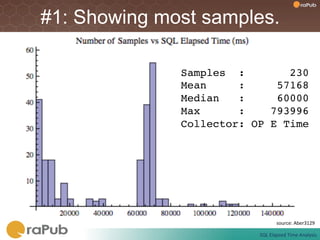
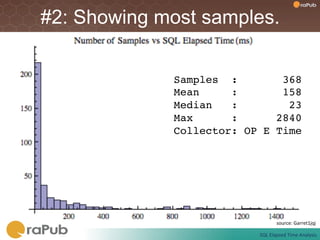
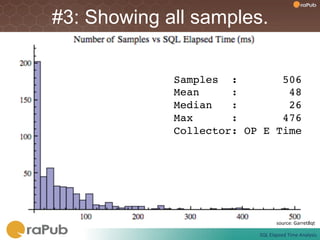
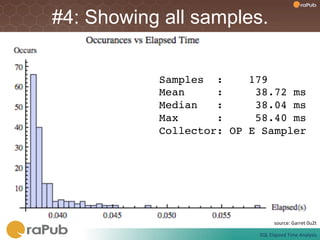
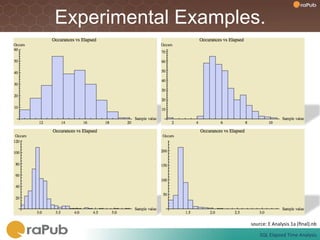
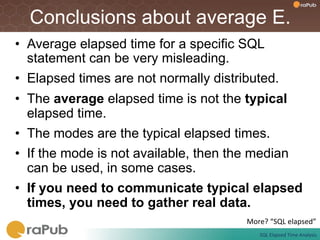
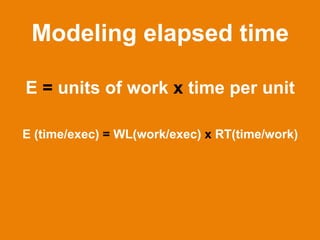
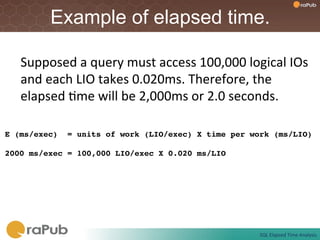
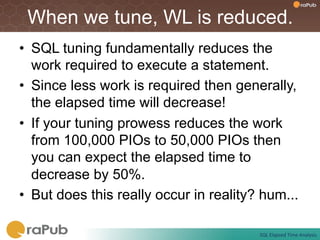
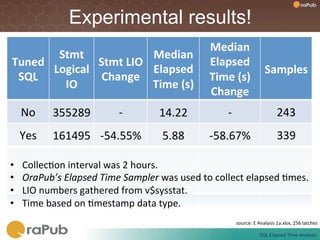
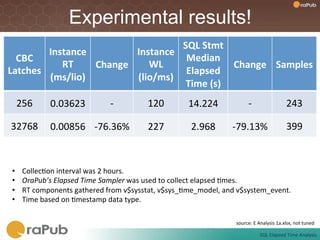
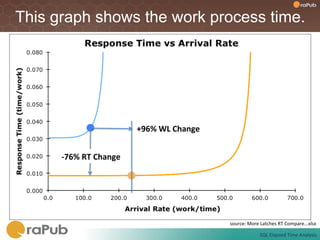
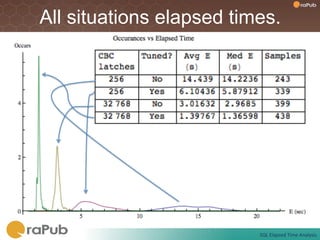
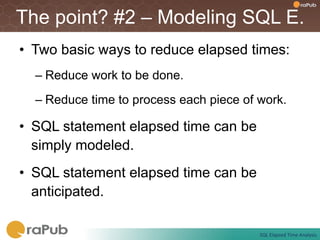
SQL
Elapsed Time
  Analysis


  Craig A. Shallahamer
 Founder - OraPub, Inc.
   craig@orapub.com


                SQL	
  Elapsed	
  Time	
  Analysis	
  
OraPub is about Oracle performance.
•  OraPub is all about Oracle performance           Resources	
  
   management; systematic and quantitative
   firefighting and predictive analysis.
                                                    • 	
  Training	
  
•  Web site started in 1995 and the company was
   founded in 1998 by Craig Shallahamer.            • 	
  Unique	
  Blog	
  
•  OraPub has always been about disseminating       • 	
  Free	
  Tools	
  
   Oracle database centric technical information.

•  Consulting, training, books, papers, and         • 	
  Free	
  Papers	
  
   products are now being offered.
                                                    • 	
  Books	
  
•  We have been on-site in 24 countries and our
   resources have been received in probably         • 	
  Products	
  
   every country where there are DBAs.
                                                    • 	
  Consul8ng	
  
                                                               SQL	
  Elapsed	
  Time	
  Analysis	
  
Short resume...kind of...
•  Studies economics, mathematics, and computer science at
   university in California, US.
•  Started working with Oracle technology in 1989 as a Forms 2.3
   developer on Oracle version 5.
•  Soon after started performance firefighting...daily!
•  Co-found both Oracle’s Core Technology and System
   Performance Groups.
•  Left Oracle to start OraPub, Inc. in 1998.
•  Authored 24 technical papers and worked in 24 countries.
•  Authors and teaches his classes Oracle Performance
   Firefighting, Adv Oracle Performance Analysis, and Oracle
   Forecasting & Predictive Analysis.
•  Authored the books, Forecasting Oracle Performance and
   Oracle Performance Firefighting.
•  Oracle ACE Director.
•  Frequent blog contributor: A Wider View

                                                                   SQL	
  Elapsed	
  Time	
  Analysis	
  
My two books...


      OraPub	
  discount	
  code:	
  IS11	


                                                SQL	
  Elapsed	
  Time	
  Analysis	
  
One presentation with two parts.


•  “The average” can be misleading.

•  Modeling E time leads to insights.


                              SQL	
  Elapsed	
  Time	
  Analysis	
  
Working with limited information.
SQL ordered by Elapsed DB/Inst: LOOK/LOOK   Snaps: 80298-80310!
-> Resources reported for PL/SQL code includes the resources used by all SQL!
   statements called by the code.!
-> Total DB CPU (s):          22,800!
-> Captured SQL accounts for 109.8% of Total DB CPU!
-> SQL reported below exceeded 1.0% of Total DB CPU!
!
    CPU                  CPU per             Elapsd                     Old!
  Time (s)   Executions Exec (s) %Total     Time (s) Physical Reads Hash Value!
---------- ------------ ---------- ------ ---------- --------------- ----------!
    474.59       38,479       0.01    19.9 479909.89     923,822,548 4166296332!
BEGIN pkg_com_unite.st_execute_commune( i_daemon_id => :daemon_id, !
i_reload_subult_true_false => :reload_subult_true_false, !
i_dump_caches => :dump_caches, i_add_seq2_id => :add_seq2_id, !
i_dump_seq2_id => :dump_seq2_id, i_remove_seq2_id => :remove_seq2_id, !
i_multi_seq2_chg_true_false => :multi_seq2!


        Total	
  Elapsed	
  Time	
  :	
  479,909.89	
  seconds	
  
        Total	
  ExecuFons	


  :	
  38,479	
  exec	
  

                                                                   SQL	
  Elapsed	
  Time	
  Analysis	
  
So the average E time is...
E = 479909.89 secs / 38,479 exec!
  = 12.47 sec/exec!


                           source:	
  Init	
  Hist	
  Work	
  2.nb	
  
                            SQL	
  Elapsed	
  Time	
  Analysis	
  
It’s more likely to be like this...


                             More?	
  “log	
  normal”	
  
                                SQL	
  Elapsed	
  Time	
  Analysis	
  
Even more likely...


                      SQL	
  Elapsed	
  Time	
  Analysis	
  
What can we do?

 We don’t want to mislead others.

  We need to truly understand the
situation if we are making decisions
     based on this information.

                                SQL	
  Elapsed	
  Time	
  Analysis	
  
We have a variety of collection options.
 •    SQL Trace. Valid option.
       –  Must have ability to parse the trace files producing E times.
       –  Can trace on sql_id.
       –  Must be the production system.
 •    Instrument SQL. Valid option.
       –  May not be practical or possible.
 •    Stopwatch. Risky.
       –  Limited scope and very few samples.
       –  OK for a specific user situation.
 •    Benchmark or Isolated Testing. Very risky.
       –  If you want real results, you need a real situation (HW, data, arrivals, concurrency).
 •    OraPub E Time Collector. Valid, but grabs a core.
       –  Free tool. OraPub search: “sql elapsed time”
       –  Gathers at sql_id and plan_hash_value level.
       –  Grabs and holds a CPU core, ouch!
 •    OraPub E Sampler. Valid but not free.
       –    Un-noticeable impact with same results as tracing or instrumentation!
       –    Gathers at sql_id level and samples stored in Oracle table.
       –    Licensed like a box of candy.
       –    Beta version available for Insync attendees....free!
                                                                                 More?	
  “SQL	
  sampler”	
  
                                                                                      SQL	
  Elapsed	
  Time	
  Analysis	
  
How good is sampled data?

        This	
  is	
  smoothed	
  histogram	
  of	
  elapsed	
  Fmes	
  for	
  a	
  
        specific	
  sql_id	
  (query)	
  collected	
  using	
  SQL	
  
        Trace,	
  instrumentaFon,	
  and	
  OP	
  Elapsed	
  Fme	
  
        Sampler	
  (normal).	
  Over	
  a	
  5	
  minute	
  period,	
  around	
  
        80	
  samples	
  where	
  gathered	
  from	
  each	
  collecFon	
  
        method.	


                    All	
  three	
  collecFons	
  methods	
  
                    produce	
  the	
  same	
  results!	


                                                                    More?	
  True	
  SQL	
  Elapsed	
  

                                                                 SQL	
  Elapsed	
  Time	
  Analysis	
  
Let’s take a look at some

     real data
          from

 real systems.
                      SQL	
  Elapsed	
  Time	
  Analysis	
  
#1: Showing all samples.


            Samples :        230!
            Mean     :     57168!
            Median   :     60000!
            Max      :    793996!
            Collector: OP E Time!


                                     source:	
  Aber3129	
  

                           SQL	
  Elapsed	
  Time	
  Analysis	
  
#1: Showing most samples.

              Samples :        230!
              Mean     :     57168!
              Median   :     60000!
              Max      :    793996!
              Collector: OP E Time!
              !


                                    source:	
  Aber3129	
  

                          SQL	
  Elapsed	
  Time	
  Analysis	
  
#2: Showing most samples.


             Samples :        368!
             Mean     :       158!
             Median   :        23!
             Max      :      2840!
             Collector: OP E Time!


                                    source:	
  Garret1jqj	
  

                          SQL	
  Elapsed	
  Time	
  Analysis	
  
#3: Showing all samples.


             Samples :        506!
             Mean     :        48!
             Median   :        26!
             Max      :       476!
             Collector: OP E Time!


                                    source:	
  Garret8qt	
  

                          SQL	
  Elapsed	
  Time	
  Analysis	
  
#4: Showing all samples.


           Samples :     179!
           Mean     :     38.72 ms!
           Median   :     38.04 ms!
           Max      :     58.40 ms!
           Collector: OP E Sampler!


                                   source:	
  Garret	
  0u2t	
  

                          SQL	
  Elapsed	
  Time	
  Analysis	
  
Experimental Examples.


                    source:	
  E	
  Analysis	
  1a	
  (final).nb	
  

                          SQL	
  Elapsed	
  Time	
  Analysis	
  
Conclusions about average E.
•  Average elapsed time for a specific SQL
   statement can be very misleading.
•  Elapsed times are not normally distributed.
•  The average elapsed time is not the typical
   elapsed time.
•  The modes are the typical elapsed times.
•  If the mode is not available, then the median
   can be used, in some cases.
•  If you need to communicate typical elapsed
   times, you need to gather real data.
                                        More?	
  “SQL	
  elapsed”	
  
                                             SQL	
  Elapsed	
  Time	
  Analysis	
  
Modeling elapsed time

E = units of work x time per unit

E (time/exec) = WL(work/exec) x RT(time/work)


                                      SQL	
  Elapsed	
  Time	
  Analysis	
  
Example of elapsed time.

   Supposed	
  a	
  query	
  must	
  access	
  100,000	
  logical	
  IOs	
  
   and	
  each	
  LIO	
  takes	
  0.020ms.	
  Therefore,	
  the	
  
   elapsed	
  Fme	
  will	
  be	
  2,000ms	
  or	
  2.0	
  seconds.	
  

E (ms/exec) = units of work (LIO/exec) X time per work (ms/LIO)!
!
2000 ms/exec = 100,000 LIO/exec X 0.020 ms/LIO !


                                                               SQL	
  Elapsed	
  Time	
  Analysis	
  
When we tune, WL is reduced.
•  SQL tuning fundamentally reduces the
   work required to execute a statement.
•  Since less work is required then generally,
   the elapsed time will decrease!
•  If your tuning prowess reduces the work
   from 100,000 PIOs to 50,000 PIOs then
   you can expect the elapsed time to
   decrease by 50%.
•  But does this really occur in reality? hum...

                                         SQL	
  Elapsed	
  Time	
  Analysis	
  
Experimental results!
                                                                 Median	
  
           Stmt	
                     Median	
  
Tuned	
               Stmt	
  LIO	
                              Elapsed	
  
          Logical	
                   Elapsed	
                                  Samples	
  
 SQL	
                 Change	
                                  Time	
  (s)	
  
            IO	
                      Time	
  (s)	
  
                                                                 Change	
  
     No	
      355289	
             -­‐	
        14.22	
               -­‐	
                                 243	
  
     Yes	
     161495	
   -­‐54.55%	
             5.88	
         -­‐58.67%	
                                 339	
  

•    CollecFon	
  interval	
  was	
  2	
  hours.	
  
•    OraPub’s	
  Elapsed	
  Time	
  Sampler	
  was	
  used	
  to	
  collect	
  elapsed	
  Fmes.	
  
•    LIO	
  numbers	
  gathered	
  from	
  v$sysstat.	
  
•    Time	
  based	
  on	
  Fmestamp	
  data	
  type.	
  
                                                                                 source:	
  E	
  Analysis	
  1a.xlsx,	
  256	
  latches	
  

                                                                                                 SQL	
  Elapsed	
  Time	
  Analysis	
  
Ways to reduce UOW process time.
 •  There are many ways to reduce the time it
    takes to process a single unit of work.
 •  There are direct methods and indirect
    methods.
 •  Indirect: Because processes share and
    compete for resources, when the big issue is
    resolved, many other issues become less
    intense.
 •  Direct: Tuning Oracle directly reduces the
    time required to process a piece of work.
    Hum...

                                          SQL	
  Elapsed	
  Time	
  Analysis	
  
Experimental results!
                                                 SQL	
  Stmt	
  
            Instance	
              Instance	
  
  CBC	
                                           Median	
  
               RT	
      Change	
      WL	
                       Change	
   Samples	
  
Latches	
                                         Elapsed	
  
            (ms/lio)	
              (lio/ms)	
  
                                                  Time	
  (s)	
  
      256	
       0.03623	
             -­‐	
         120	
          14.224	
                  -­‐	
                      243	
  

32768	
   0.00856	
   -­‐76.36%	
                     227	
           2.968	
        -­‐79.13%	
                          399	


 •      CollecFon	
  interval	
  was	
  2	
  hours.	
  
 •      OraPub’s	
  Elapsed	
  Time	
  Sampler	
  was	
  used	
  to	
  collect	
  elapsed	
  Fmes.	
  
 •      RT	
  components	
  gathered	
  from	
  v$sysstat,	
  v$sys_Fme_model,	
  and	
  v$system_event.	
  
 •      Time	
  based	
  on	
  Fmestamp	
  data	
  type.	
  

                                                                                       source:	
  E	
  Analysis	
  1a.xlsx,	
  not	
  tuned	
  

                                                                                                         SQL	
  Elapsed	
  Time	
  Analysis	
  
This graph shows the work process time.


                                   +96%	
  WL	
  Change	


      -­‐76%	
  RT	
  Change	


                                                              source:	
  More	
  Latches	
  RT	
  Compare...xlsx	
  

                                                                                SQL	
  Elapsed	
  Time	
  Analysis	
  
All situations elapsed times.


                          SQL	
  Elapsed	
  Time	
  Analysis	
  
The point? #1 – Average is misleading.
•  It is easy to calculate the average elapsed
   time...even from Statspack.
•  But saying, “The average elapsed time is X.”
   will most likely mislead everyone.

•  The median or mode(s) is a much better
   representation of the typical elapsed times.
•  If you need to communicate typical elapsed
   times, you need to gather real data.

                                         SQL	
  Elapsed	
  Time	
  Analysis	
  
The point? #2 – Modeling SQL E.
•  Two basic ways to reduce elapsed times:
  –  Reduce work to be done.
  –  Reduce time to process each piece of work.

•  SQL statement elapsed time can be
   simply modeled.
•  SQL statement elapsed time can be
   anticipated.

                                          SQL	
  Elapsed	
  Time	
  Analysis	
  
Want to dig deeper?
•  Craig’s Blog – A W i d e r V i e w
•  Training from OraPub
                                               Melbourne	
  
   –  Oracle Performance Firefighting (I)
                                               &	
  Perth	
  in	
  
   –  Adv Oracle Performance Analysis (II)      Q2	
  2012    	
  
•  Books
   –  Oracle Performance Firefighting (C. Shallahamer)
      •  Chapter 9 is FREE to download


                                                      SQL	
  Elapsed	
  Time	
  Analysis	
  
Thank
 You!
    SQL	
  Elapsed	
  Time	
  Analysis	
  

Database & Technology 1 _ Craig Shallahamer _ SQL Elapsed Time Analhysis.pdf

  • 1.
    SQL Elapsed Time Analysis Craig A. Shallahamer Founder - OraPub, Inc. craig@orapub.com SQL  Elapsed  Time  Analysis  
  • 2.
    OraPub is aboutOracle performance. •  OraPub is all about Oracle performance Resources   management; systematic and quantitative firefighting and predictive analysis. •   Training   •  Web site started in 1995 and the company was founded in 1998 by Craig Shallahamer. •   Unique  Blog   •  OraPub has always been about disseminating •   Free  Tools   Oracle database centric technical information. •  Consulting, training, books, papers, and •   Free  Papers   products are now being offered. •   Books   •  We have been on-site in 24 countries and our resources have been received in probably •   Products   every country where there are DBAs. •   Consul8ng   SQL  Elapsed  Time  Analysis  
  • 3.
    Short resume...kind of... • Studies economics, mathematics, and computer science at university in California, US. •  Started working with Oracle technology in 1989 as a Forms 2.3 developer on Oracle version 5. •  Soon after started performance firefighting...daily! •  Co-found both Oracle’s Core Technology and System Performance Groups. •  Left Oracle to start OraPub, Inc. in 1998. •  Authored 24 technical papers and worked in 24 countries. •  Authors and teaches his classes Oracle Performance Firefighting, Adv Oracle Performance Analysis, and Oracle Forecasting & Predictive Analysis. •  Authored the books, Forecasting Oracle Performance and Oracle Performance Firefighting. •  Oracle ACE Director. •  Frequent blog contributor: A Wider View SQL  Elapsed  Time  Analysis  
  • 4.
    My two books... OraPub  discount  code:  IS11   SQL  Elapsed  Time  Analysis  
  • 5.
    One presentation withtwo parts. •  “The average” can be misleading. •  Modeling E time leads to insights. SQL  Elapsed  Time  Analysis  
  • 6.
    Working with limitedinformation. SQL ordered by Elapsed DB/Inst: LOOK/LOOK Snaps: 80298-80310! -> Resources reported for PL/SQL code includes the resources used by all SQL! statements called by the code.! -> Total DB CPU (s): 22,800! -> Captured SQL accounts for 109.8% of Total DB CPU! -> SQL reported below exceeded 1.0% of Total DB CPU! ! CPU CPU per Elapsd Old! Time (s) Executions Exec (s) %Total Time (s) Physical Reads Hash Value! ---------- ------------ ---------- ------ ---------- --------------- ----------! 474.59 38,479 0.01 19.9 479909.89 923,822,548 4166296332! BEGIN pkg_com_unite.st_execute_commune( i_daemon_id => :daemon_id, ! i_reload_subult_true_false => :reload_subult_true_false, ! i_dump_caches => :dump_caches, i_add_seq2_id => :add_seq2_id, ! i_dump_seq2_id => :dump_seq2_id, i_remove_seq2_id => :remove_seq2_id, ! i_multi_seq2_chg_true_false => :multi_seq2! Total  Elapsed  Time  :  479,909.89  seconds   Total  ExecuFons            :  38,479  exec   SQL  Elapsed  Time  Analysis  
  • 7.
    So the averageE time is... E = 479909.89 secs / 38,479 exec! = 12.47 sec/exec! source:  Init  Hist  Work  2.nb   SQL  Elapsed  Time  Analysis  
  • 8.
    It’s more likelyto be like this... More?  “log  normal”   SQL  Elapsed  Time  Analysis  
  • 9.
    Even more likely... SQL  Elapsed  Time  Analysis  
  • 10.
    What can wedo? We don’t want to mislead others. We need to truly understand the situation if we are making decisions based on this information. SQL  Elapsed  Time  Analysis  
  • 11.
    We have avariety of collection options. •  SQL Trace. Valid option. –  Must have ability to parse the trace files producing E times. –  Can trace on sql_id. –  Must be the production system. •  Instrument SQL. Valid option. –  May not be practical or possible. •  Stopwatch. Risky. –  Limited scope and very few samples. –  OK for a specific user situation. •  Benchmark or Isolated Testing. Very risky. –  If you want real results, you need a real situation (HW, data, arrivals, concurrency). •  OraPub E Time Collector. Valid, but grabs a core. –  Free tool. OraPub search: “sql elapsed time” –  Gathers at sql_id and plan_hash_value level. –  Grabs and holds a CPU core, ouch! •  OraPub E Sampler. Valid but not free. –  Un-noticeable impact with same results as tracing or instrumentation! –  Gathers at sql_id level and samples stored in Oracle table. –  Licensed like a box of candy. –  Beta version available for Insync attendees....free! More?  “SQL  sampler”   SQL  Elapsed  Time  Analysis  
  • 12.
    How good issampled data? This  is  smoothed  histogram  of  elapsed  Fmes  for  a   specific  sql_id  (query)  collected  using  SQL   Trace,  instrumentaFon,  and  OP  Elapsed  Fme   Sampler  (normal).  Over  a  5  minute  period,  around   80  samples  where  gathered  from  each  collecFon   method.       All  three  collecFons  methods   produce  the  same  results!   More?  True  SQL  Elapsed   SQL  Elapsed  Time  Analysis  
  • 13.
    Let’s take alook at some real data from real systems. SQL  Elapsed  Time  Analysis  
  • 14.
    #1: Showing allsamples. Samples : 230! Mean : 57168! Median : 60000! Max : 793996! Collector: OP E Time! source:  Aber3129   SQL  Elapsed  Time  Analysis  
  • 15.
    #1: Showing mostsamples. Samples : 230! Mean : 57168! Median : 60000! Max : 793996! Collector: OP E Time! ! source:  Aber3129   SQL  Elapsed  Time  Analysis  
  • 16.
    #2: Showing mostsamples. Samples : 368! Mean : 158! Median : 23! Max : 2840! Collector: OP E Time! source:  Garret1jqj   SQL  Elapsed  Time  Analysis  
  • 17.
    #3: Showing allsamples. Samples : 506! Mean : 48! Median : 26! Max : 476! Collector: OP E Time! source:  Garret8qt   SQL  Elapsed  Time  Analysis  
  • 18.
    #4: Showing allsamples. Samples : 179! Mean : 38.72 ms! Median : 38.04 ms! Max : 58.40 ms! Collector: OP E Sampler! source:  Garret  0u2t   SQL  Elapsed  Time  Analysis  
  • 19.
    Experimental Examples. source:  E  Analysis  1a  (final).nb   SQL  Elapsed  Time  Analysis  
  • 20.
    Conclusions about averageE. •  Average elapsed time for a specific SQL statement can be very misleading. •  Elapsed times are not normally distributed. •  The average elapsed time is not the typical elapsed time. •  The modes are the typical elapsed times. •  If the mode is not available, then the median can be used, in some cases. •  If you need to communicate typical elapsed times, you need to gather real data. More?  “SQL  elapsed”   SQL  Elapsed  Time  Analysis  
  • 21.
    Modeling elapsed time E= units of work x time per unit E (time/exec) = WL(work/exec) x RT(time/work) SQL  Elapsed  Time  Analysis  
  • 22.
    Example of elapsedtime. Supposed  a  query  must  access  100,000  logical  IOs   and  each  LIO  takes  0.020ms.  Therefore,  the   elapsed  Fme  will  be  2,000ms  or  2.0  seconds.   E (ms/exec) = units of work (LIO/exec) X time per work (ms/LIO)! ! 2000 ms/exec = 100,000 LIO/exec X 0.020 ms/LIO ! SQL  Elapsed  Time  Analysis  
  • 23.
    When we tune,WL is reduced. •  SQL tuning fundamentally reduces the work required to execute a statement. •  Since less work is required then generally, the elapsed time will decrease! •  If your tuning prowess reduces the work from 100,000 PIOs to 50,000 PIOs then you can expect the elapsed time to decrease by 50%. •  But does this really occur in reality? hum... SQL  Elapsed  Time  Analysis  
  • 24.
    Experimental results! Median   Stmt   Median   Tuned   Stmt  LIO   Elapsed   Logical   Elapsed   Samples   SQL   Change   Time  (s)   IO   Time  (s)   Change   No   355289   -­‐   14.22   -­‐   243   Yes   161495   -­‐54.55%   5.88   -­‐58.67%   339   •  CollecFon  interval  was  2  hours.   •  OraPub’s  Elapsed  Time  Sampler  was  used  to  collect  elapsed  Fmes.   •  LIO  numbers  gathered  from  v$sysstat.   •  Time  based  on  Fmestamp  data  type.   source:  E  Analysis  1a.xlsx,  256  latches   SQL  Elapsed  Time  Analysis  
  • 25.
    Ways to reduceUOW process time. •  There are many ways to reduce the time it takes to process a single unit of work. •  There are direct methods and indirect methods. •  Indirect: Because processes share and compete for resources, when the big issue is resolved, many other issues become less intense. •  Direct: Tuning Oracle directly reduces the time required to process a piece of work. Hum... SQL  Elapsed  Time  Analysis  
  • 26.
    Experimental results! SQL  Stmt   Instance   Instance   CBC   Median   RT   Change   WL   Change   Samples   Latches   Elapsed   (ms/lio)   (lio/ms)   Time  (s)   256   0.03623   -­‐   120   14.224   -­‐   243   32768   0.00856   -­‐76.36%   227   2.968   -­‐79.13%   399   •  CollecFon  interval  was  2  hours.   •  OraPub’s  Elapsed  Time  Sampler  was  used  to  collect  elapsed  Fmes.   •  RT  components  gathered  from  v$sysstat,  v$sys_Fme_model,  and  v$system_event.   •  Time  based  on  Fmestamp  data  type.   source:  E  Analysis  1a.xlsx,  not  tuned   SQL  Elapsed  Time  Analysis  
  • 27.
    This graph showsthe work process time. +96%  WL  Change   -­‐76%  RT  Change   source:  More  Latches  RT  Compare...xlsx   SQL  Elapsed  Time  Analysis  
  • 28.
    All situations elapsedtimes. SQL  Elapsed  Time  Analysis  
  • 29.
    The point? #1– Average is misleading. •  It is easy to calculate the average elapsed time...even from Statspack. •  But saying, “The average elapsed time is X.” will most likely mislead everyone. •  The median or mode(s) is a much better representation of the typical elapsed times. •  If you need to communicate typical elapsed times, you need to gather real data. SQL  Elapsed  Time  Analysis  
  • 30.
    The point? #2– Modeling SQL E. •  Two basic ways to reduce elapsed times: –  Reduce work to be done. –  Reduce time to process each piece of work. •  SQL statement elapsed time can be simply modeled. •  SQL statement elapsed time can be anticipated. SQL  Elapsed  Time  Analysis  
  • 31.
    Want to digdeeper? •  Craig’s Blog – A W i d e r V i e w •  Training from OraPub Melbourne   –  Oracle Performance Firefighting (I) &  Perth  in   –  Adv Oracle Performance Analysis (II) Q2  2012   •  Books –  Oracle Performance Firefighting (C. Shallahamer) •  Chapter 9 is FREE to download SQL  Elapsed  Time  Analysis  
  • 32.
    Thank You! SQL  Elapsed  Time  Analysis