Download as PDF, PPTX

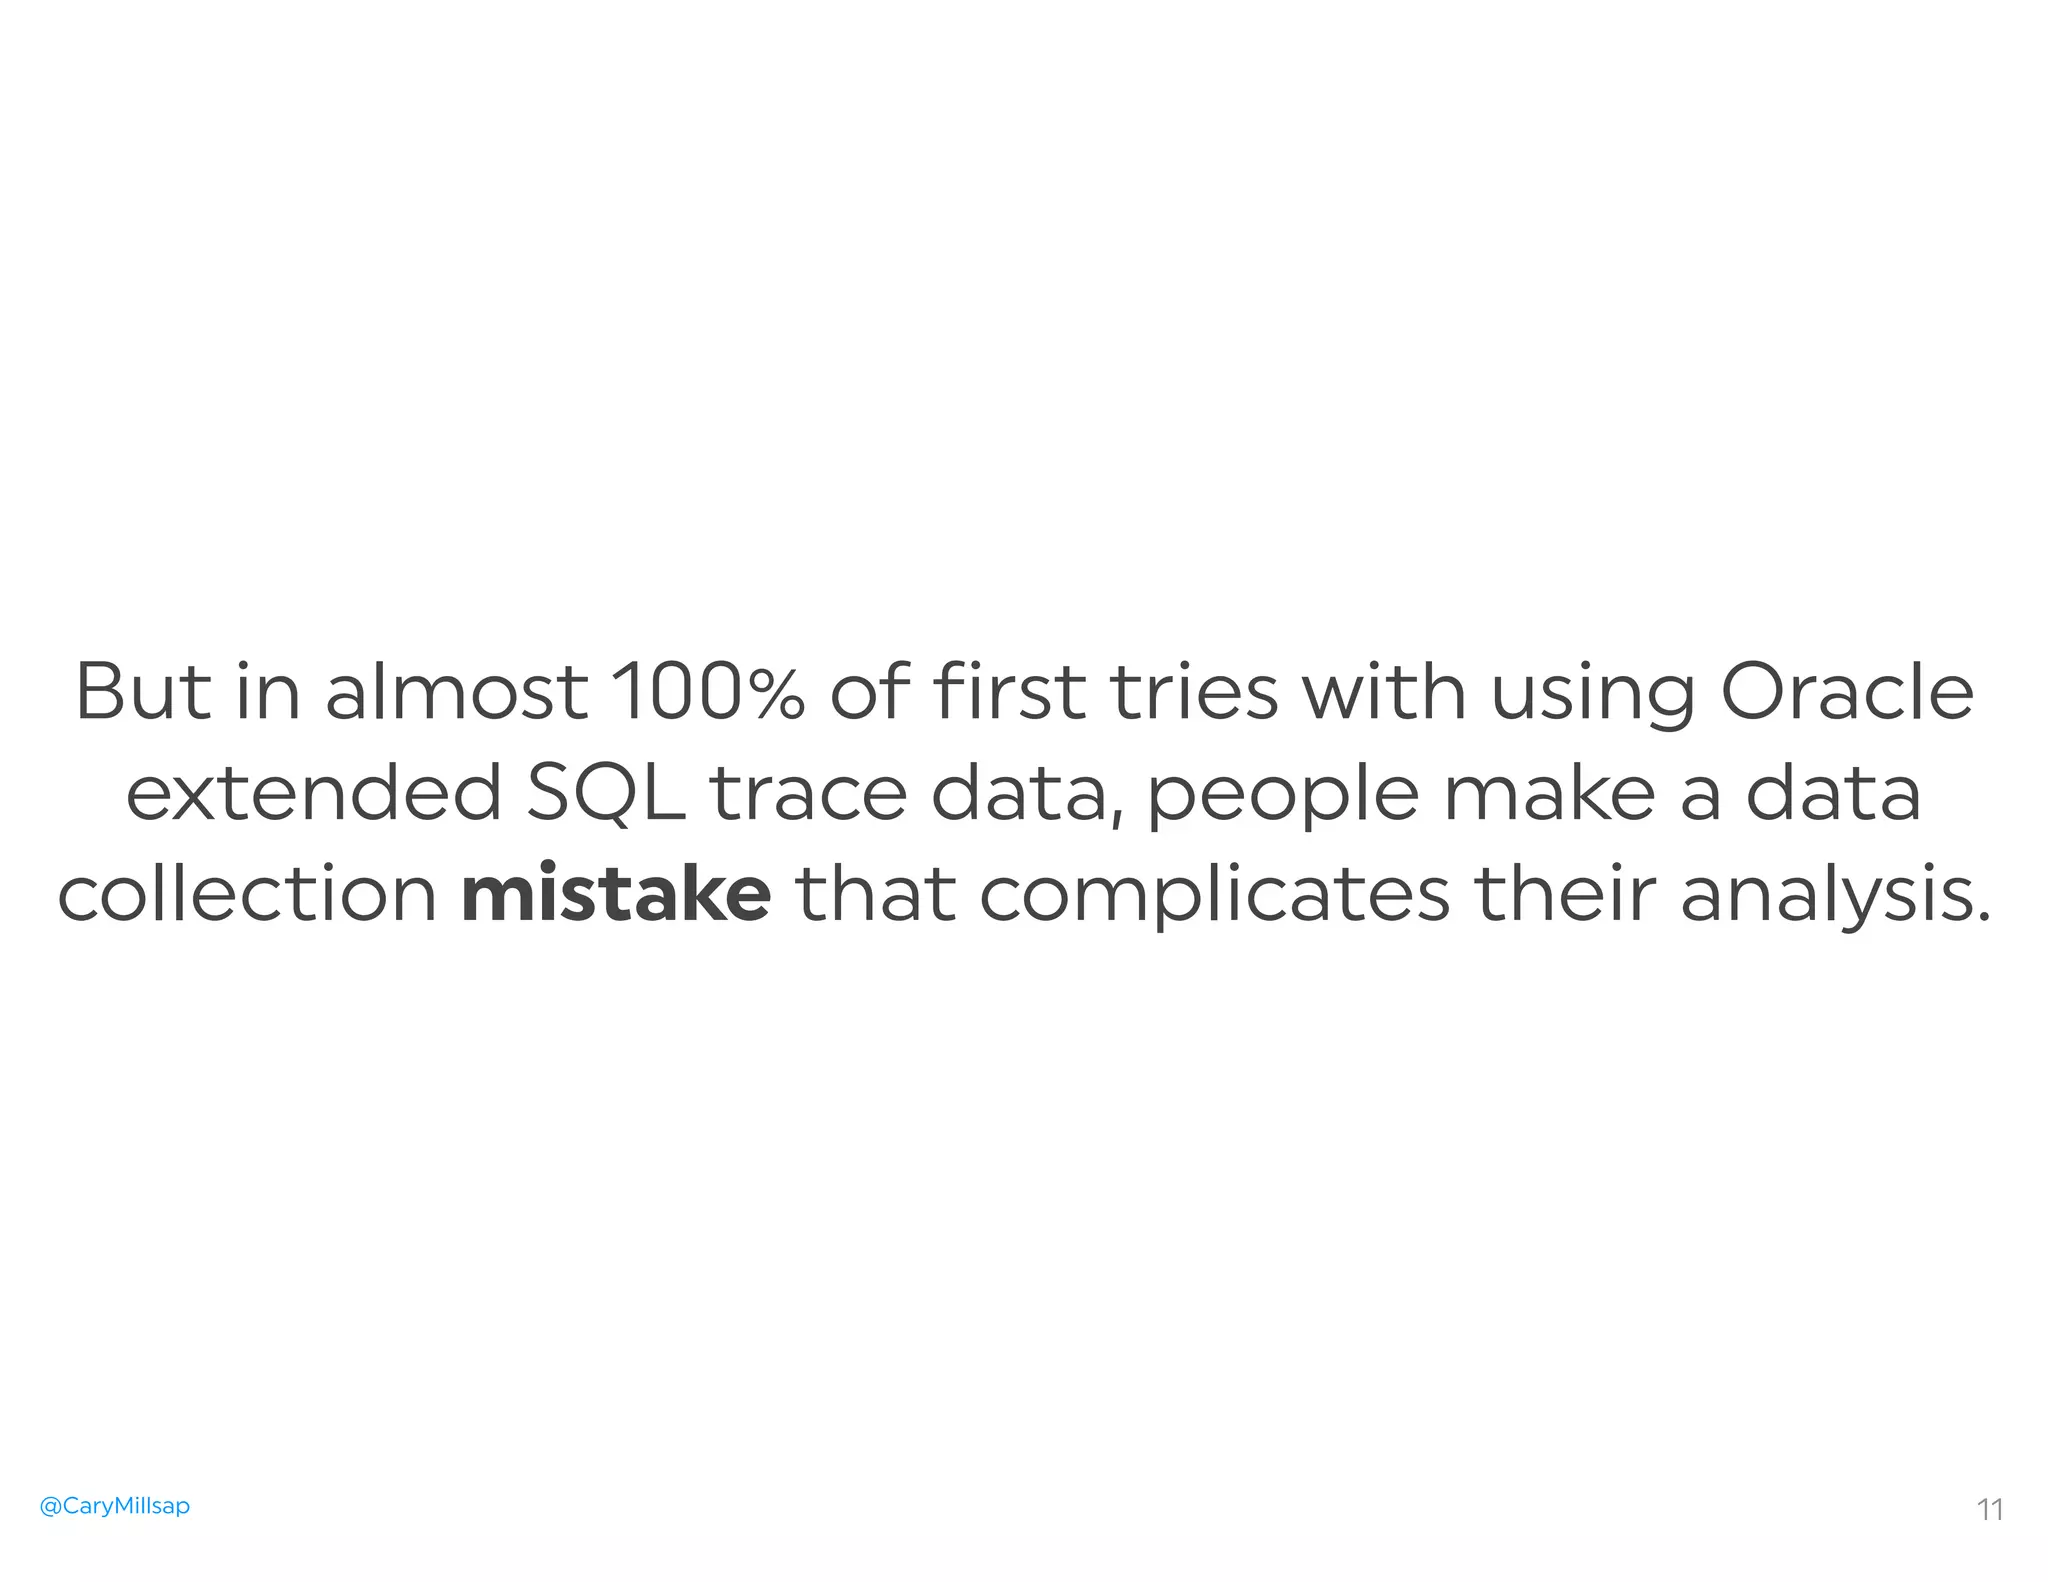


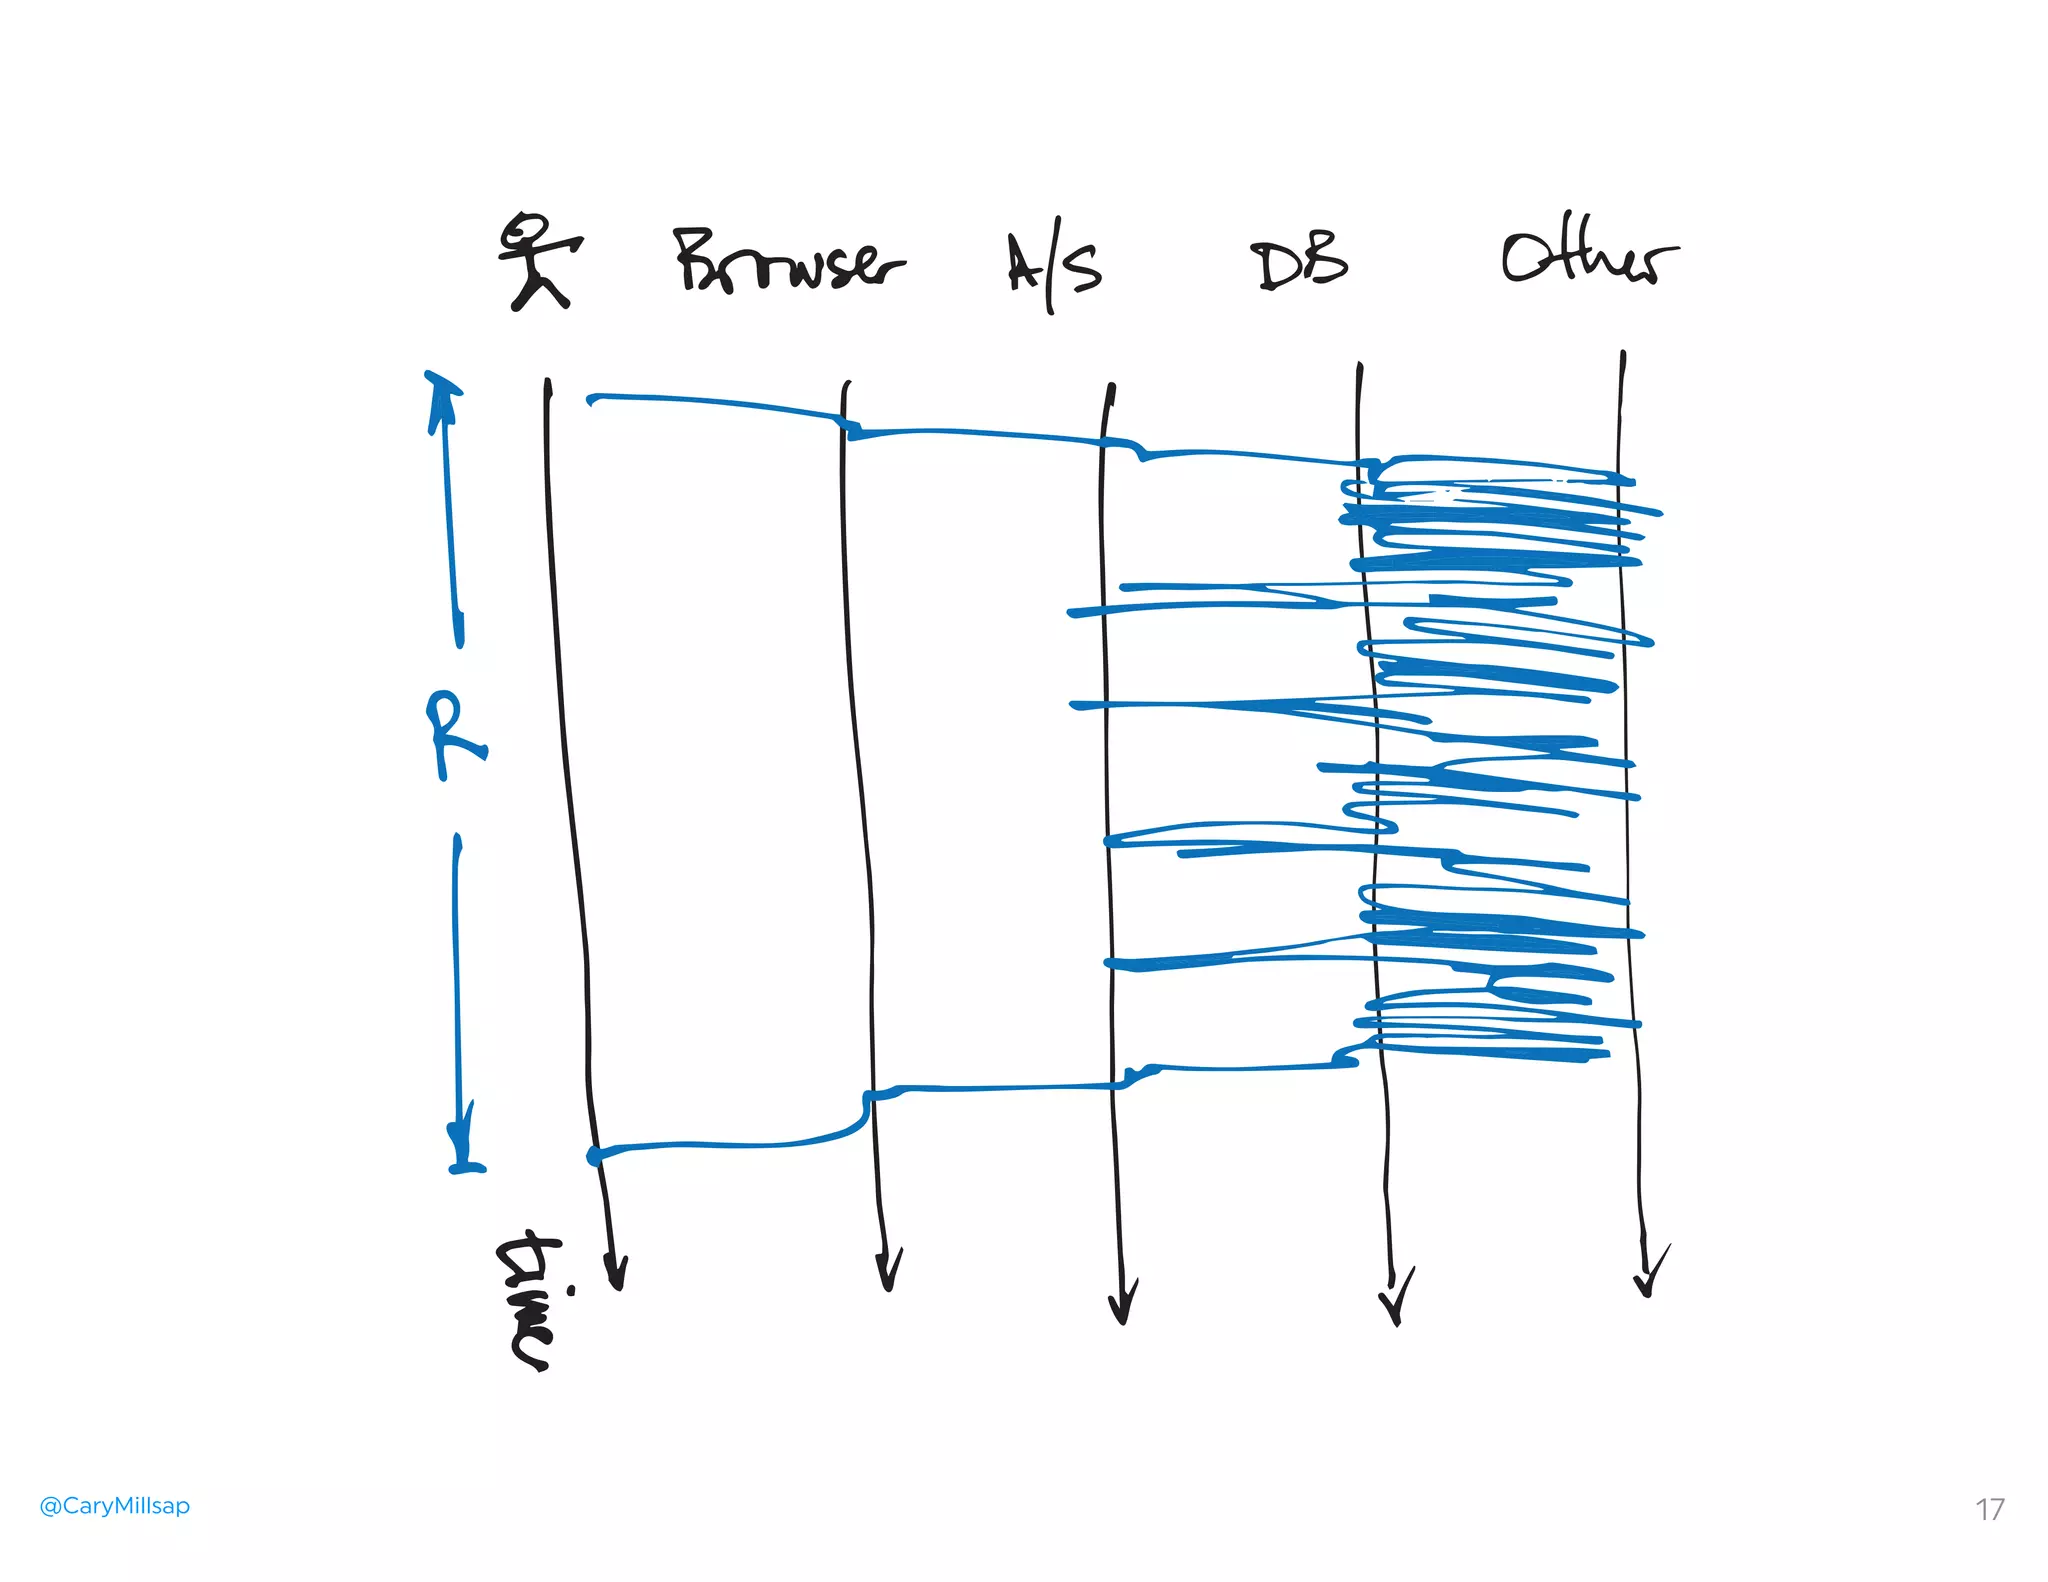
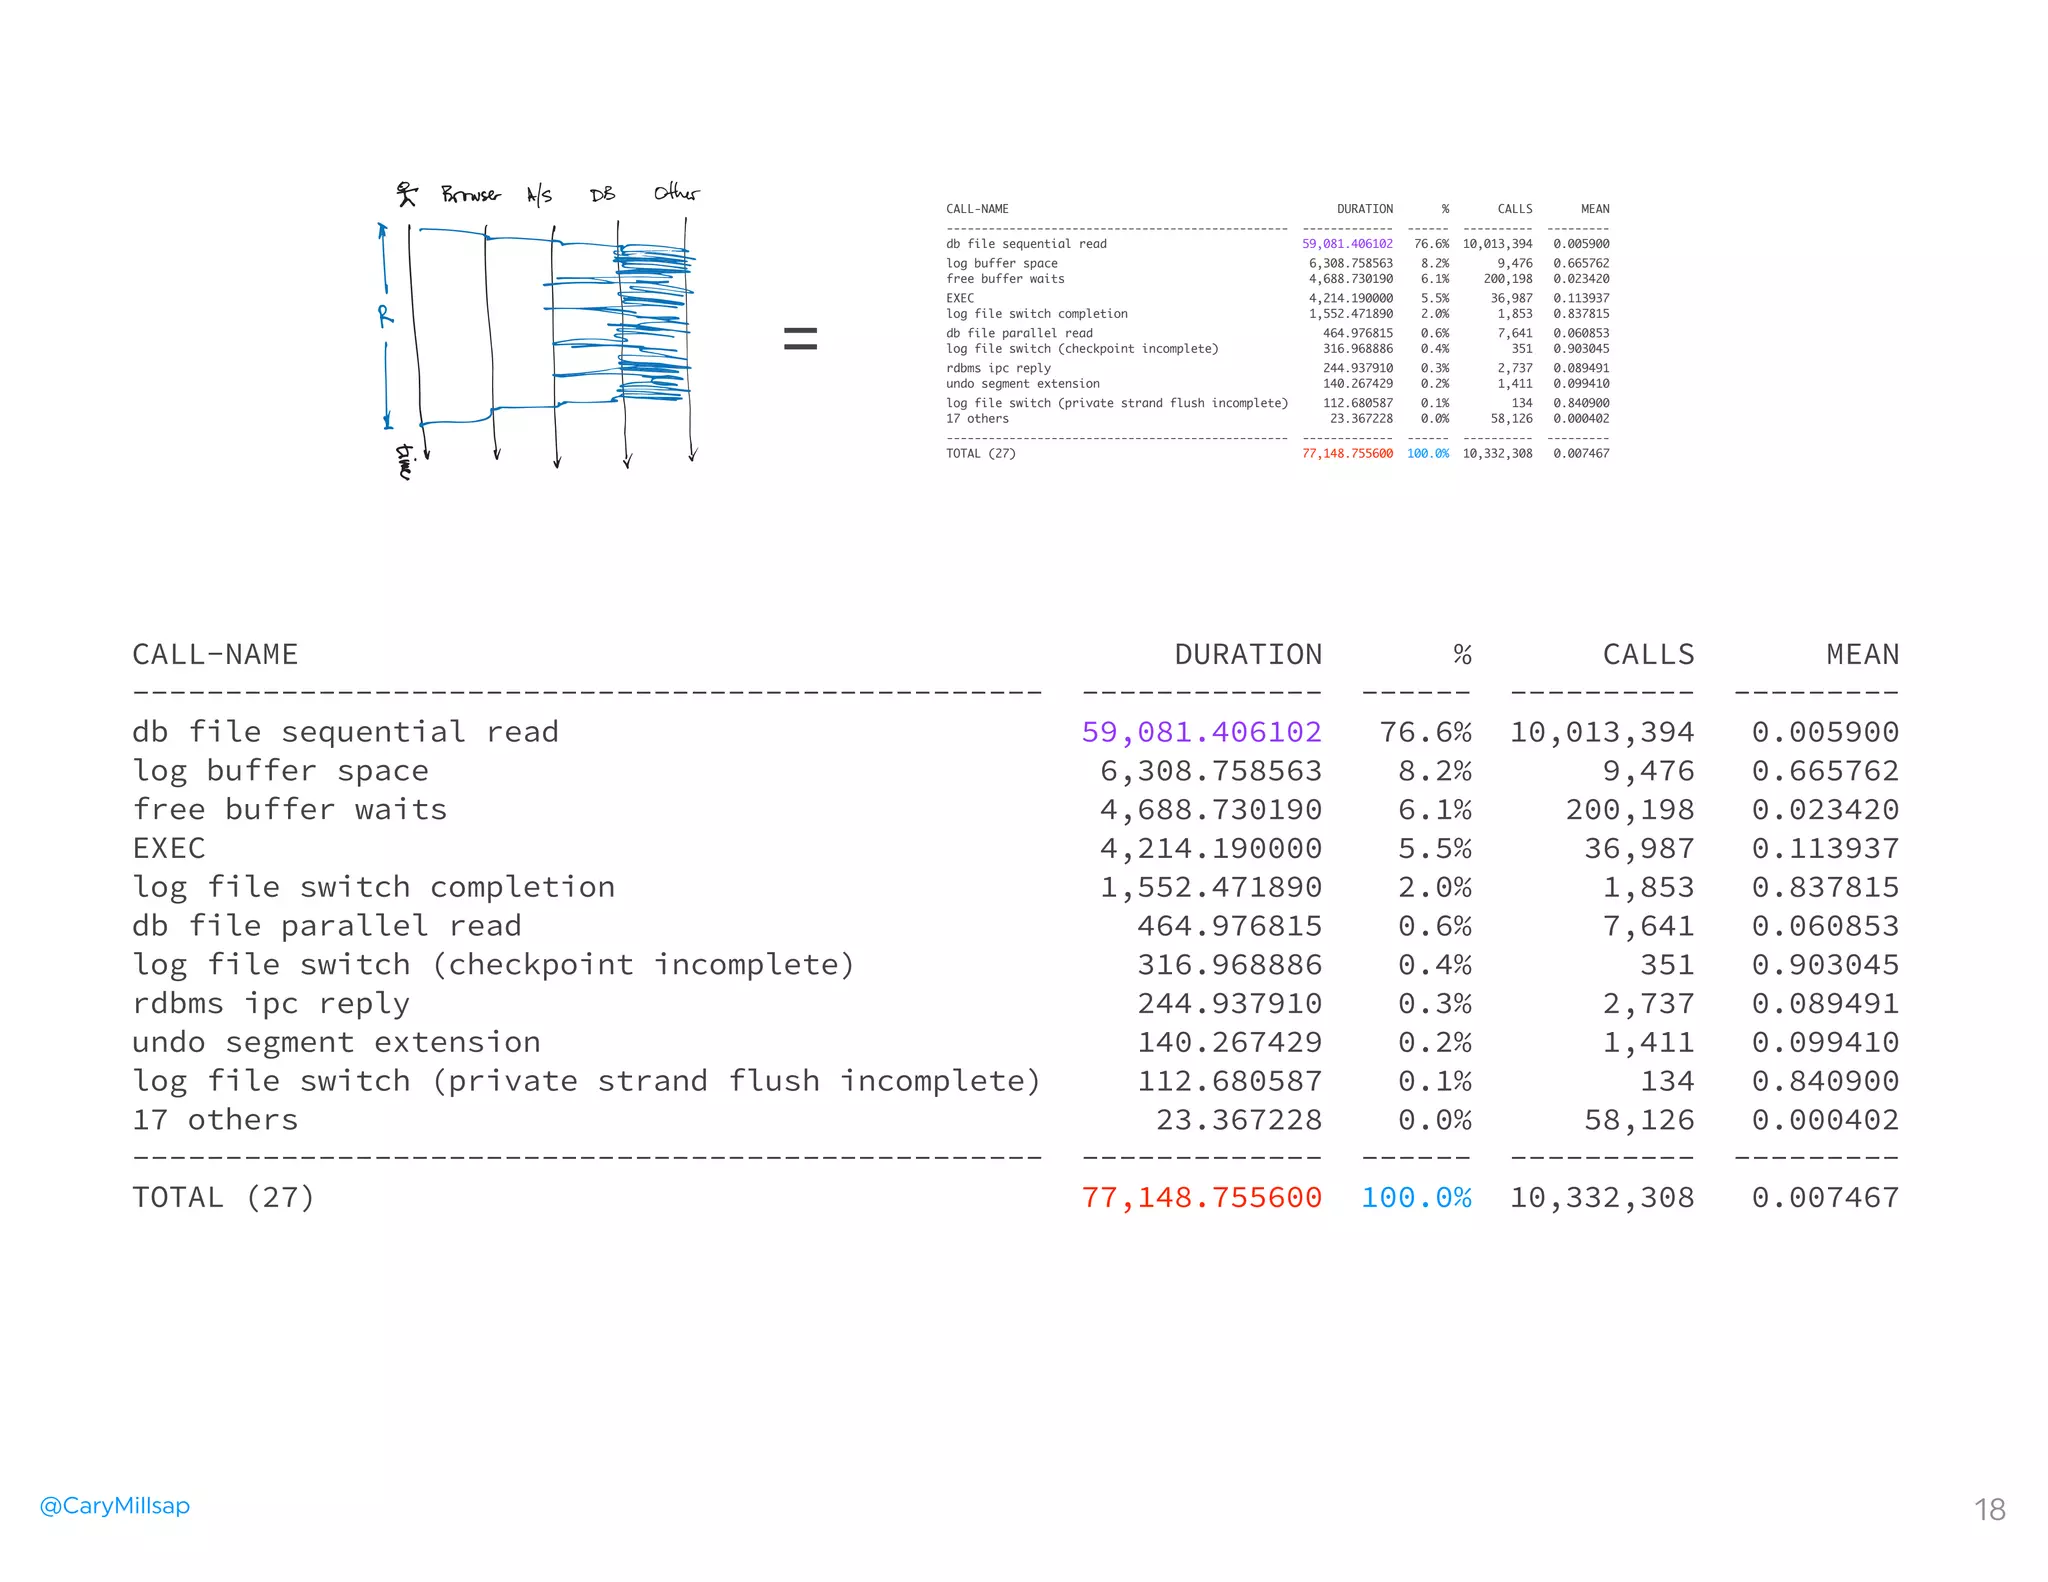
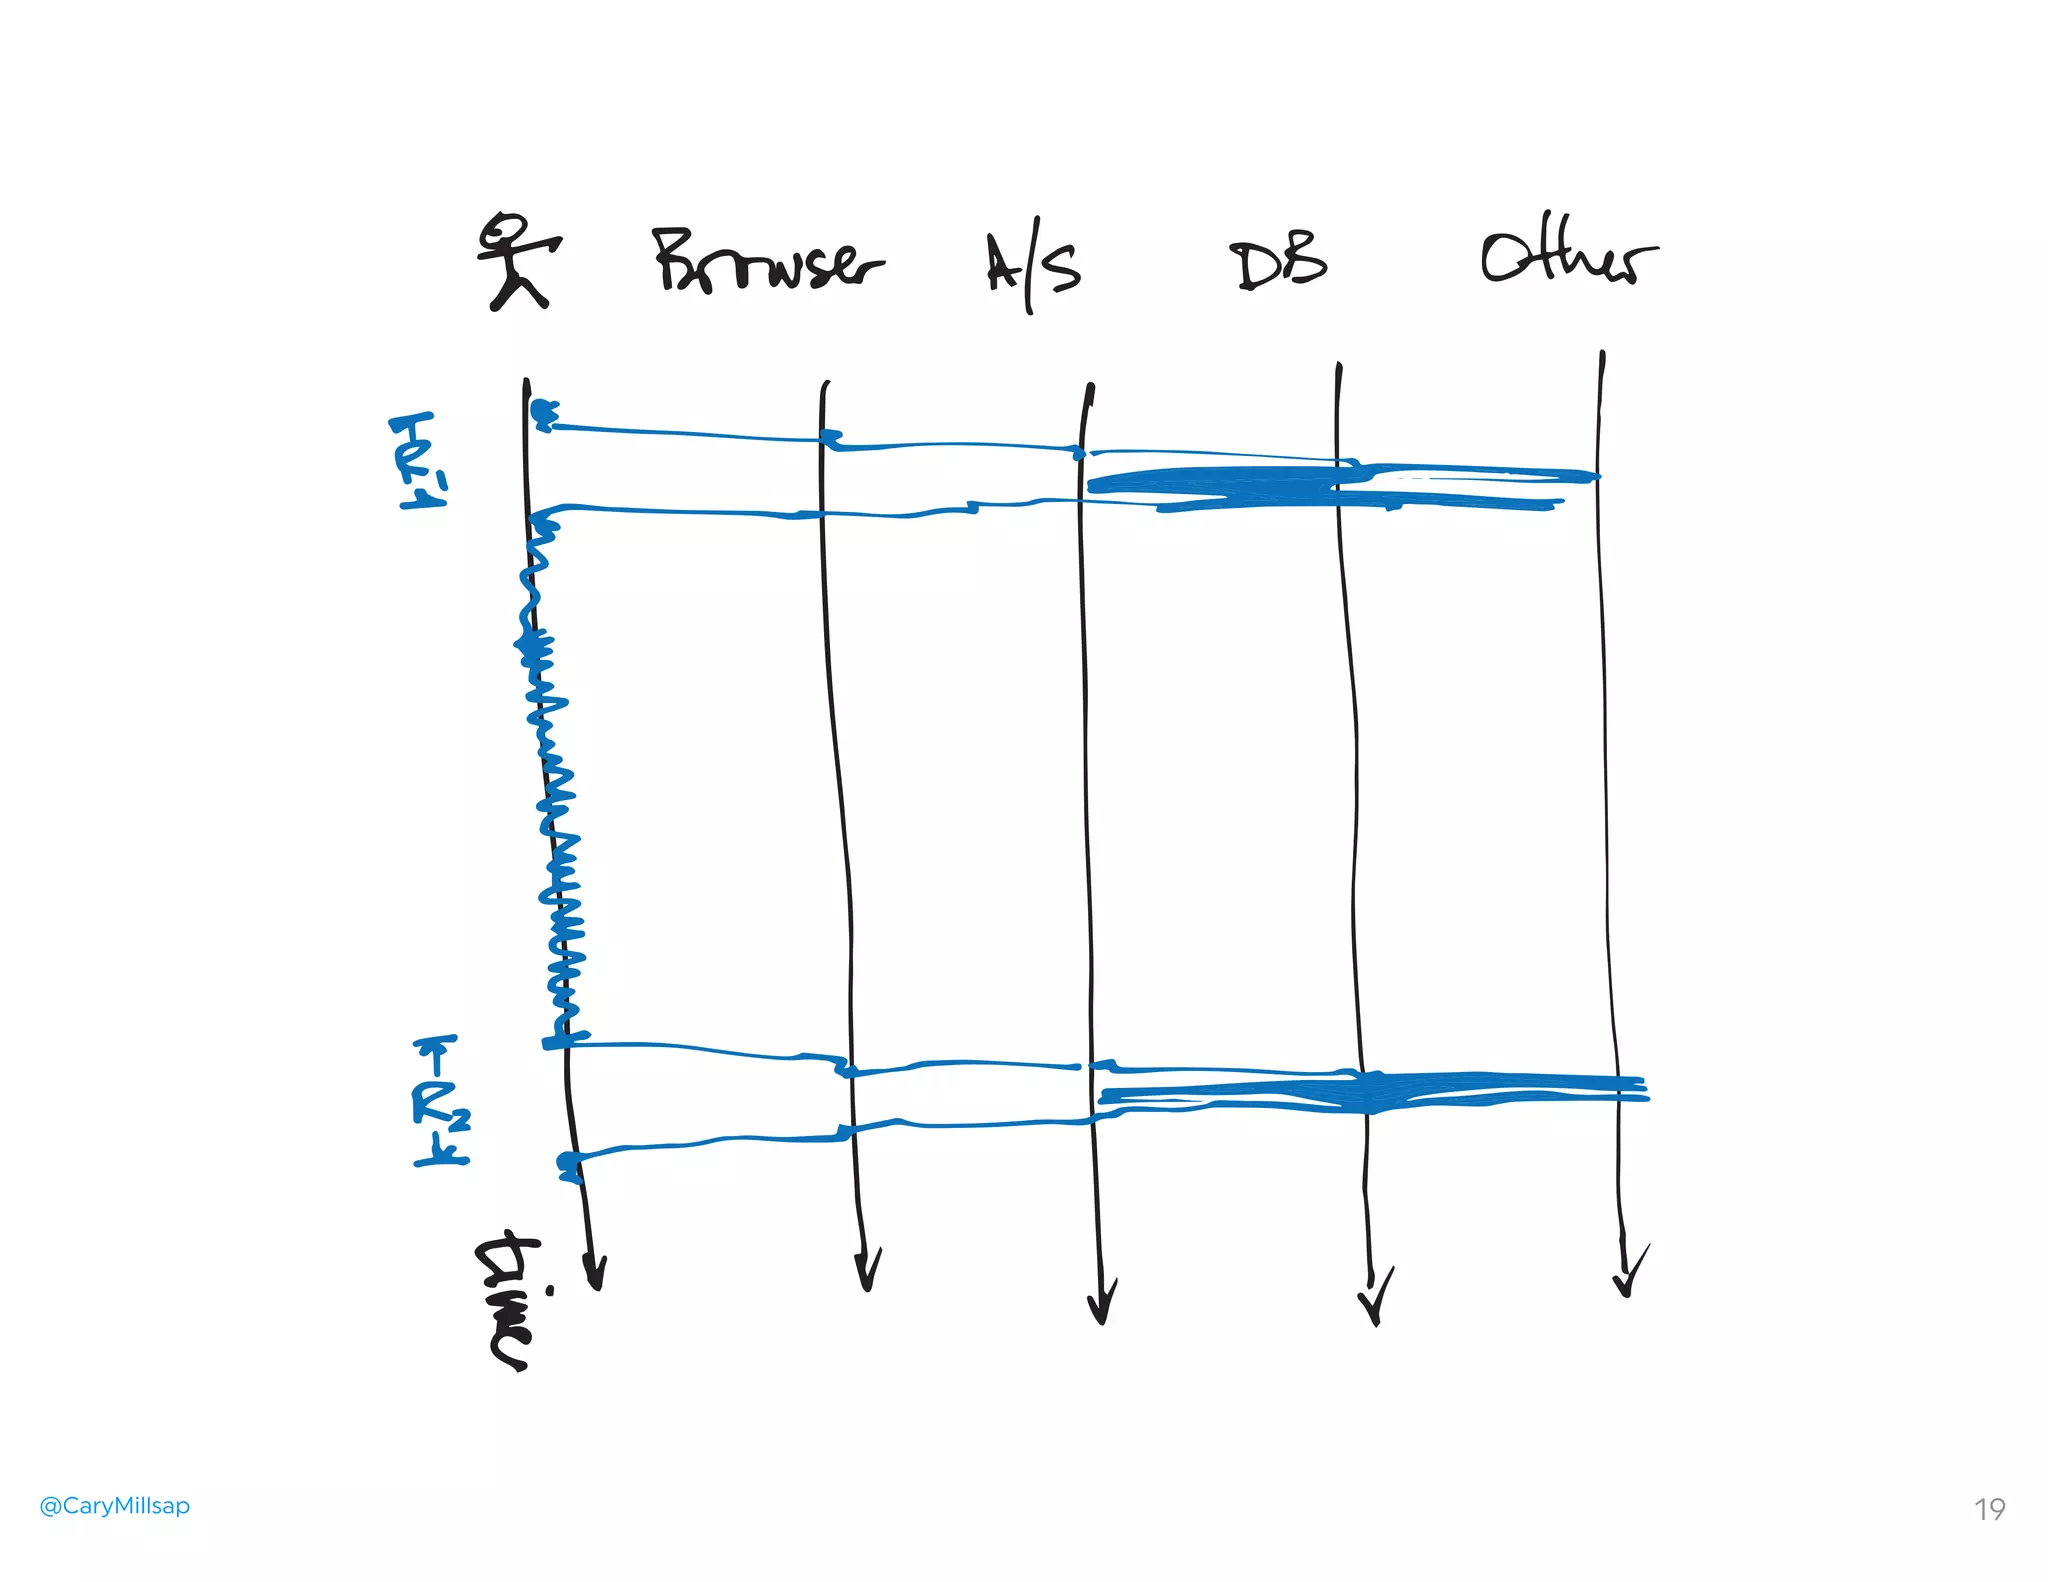
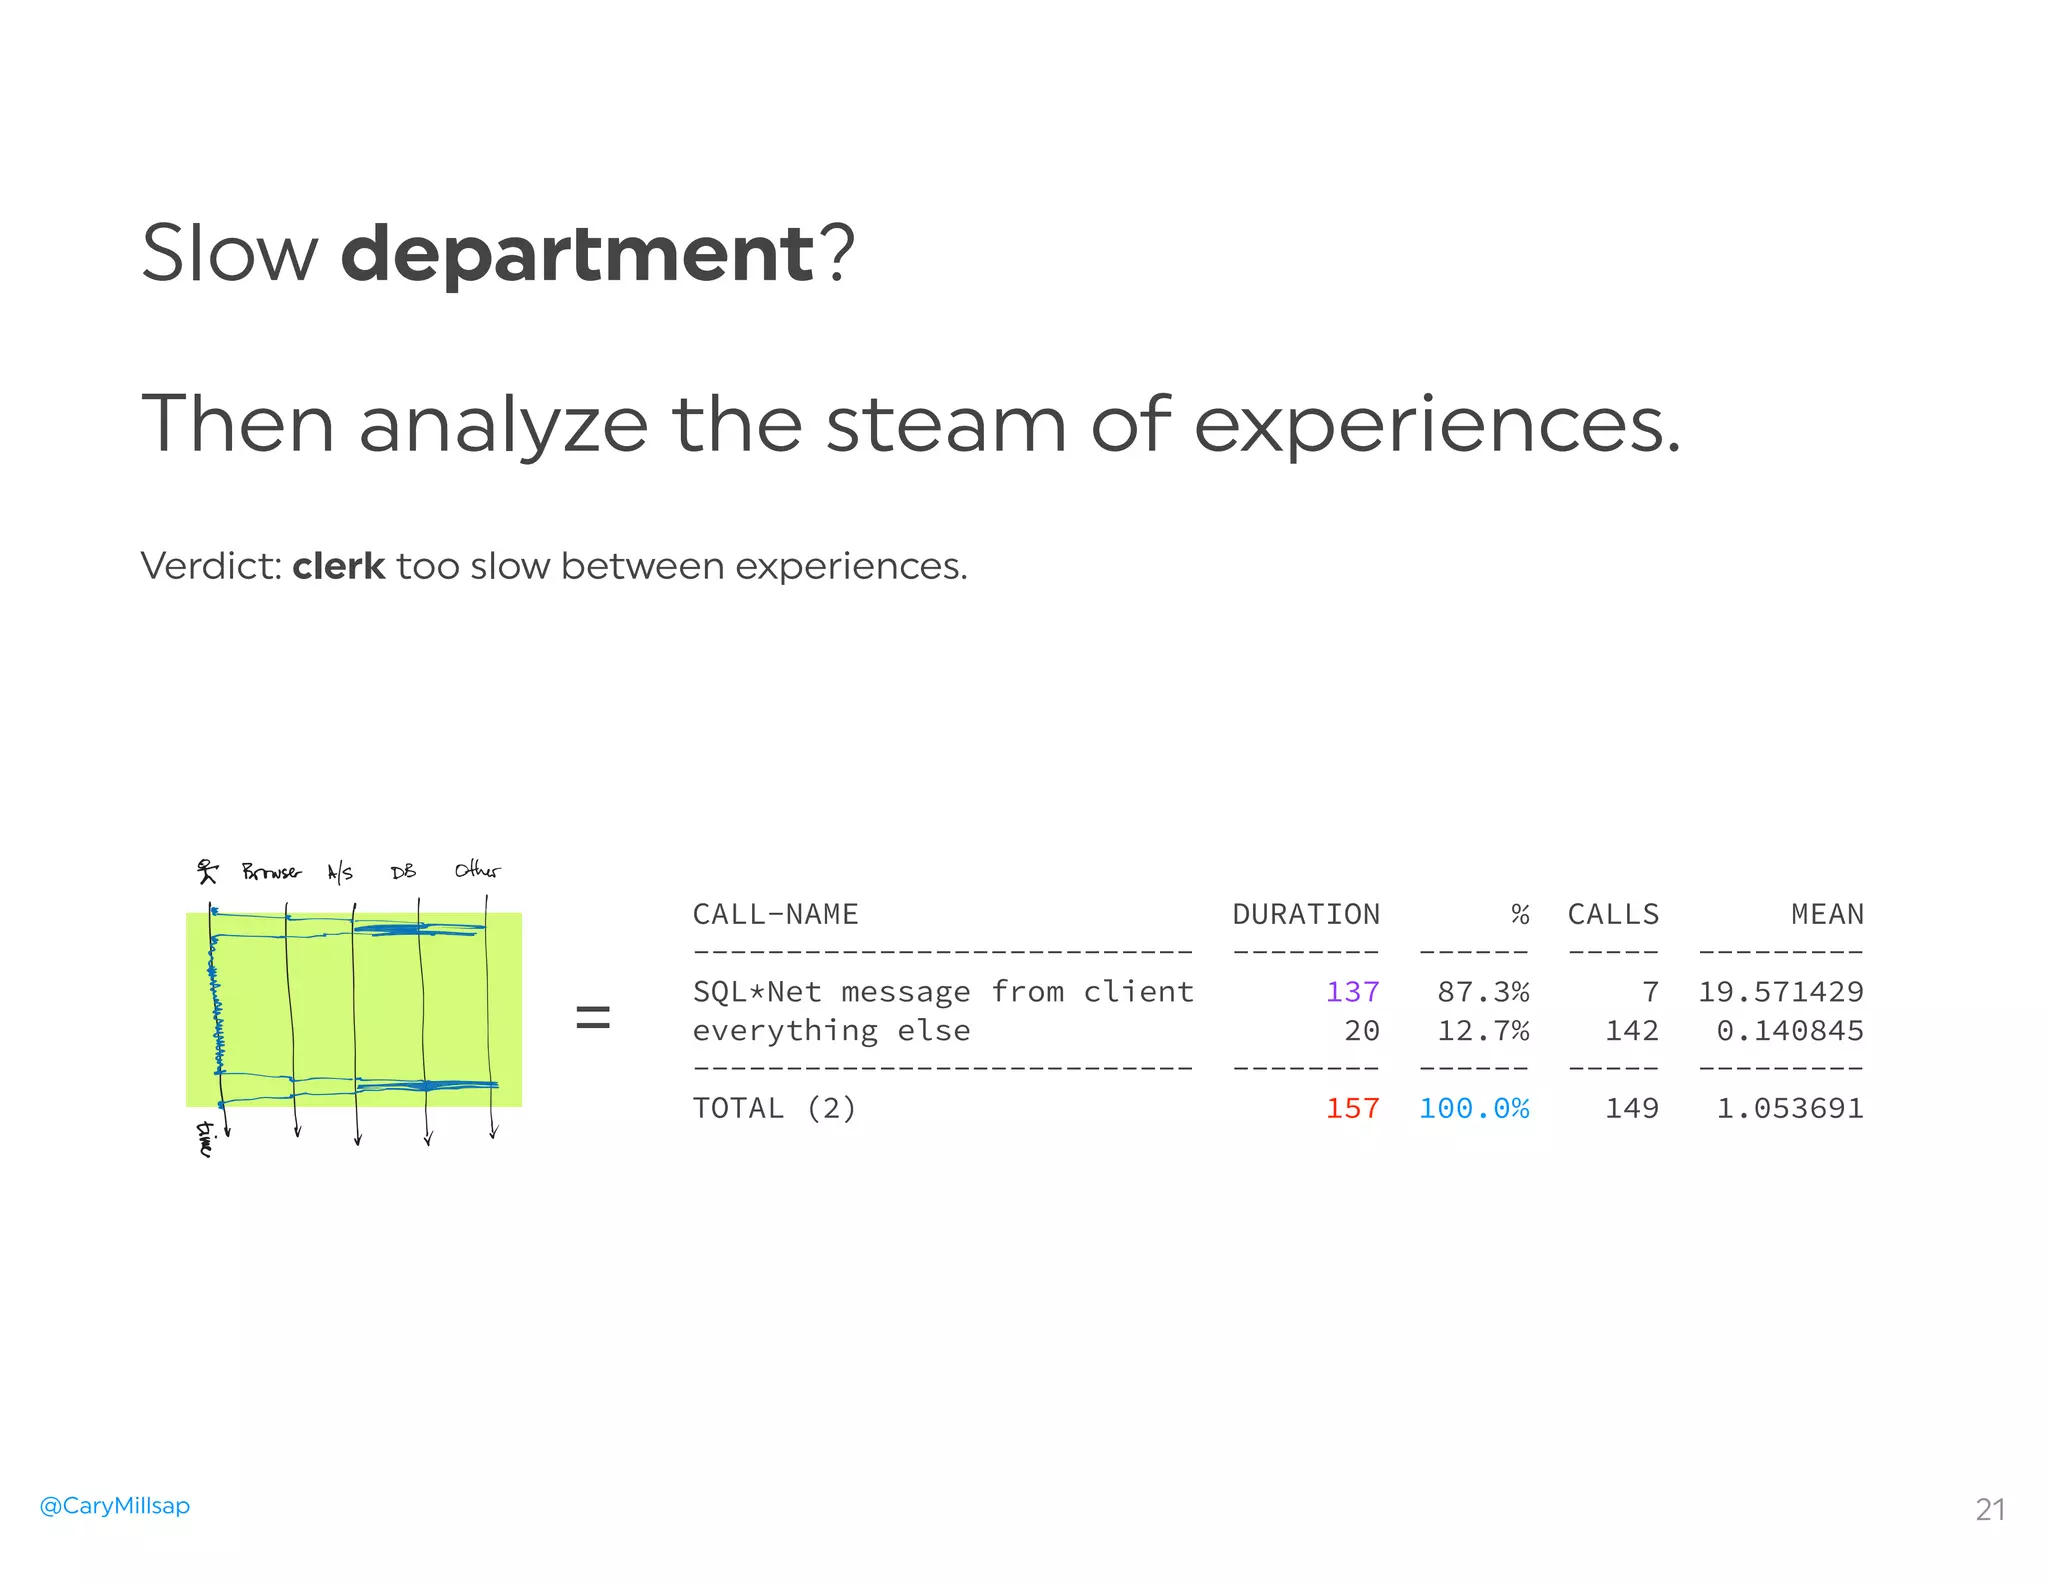
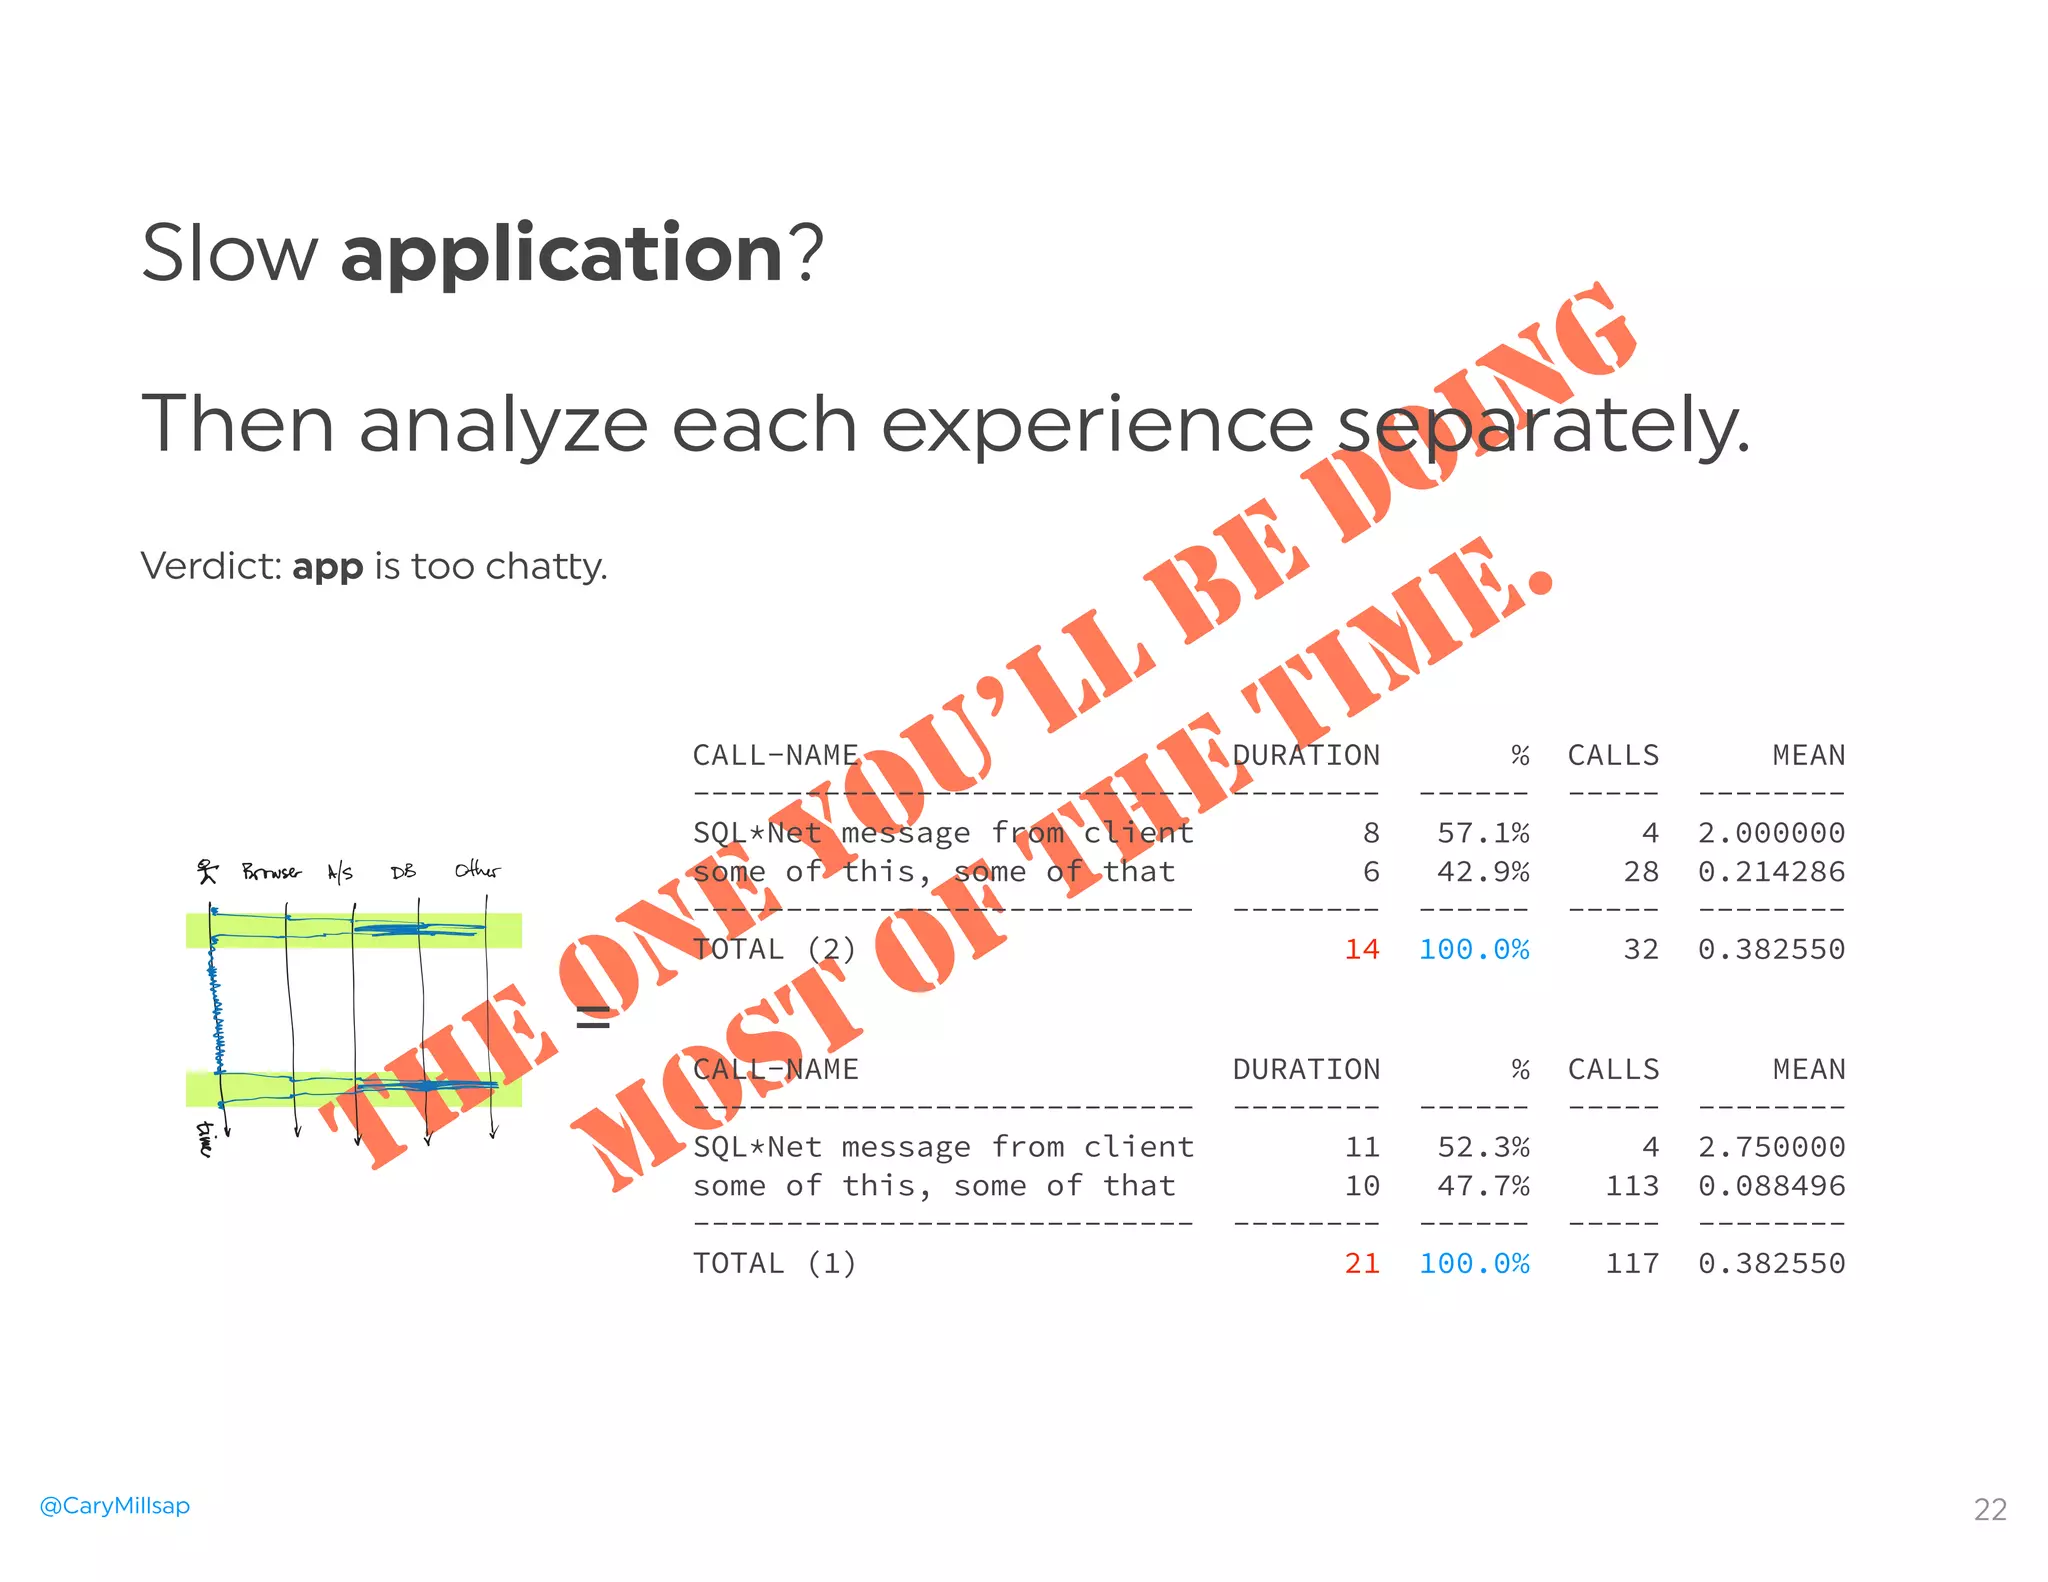
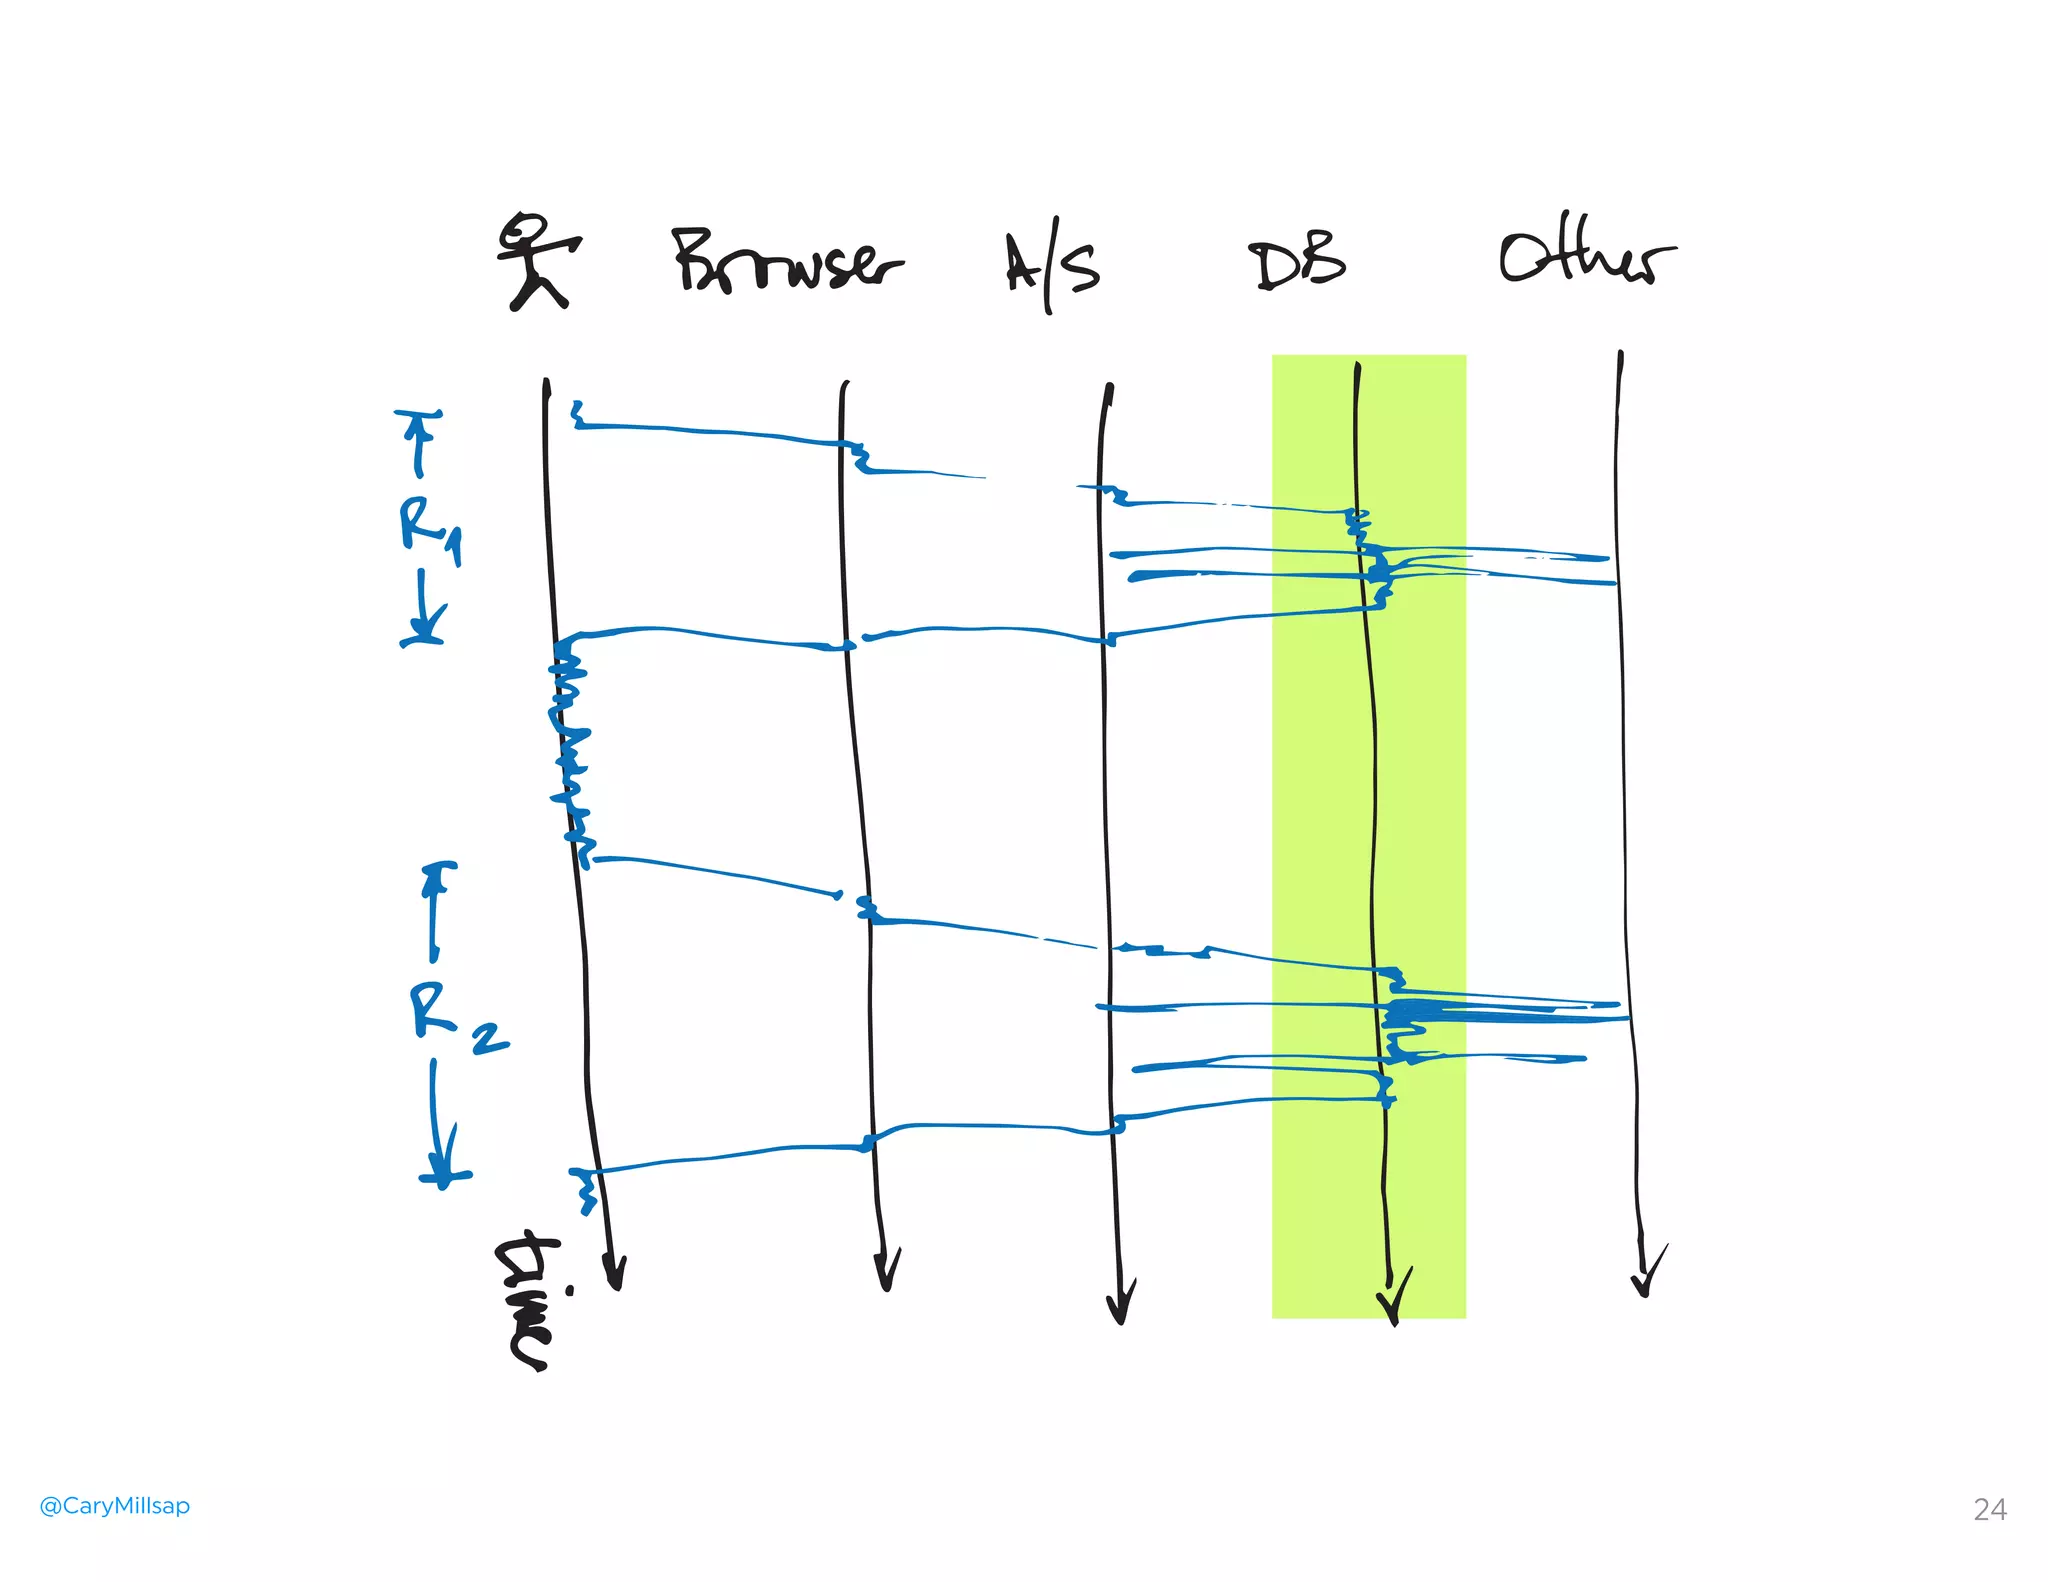
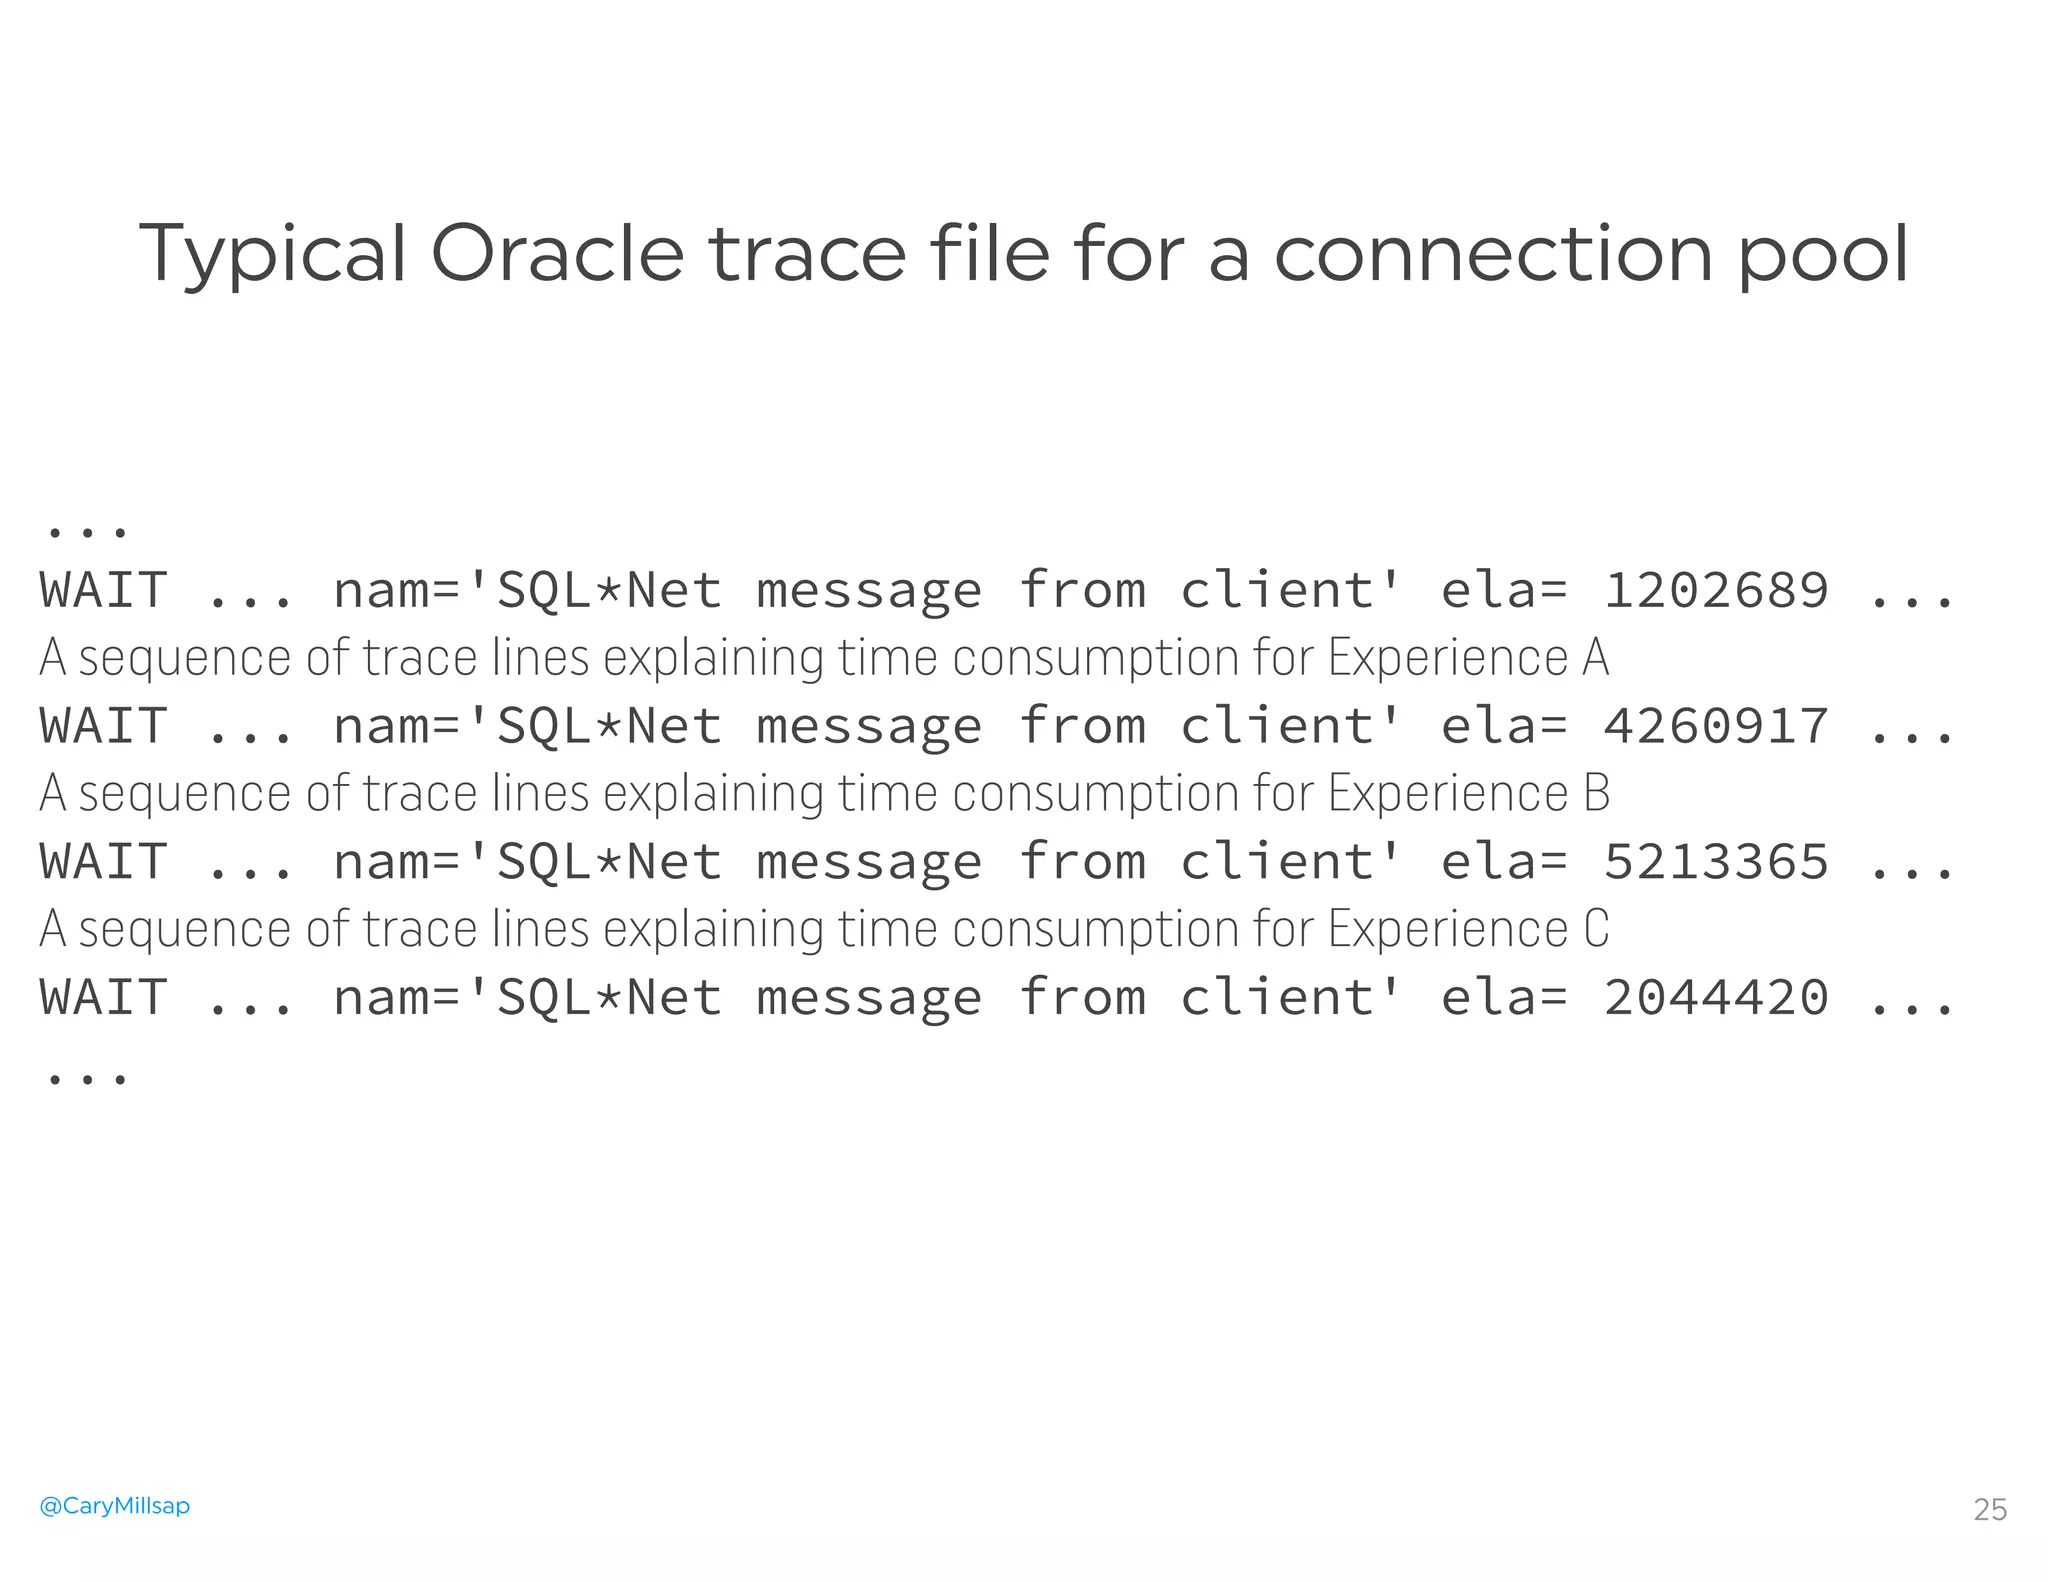
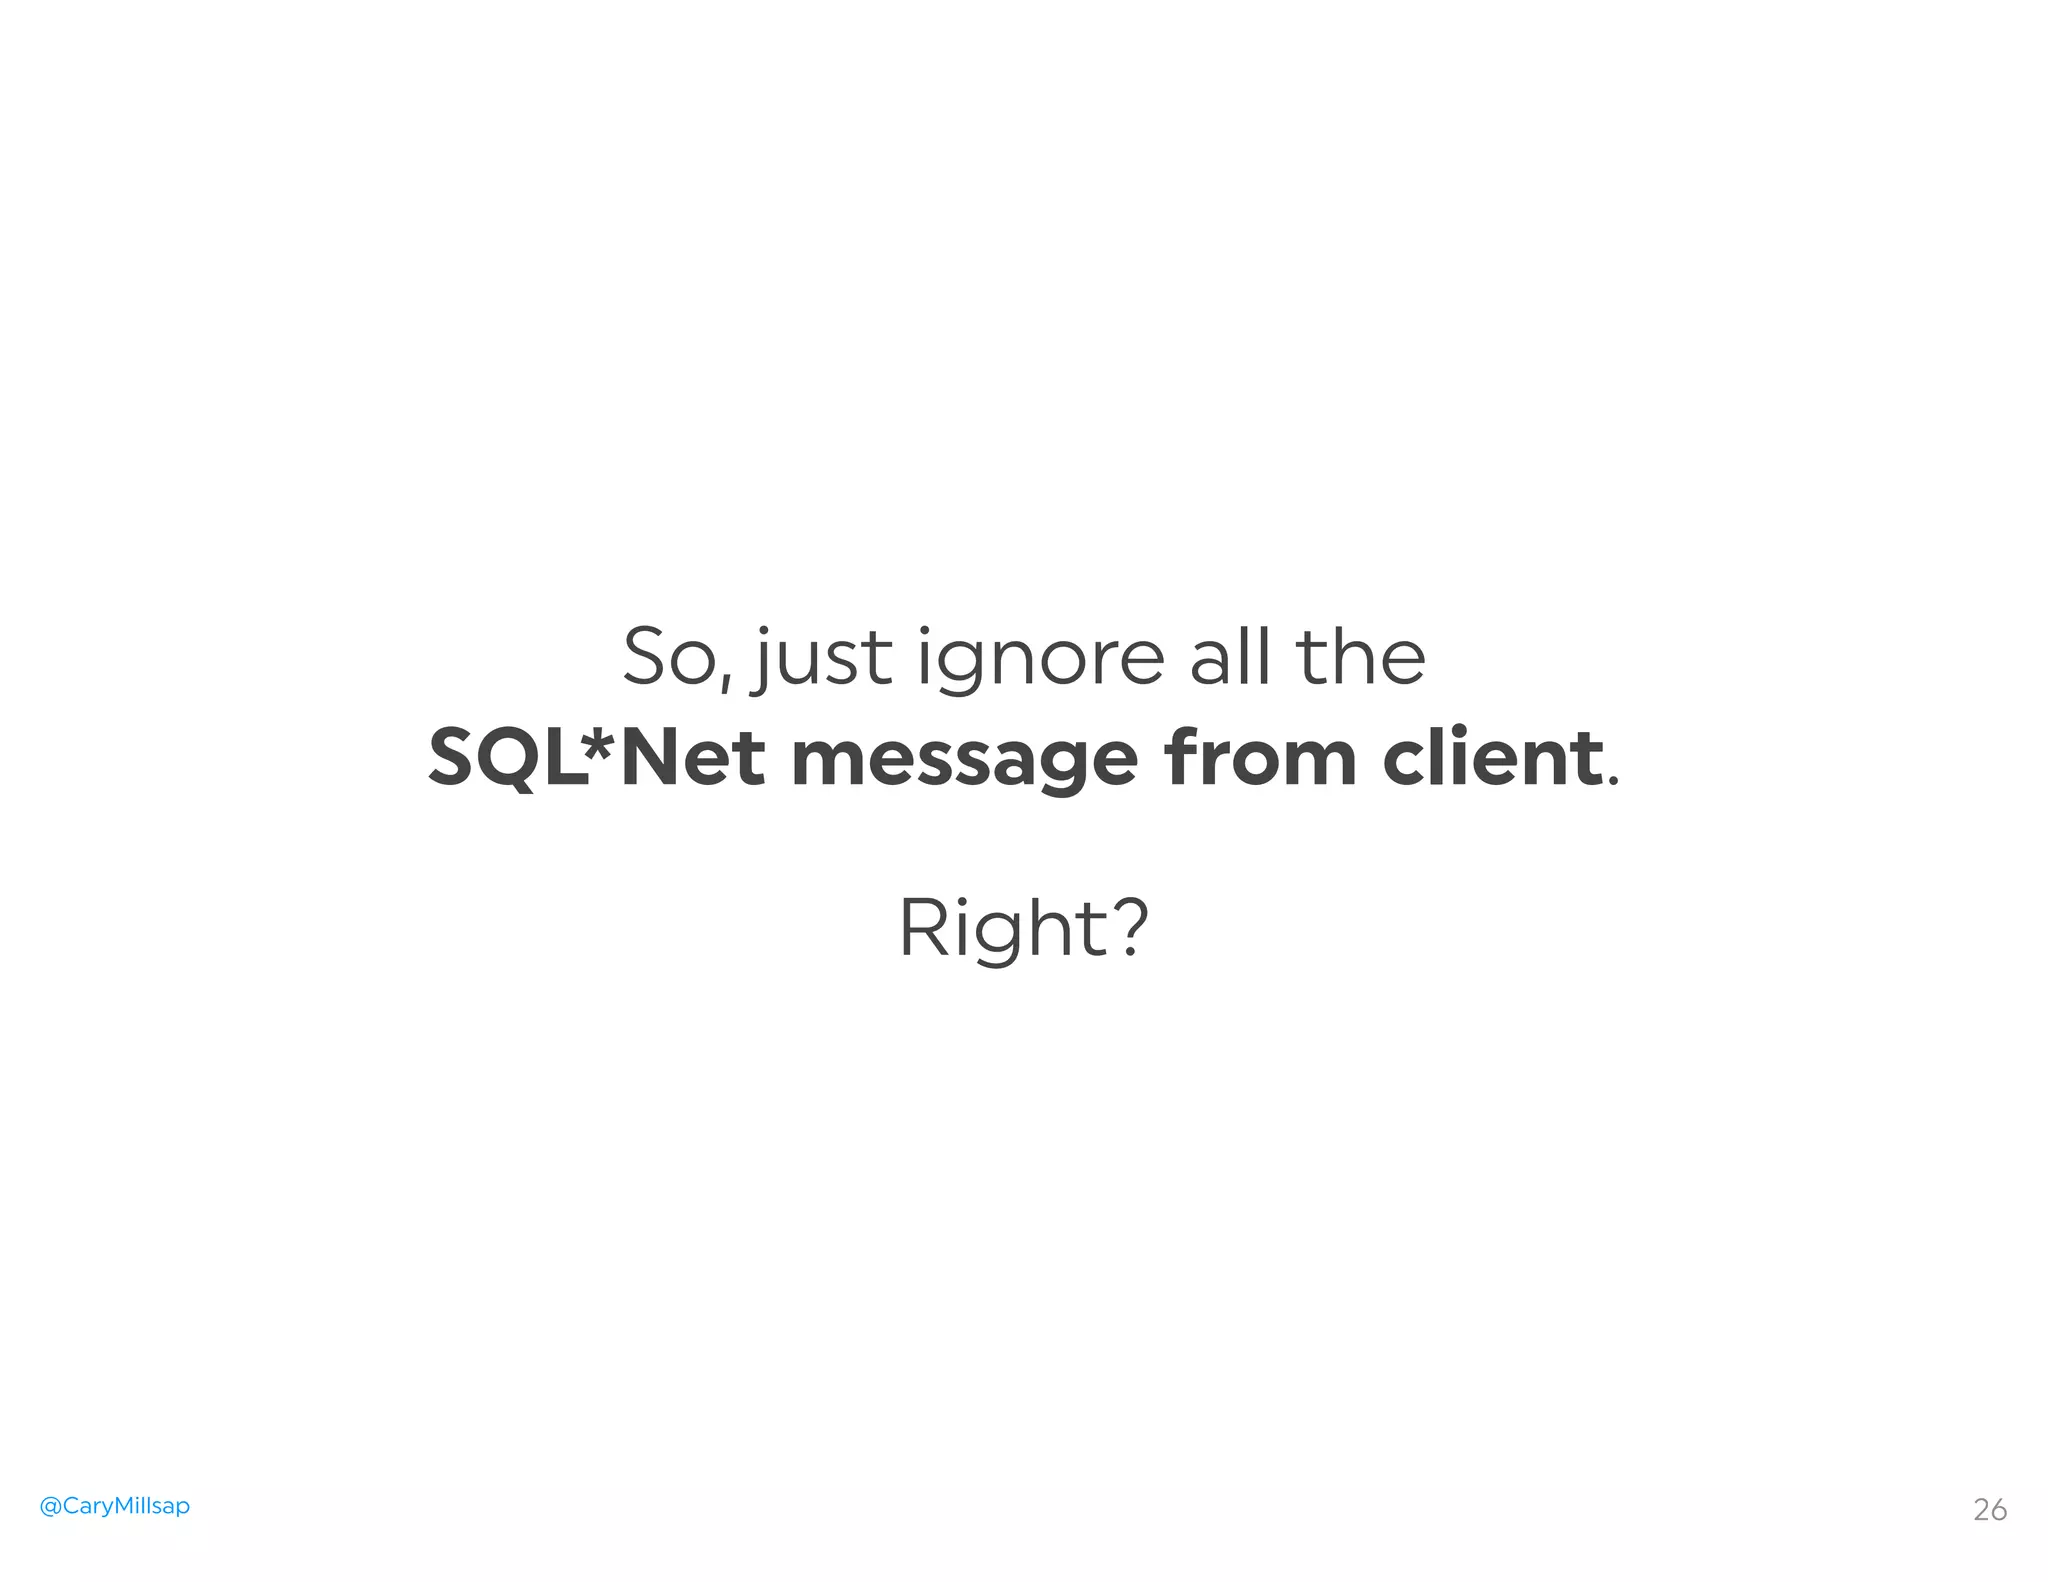
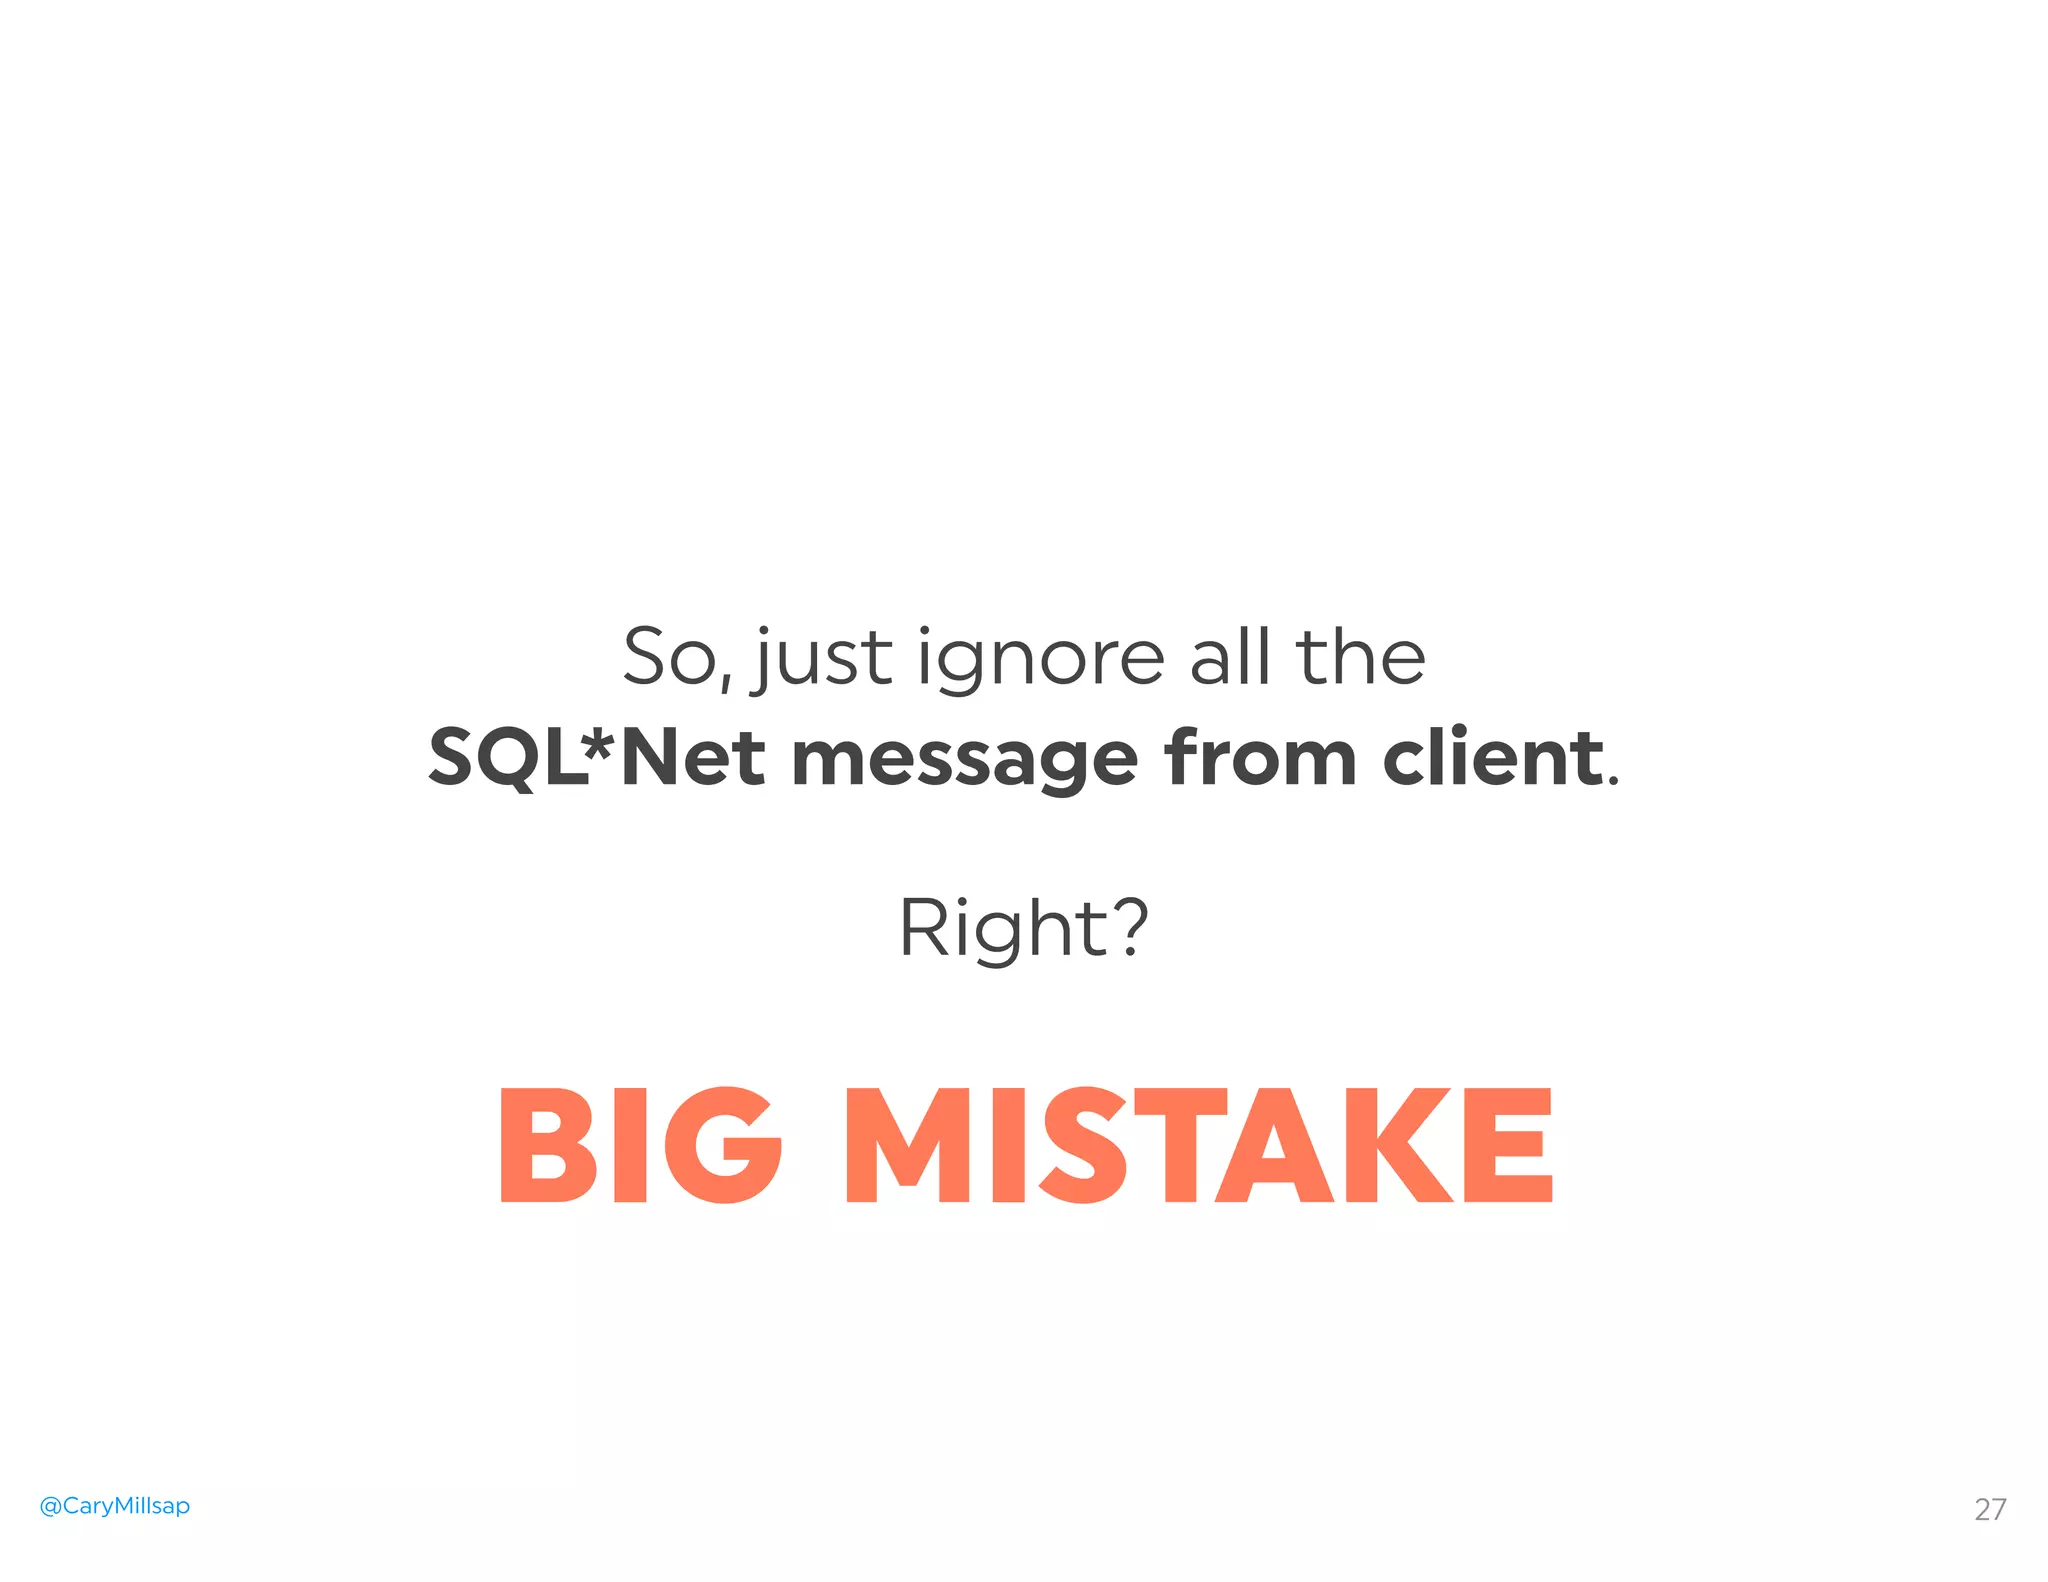


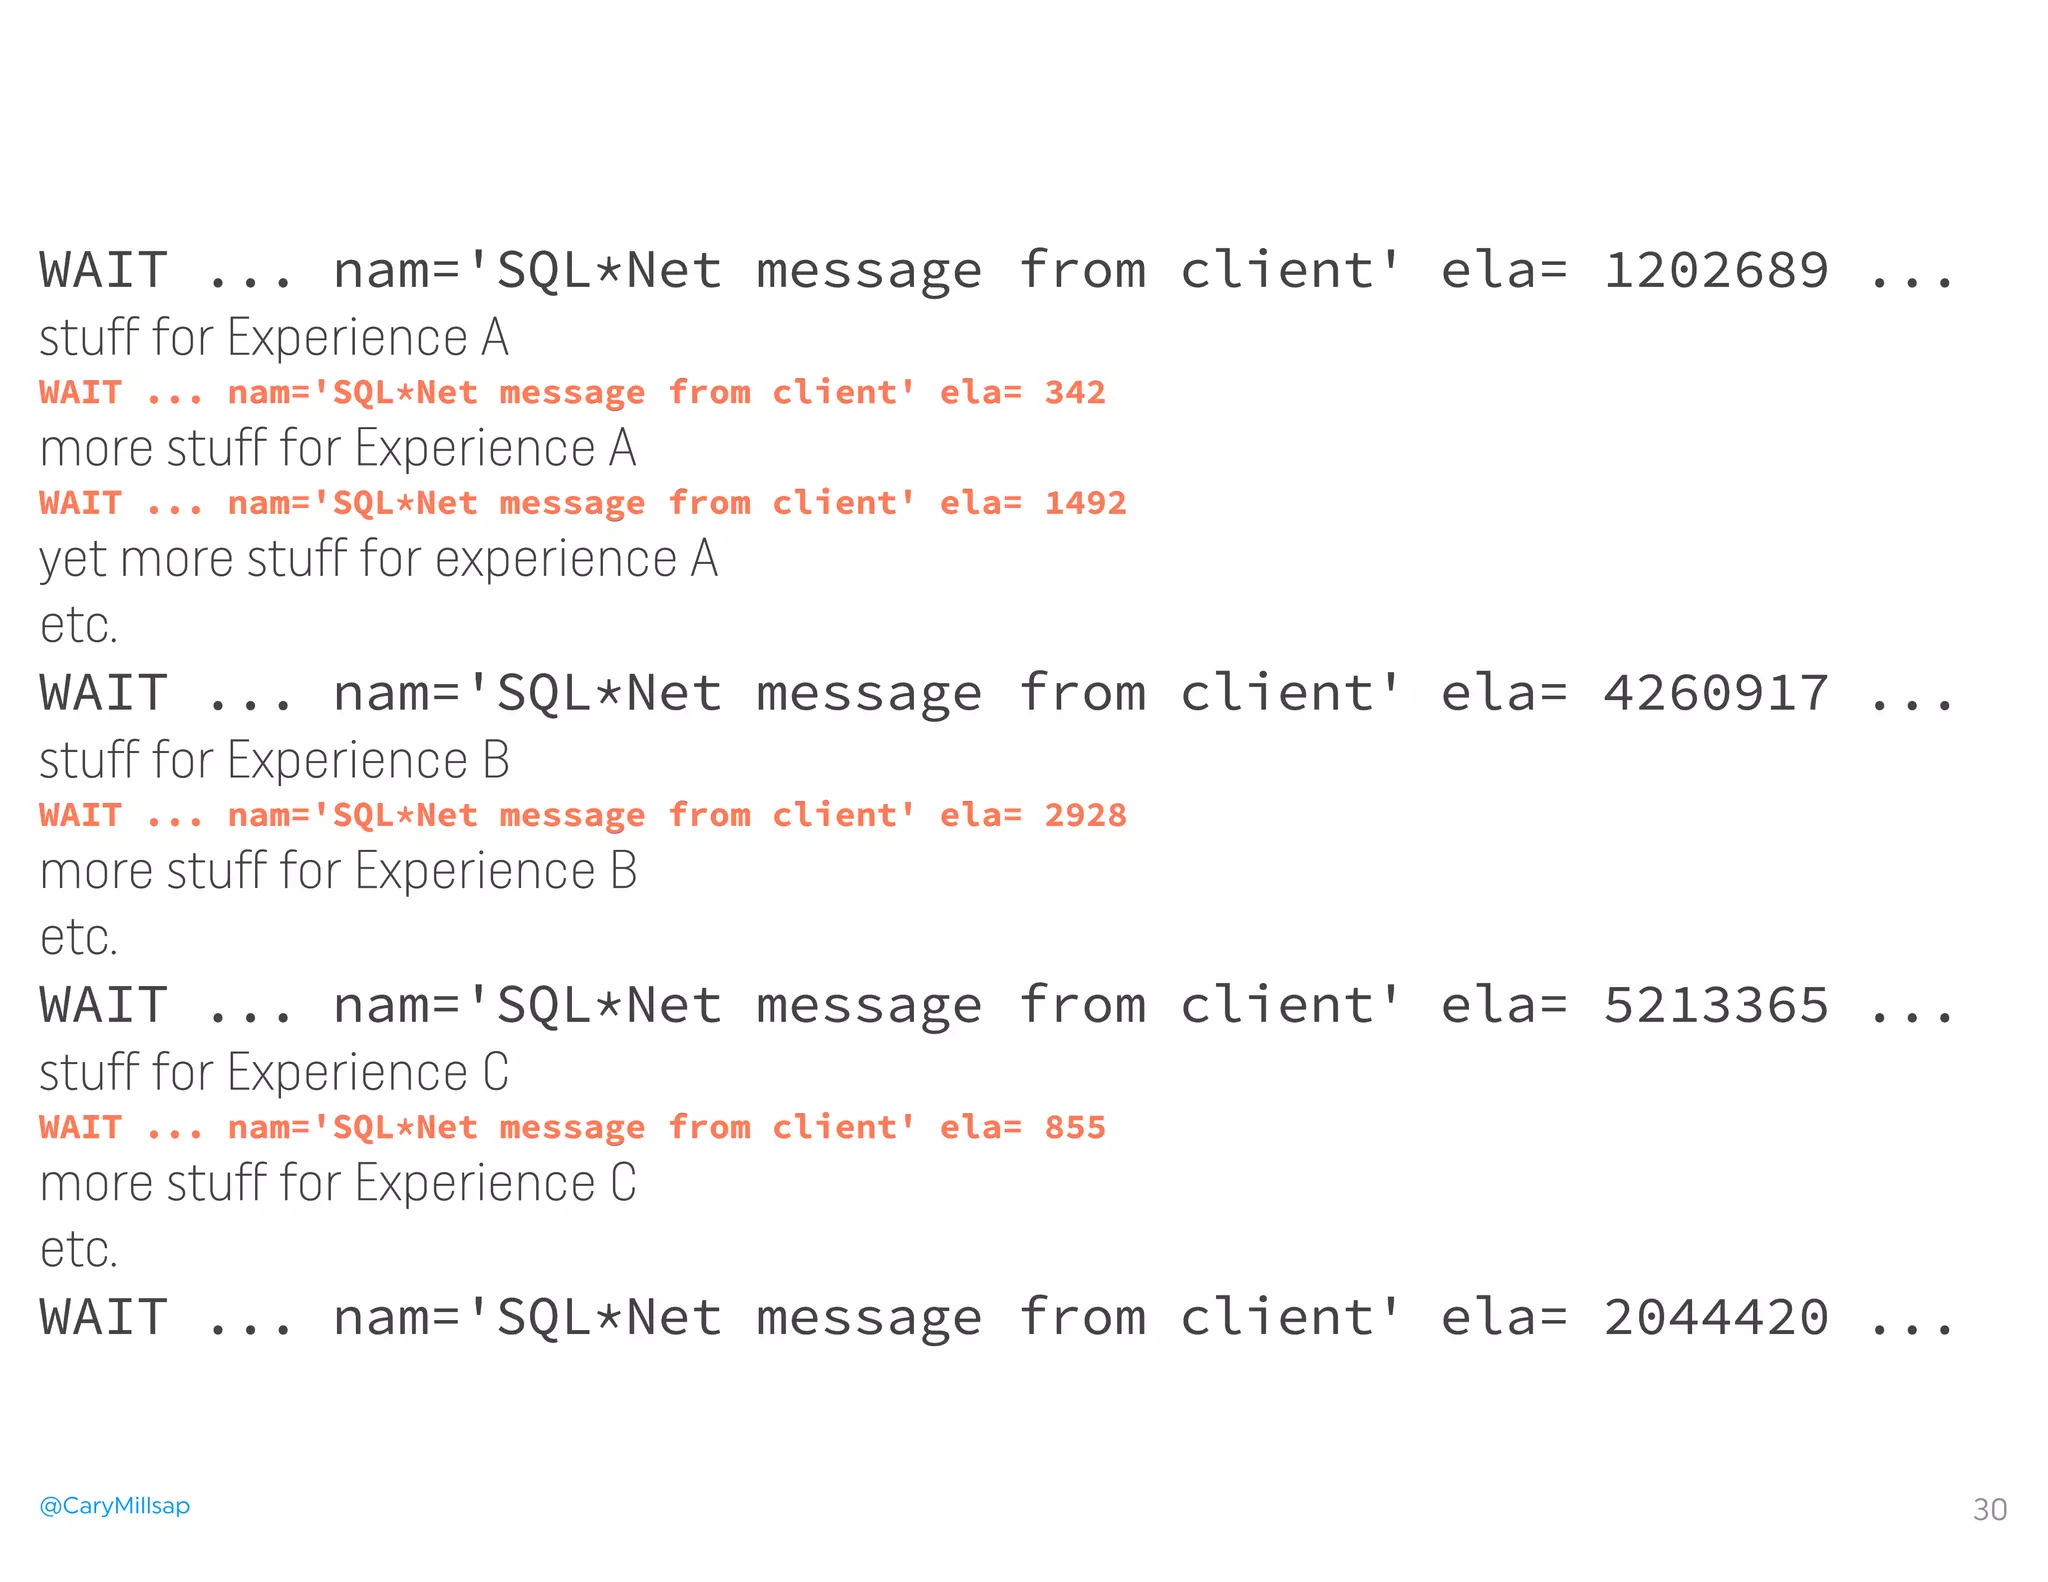
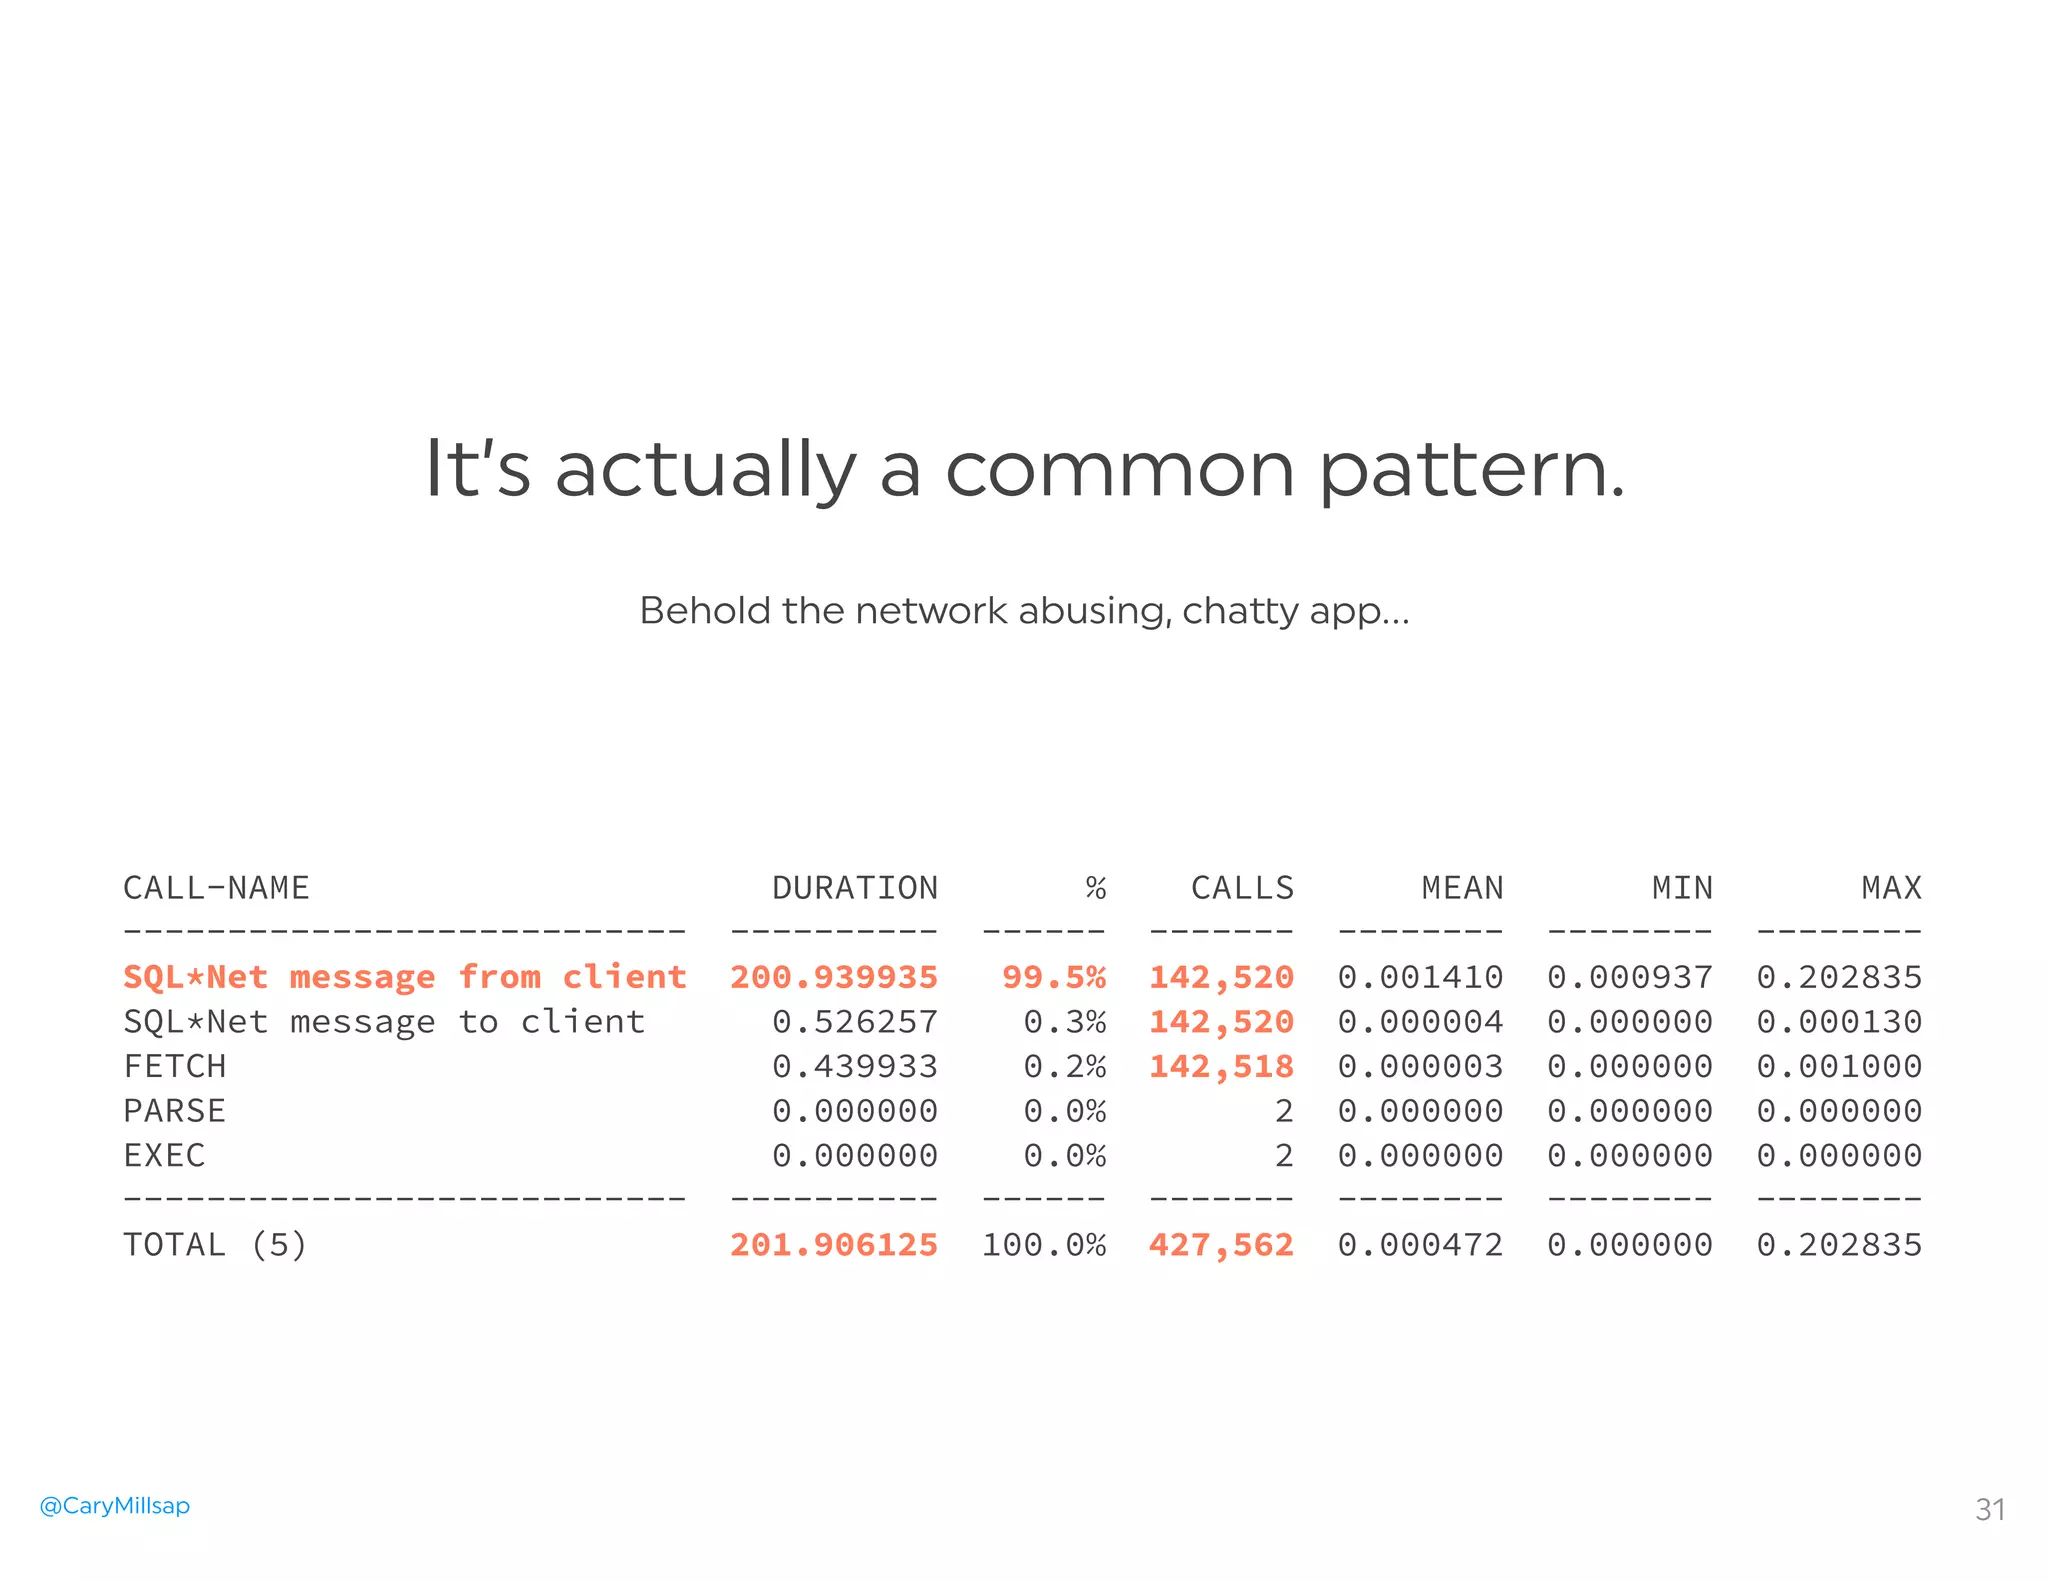
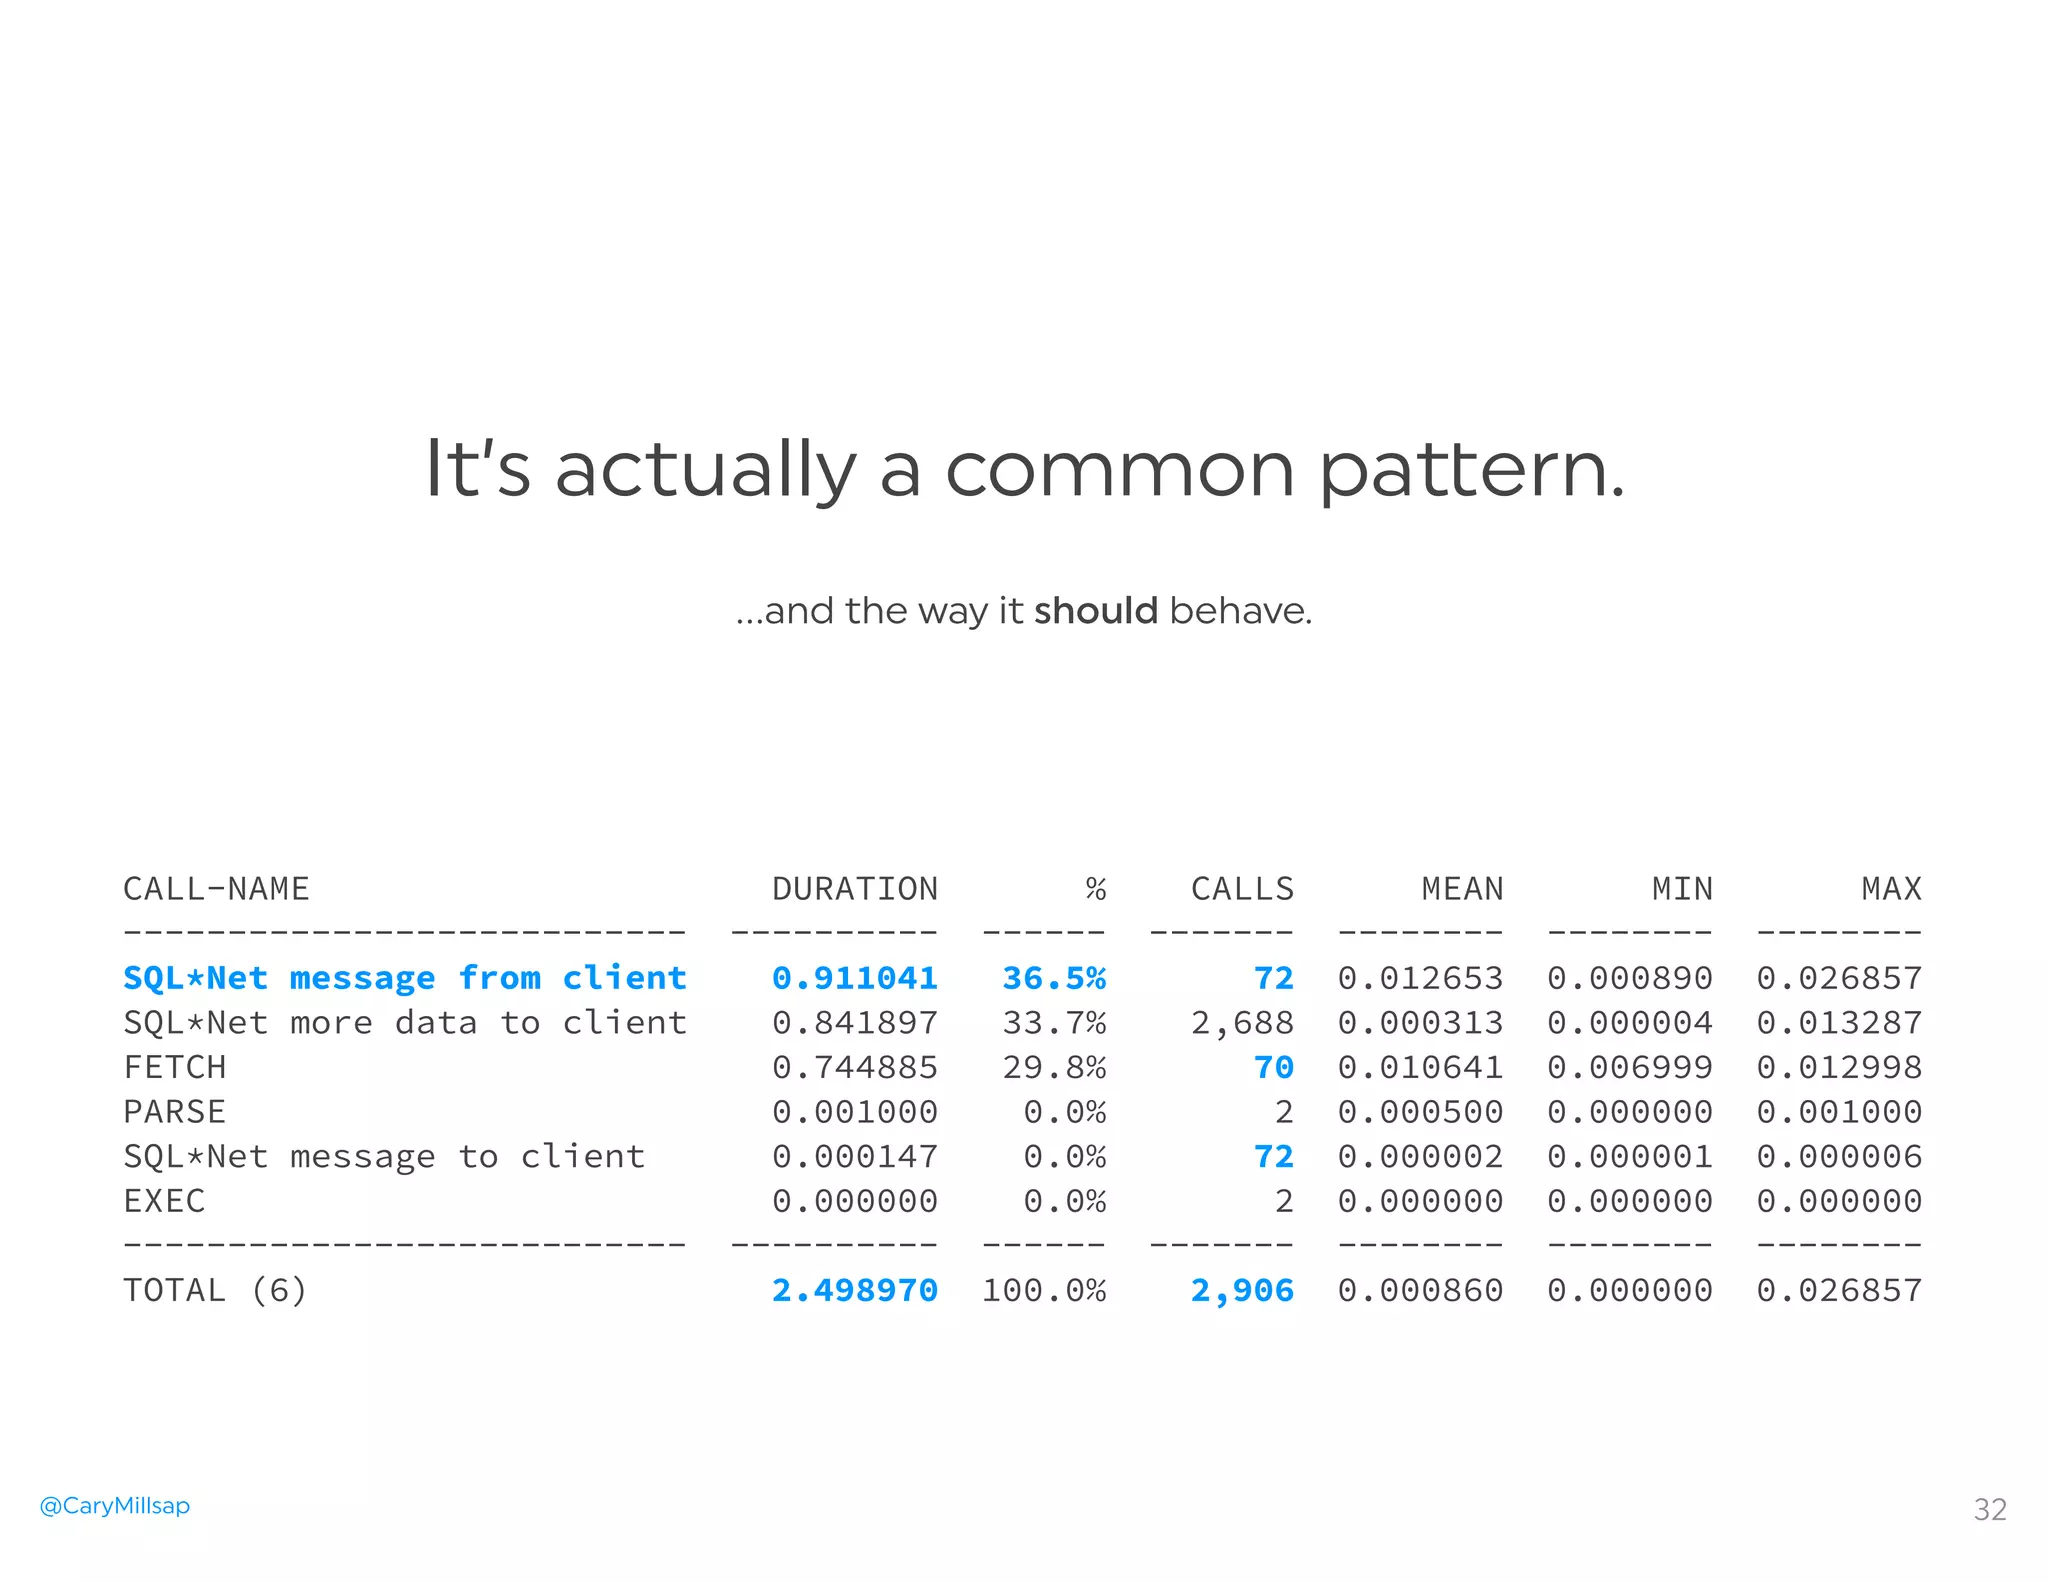


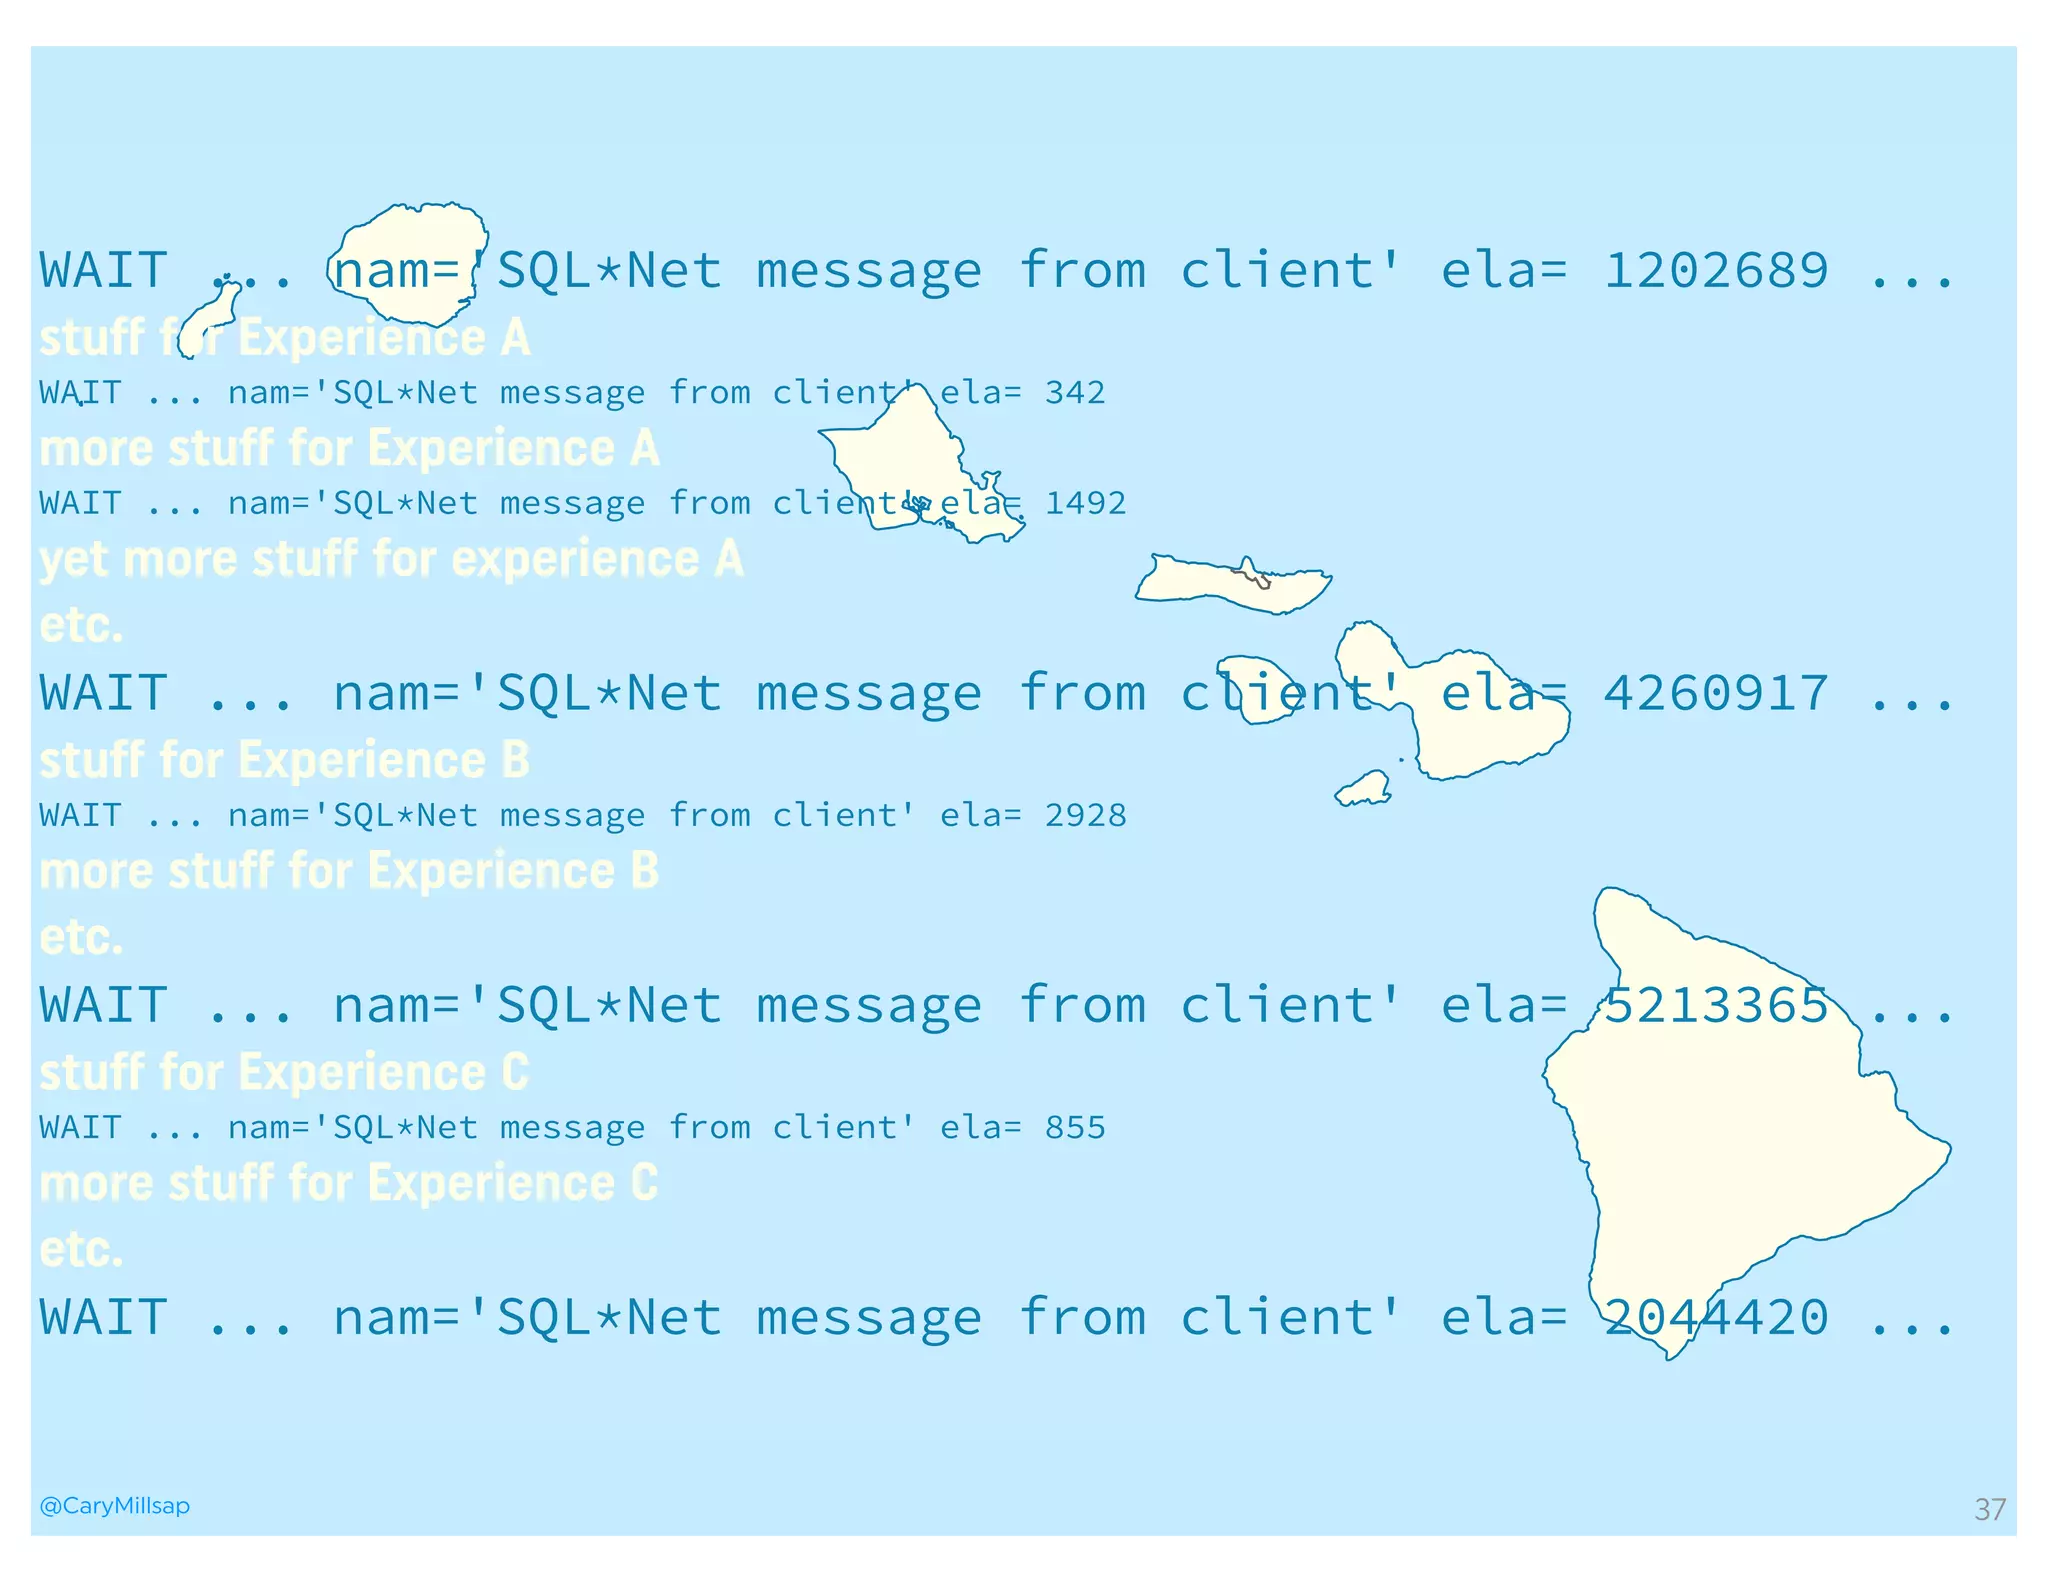


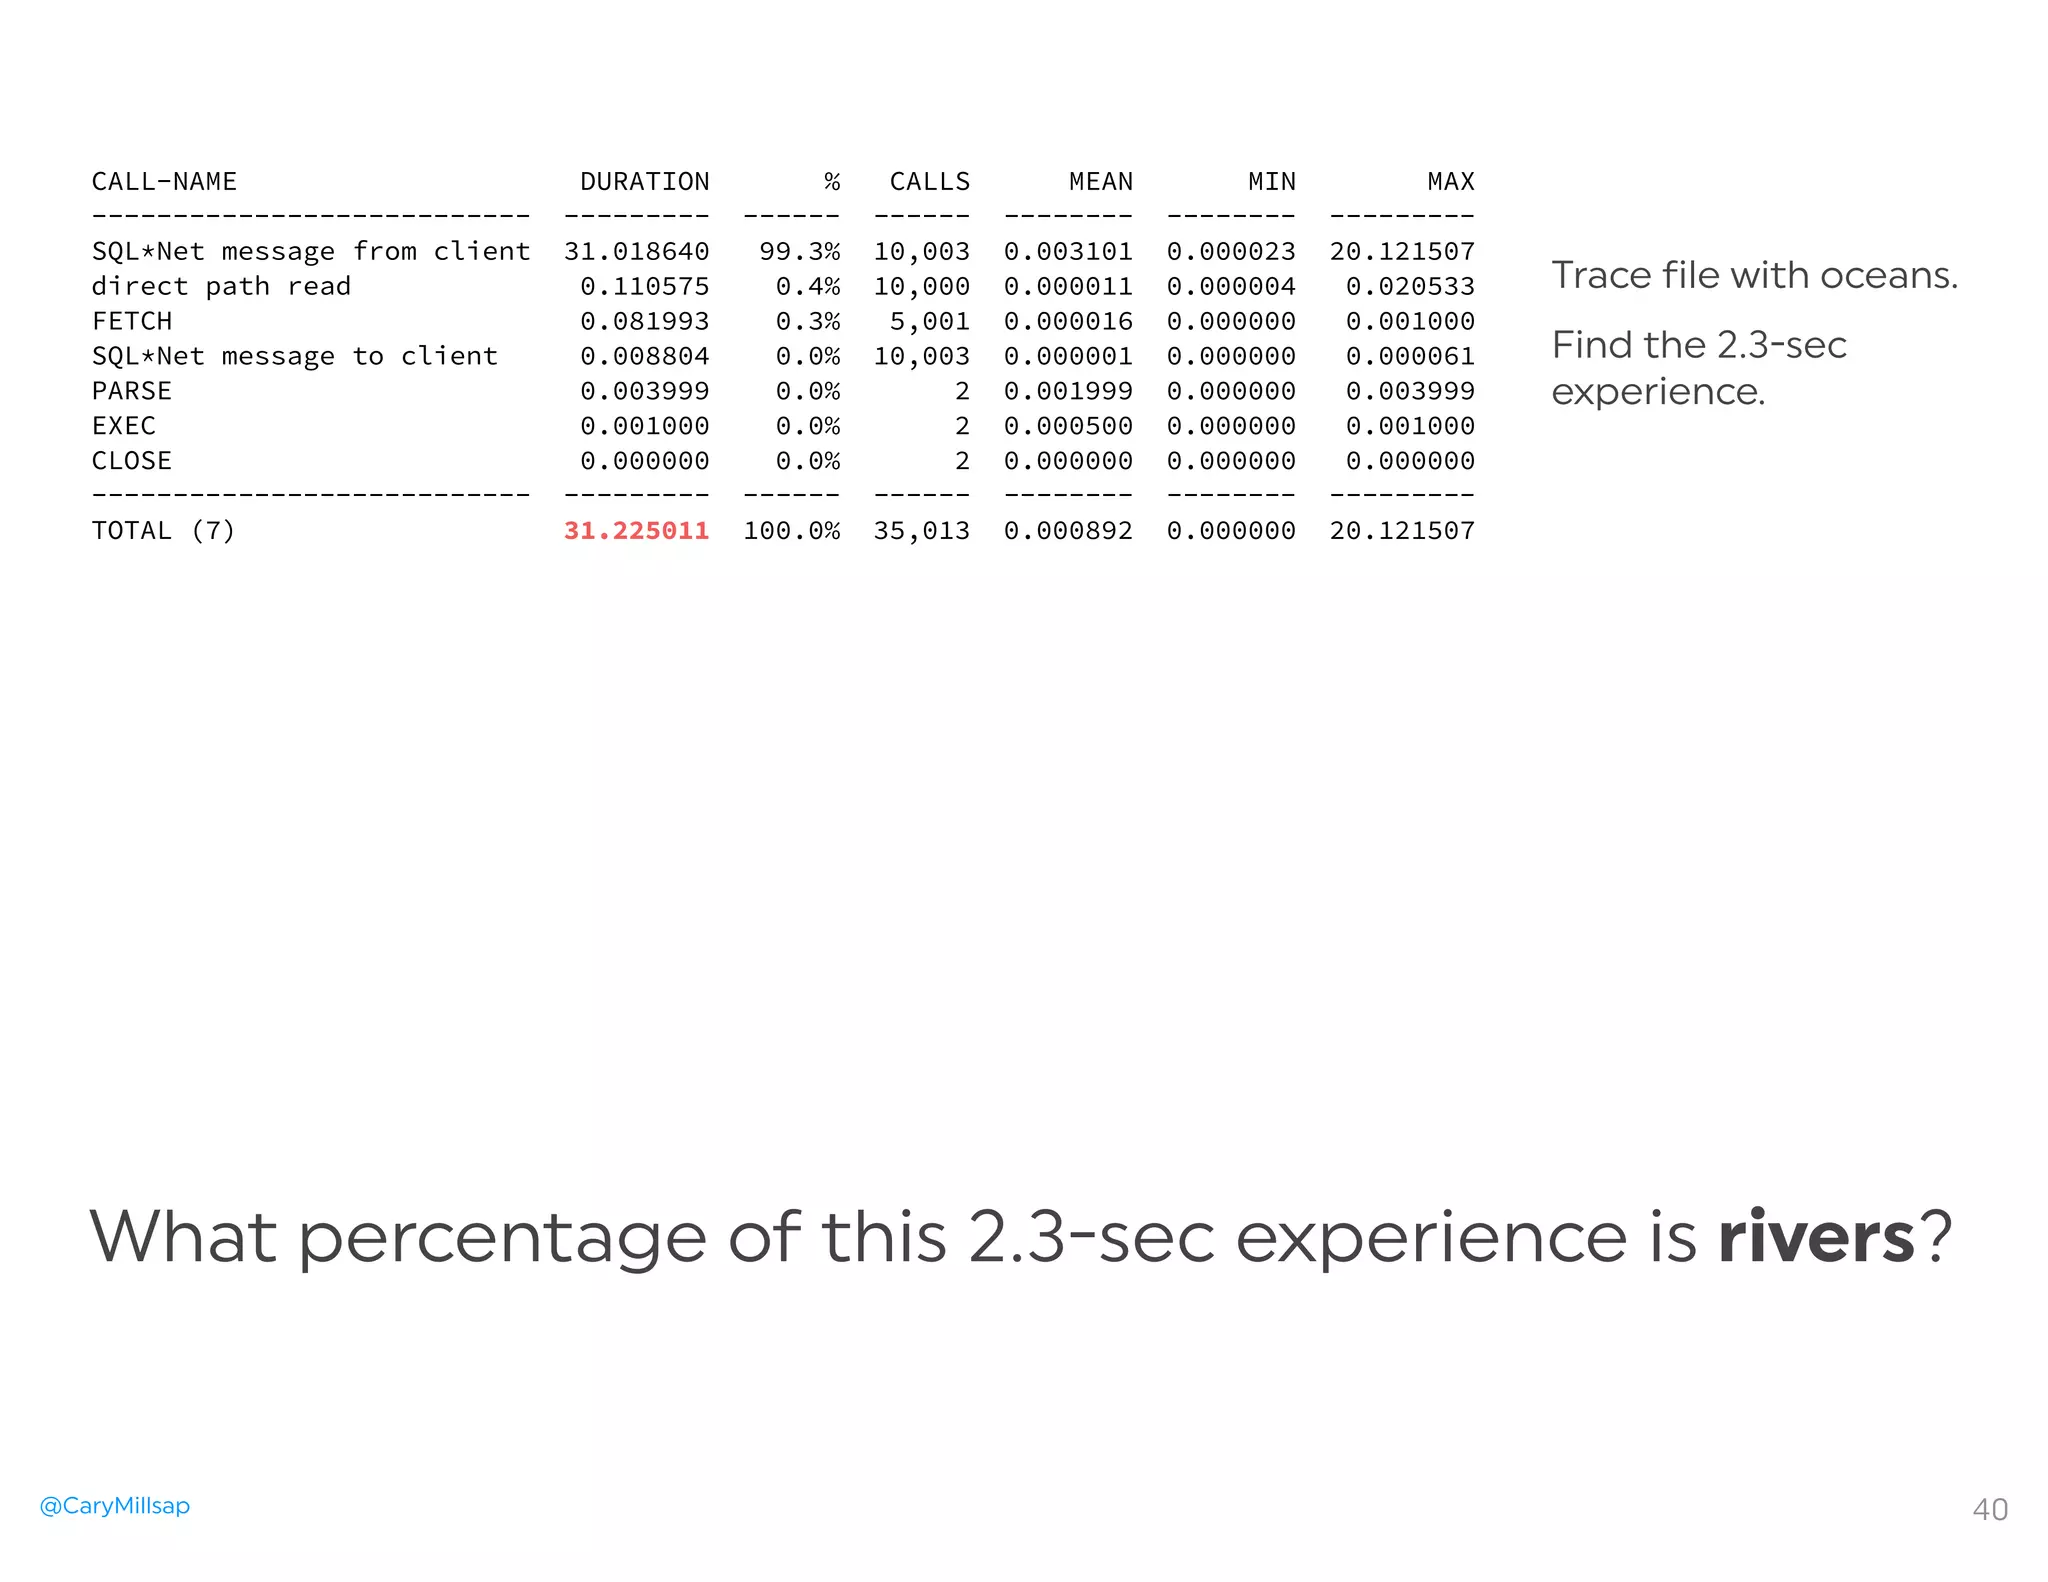

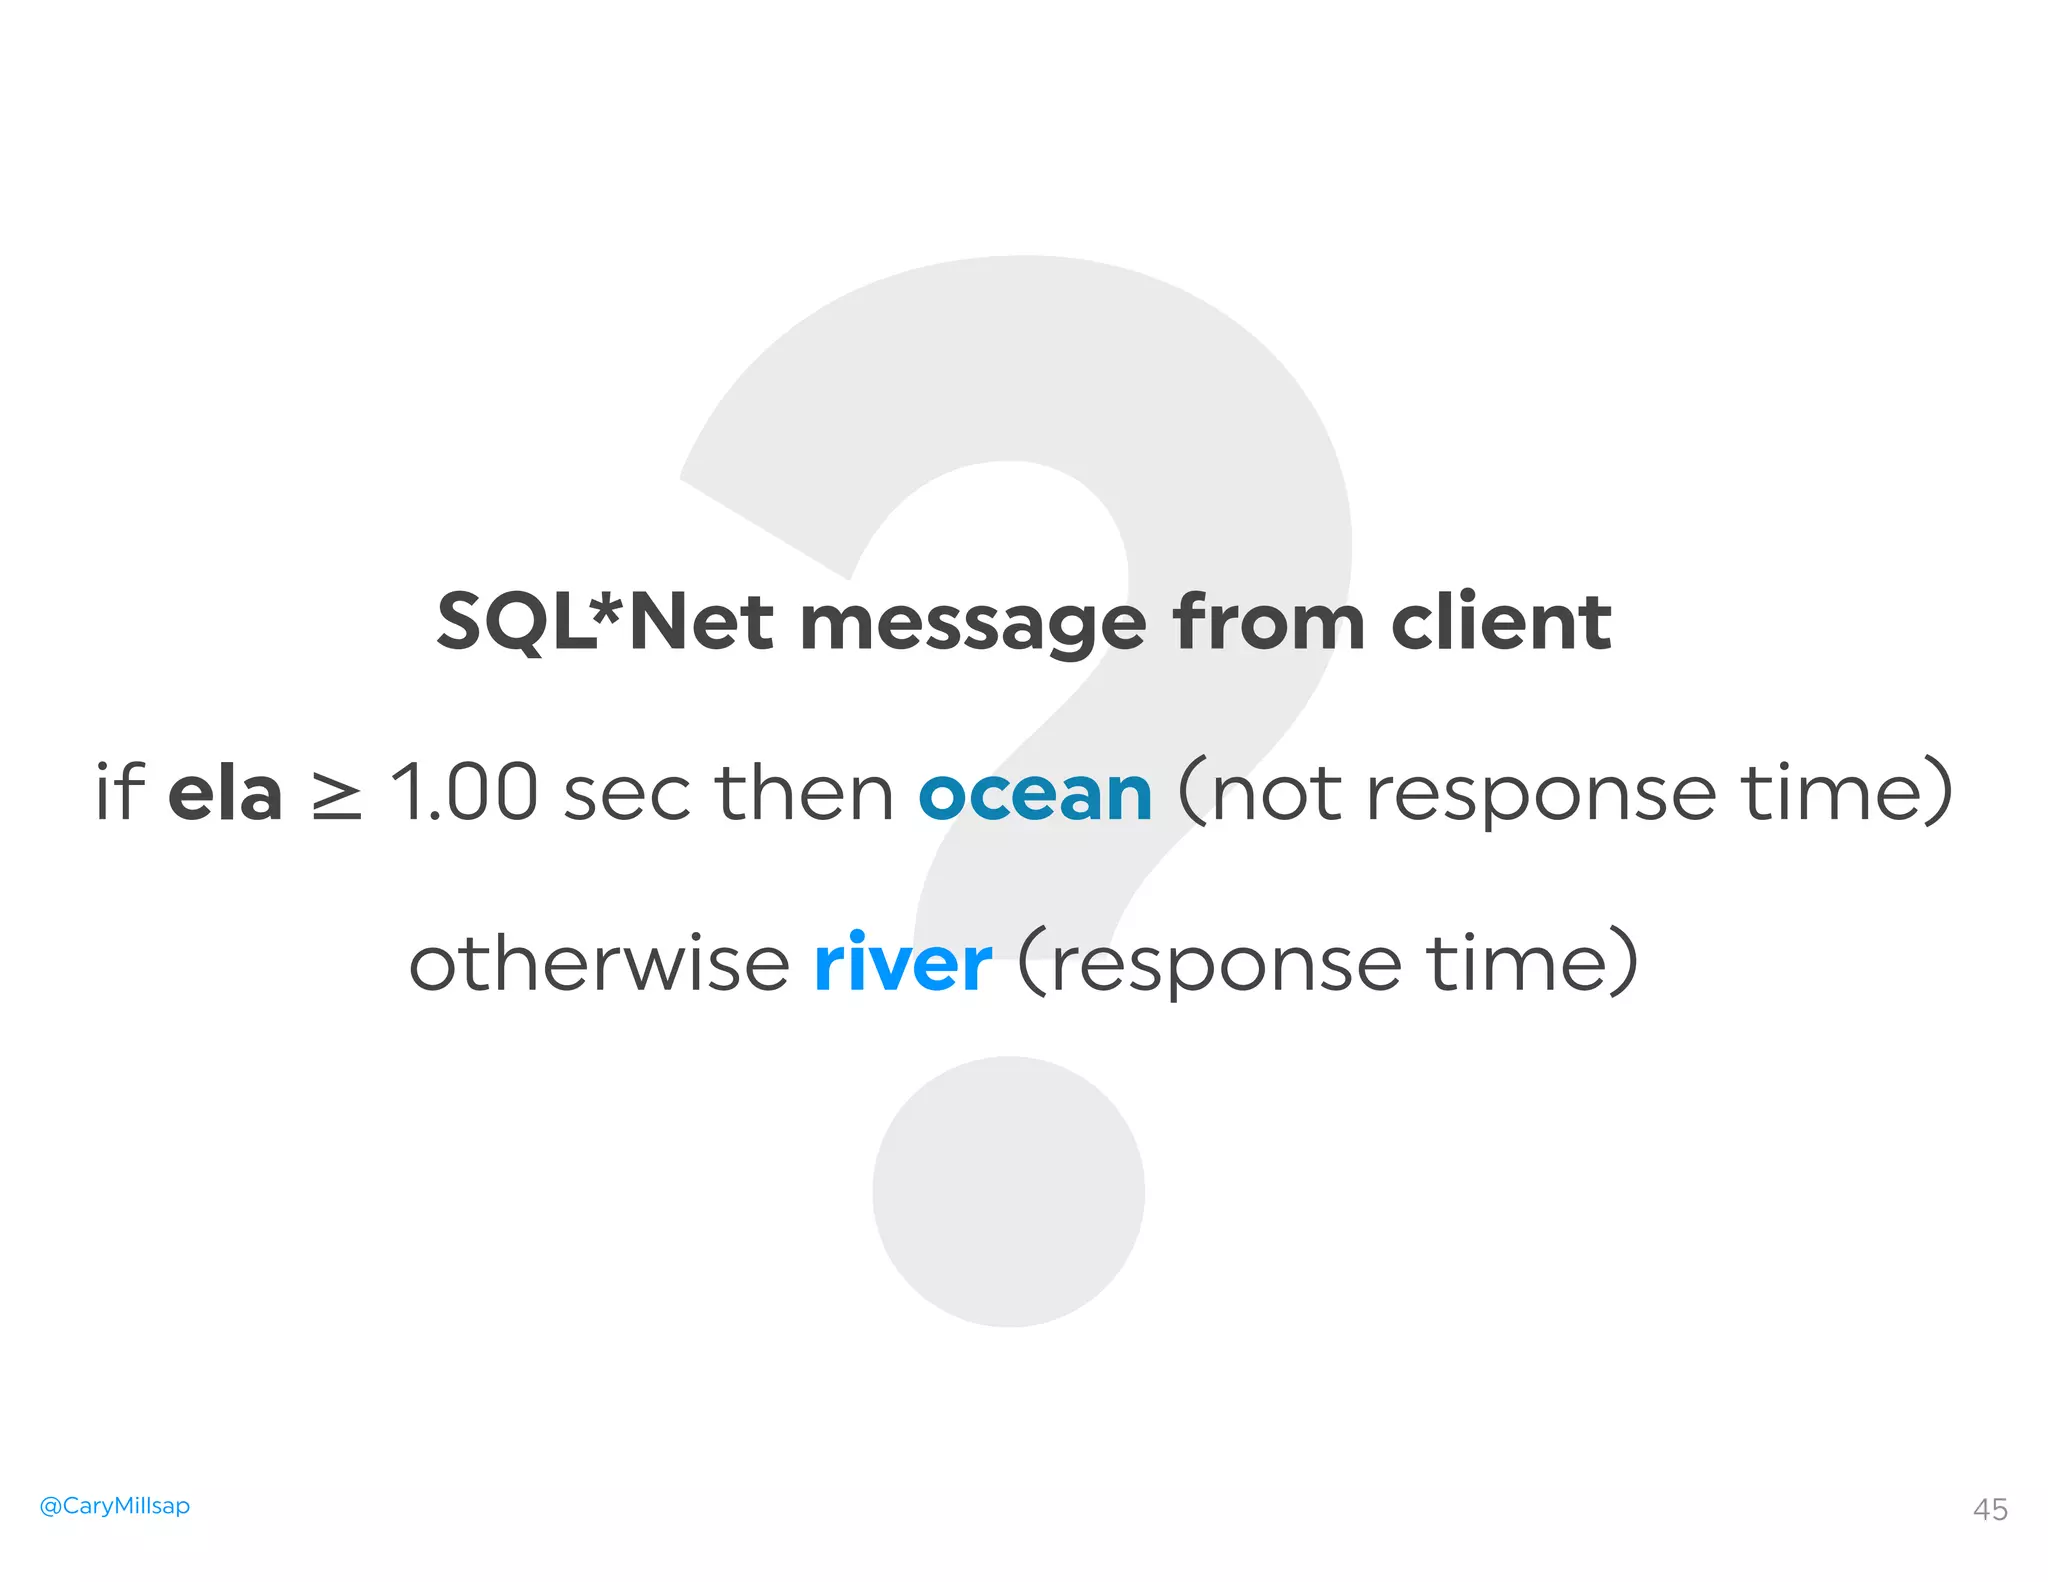

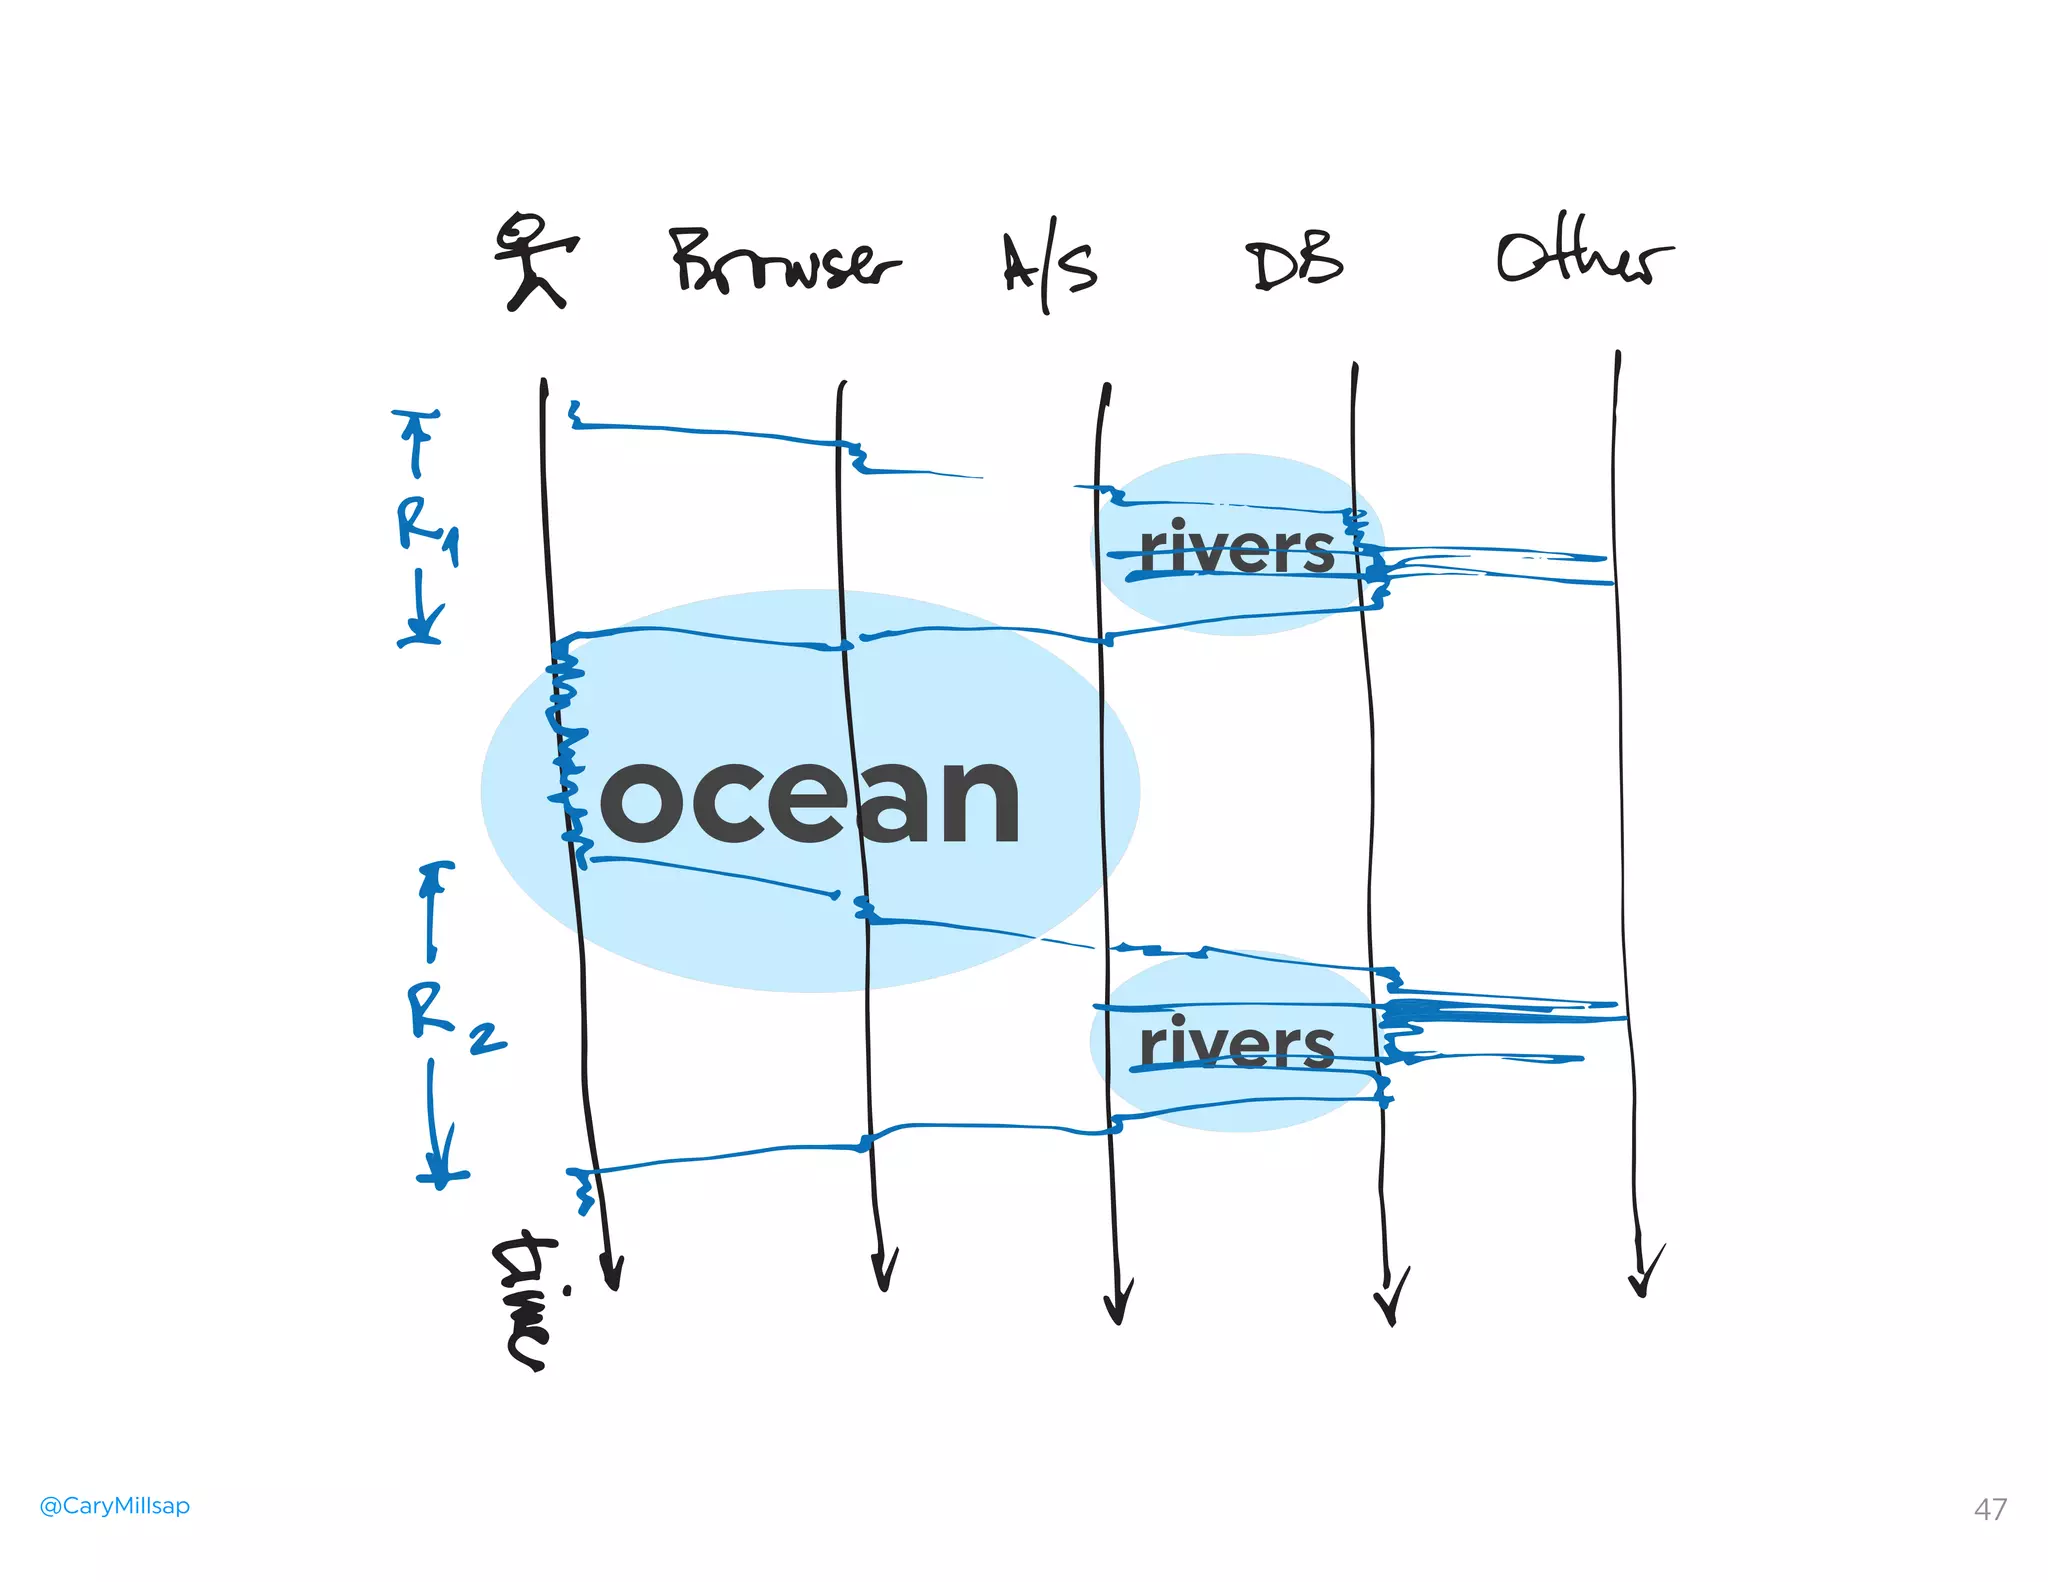
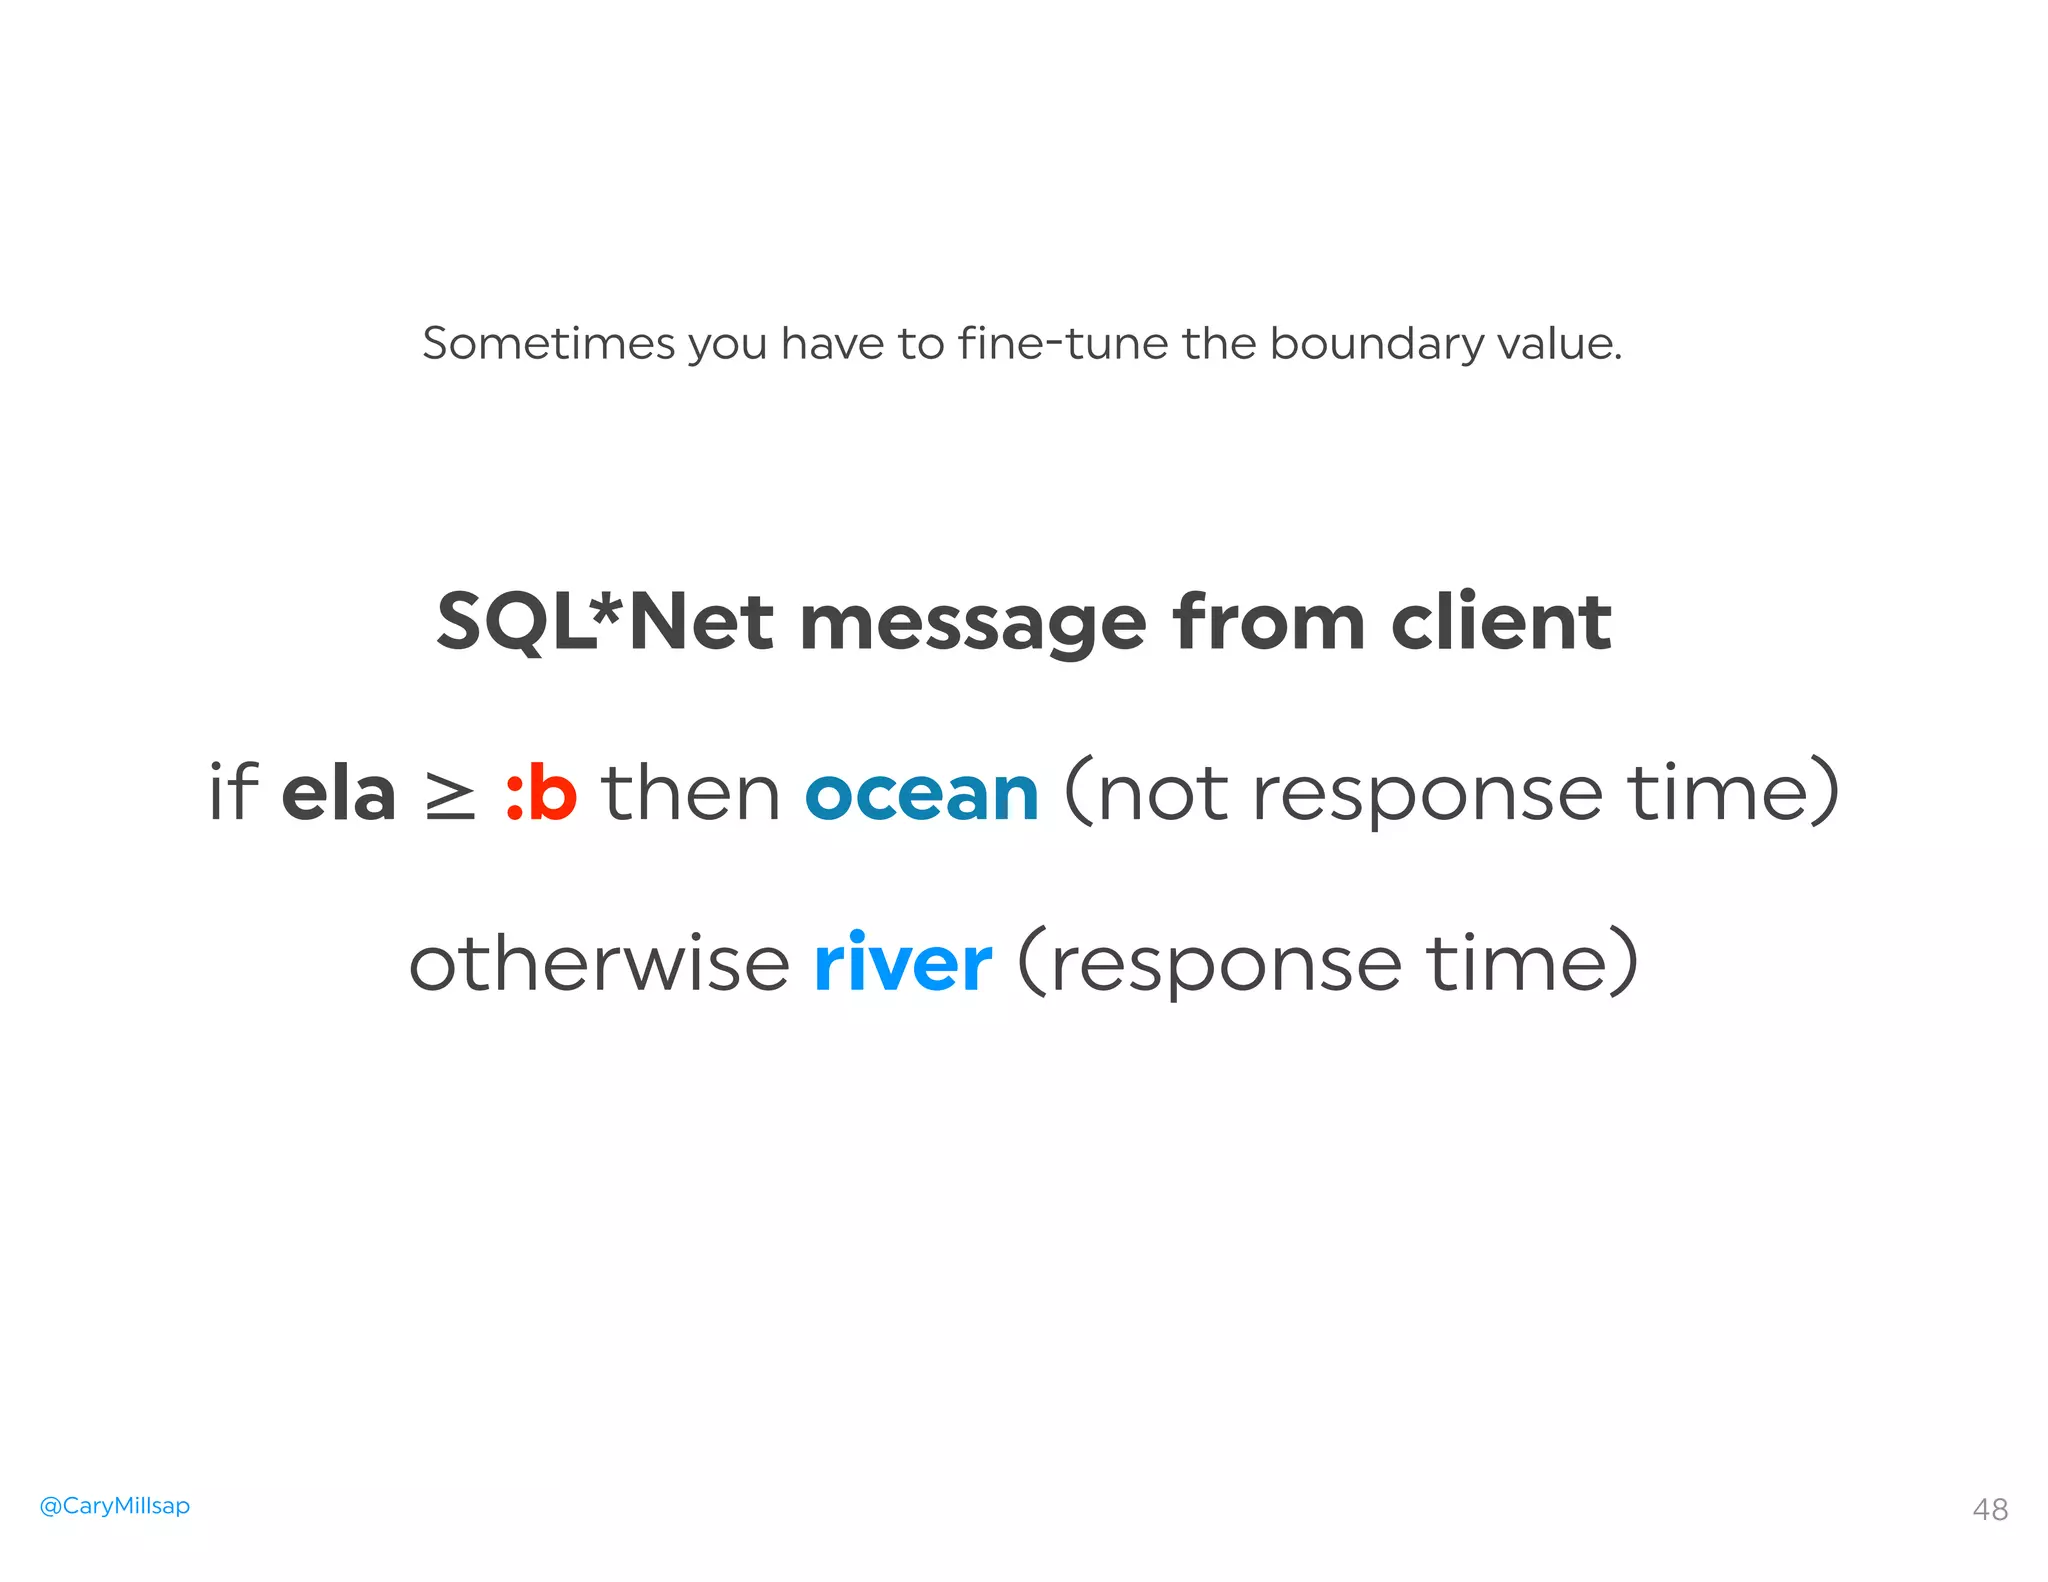
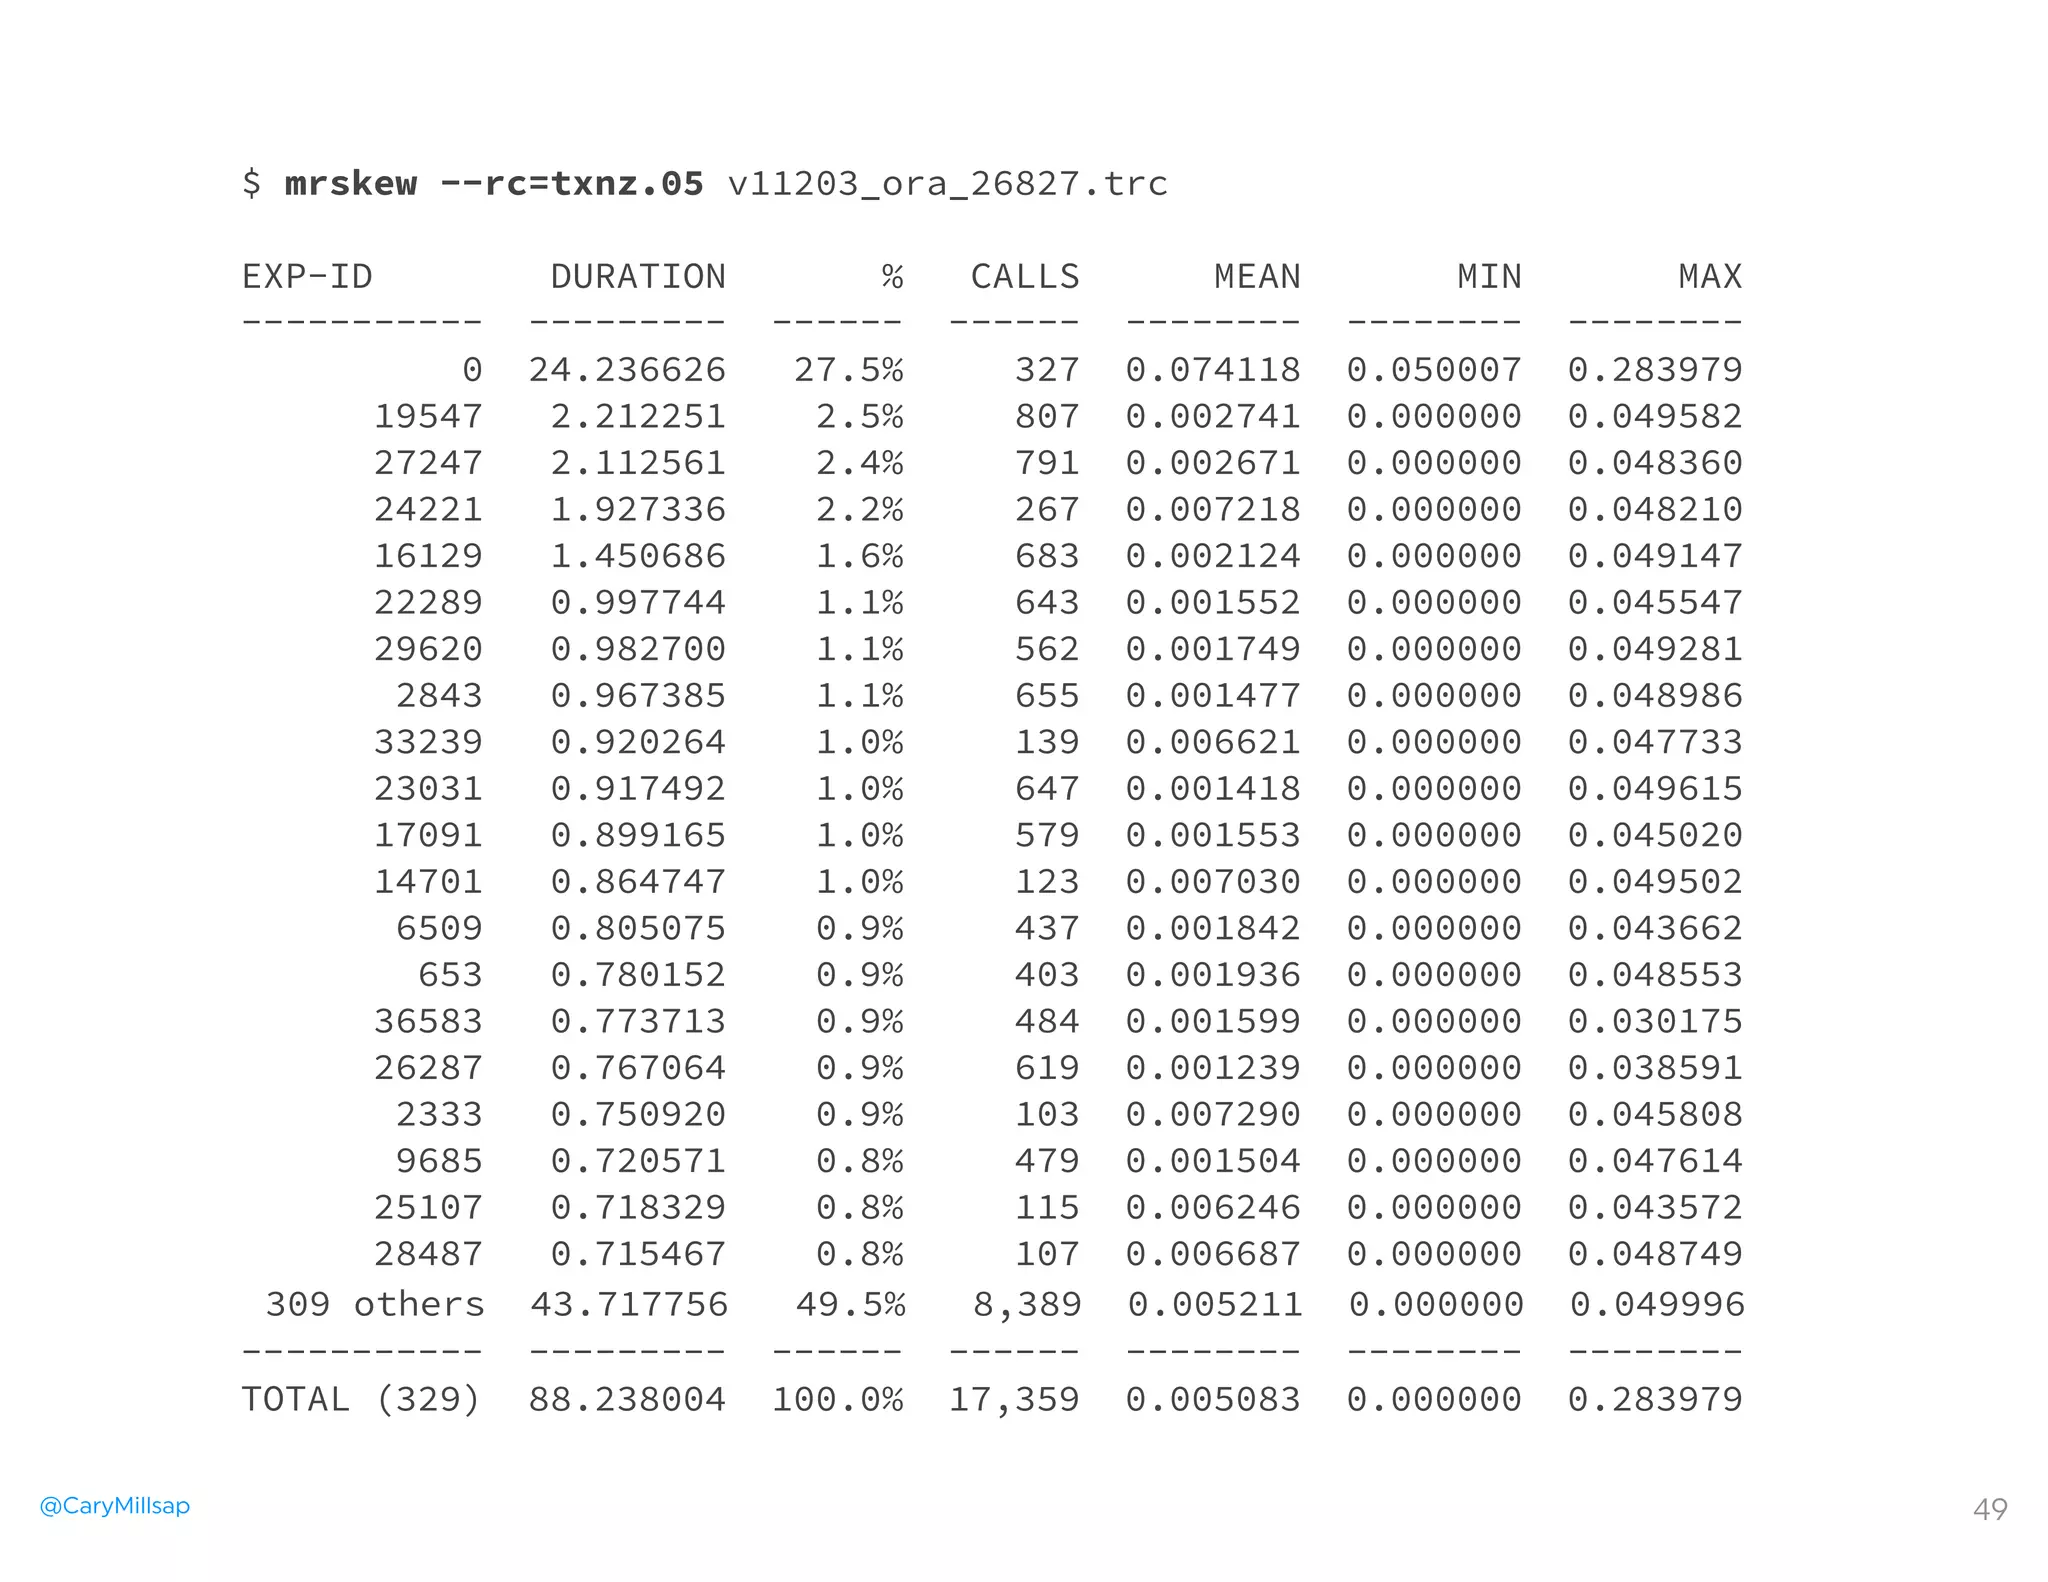


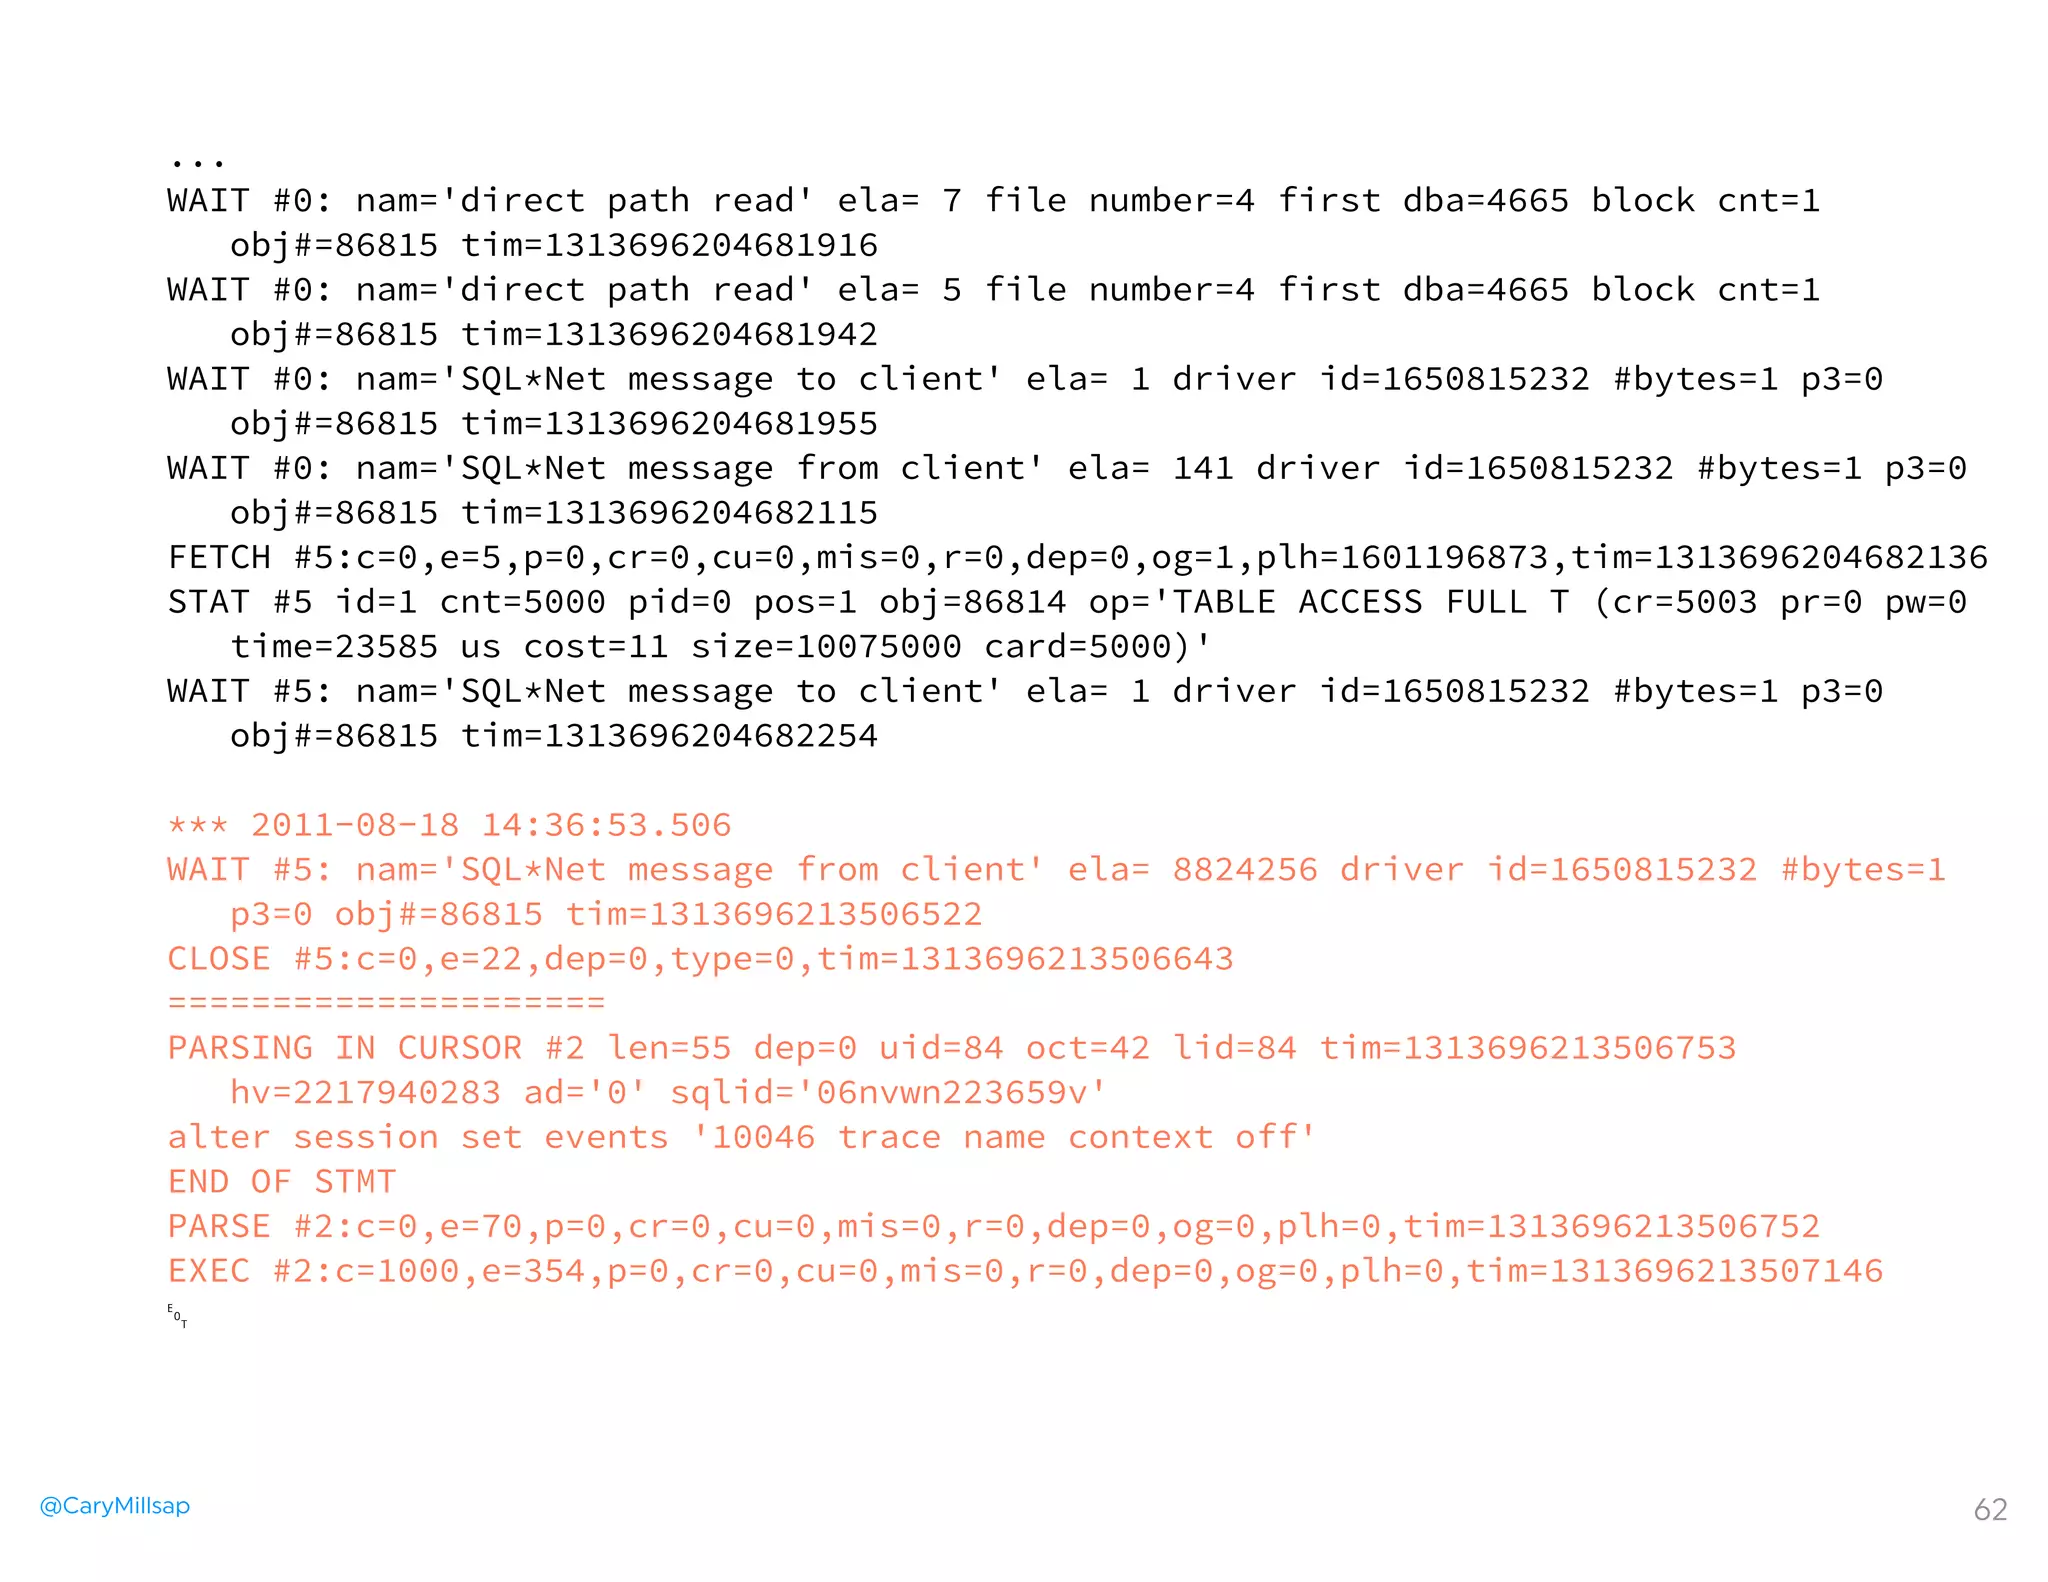
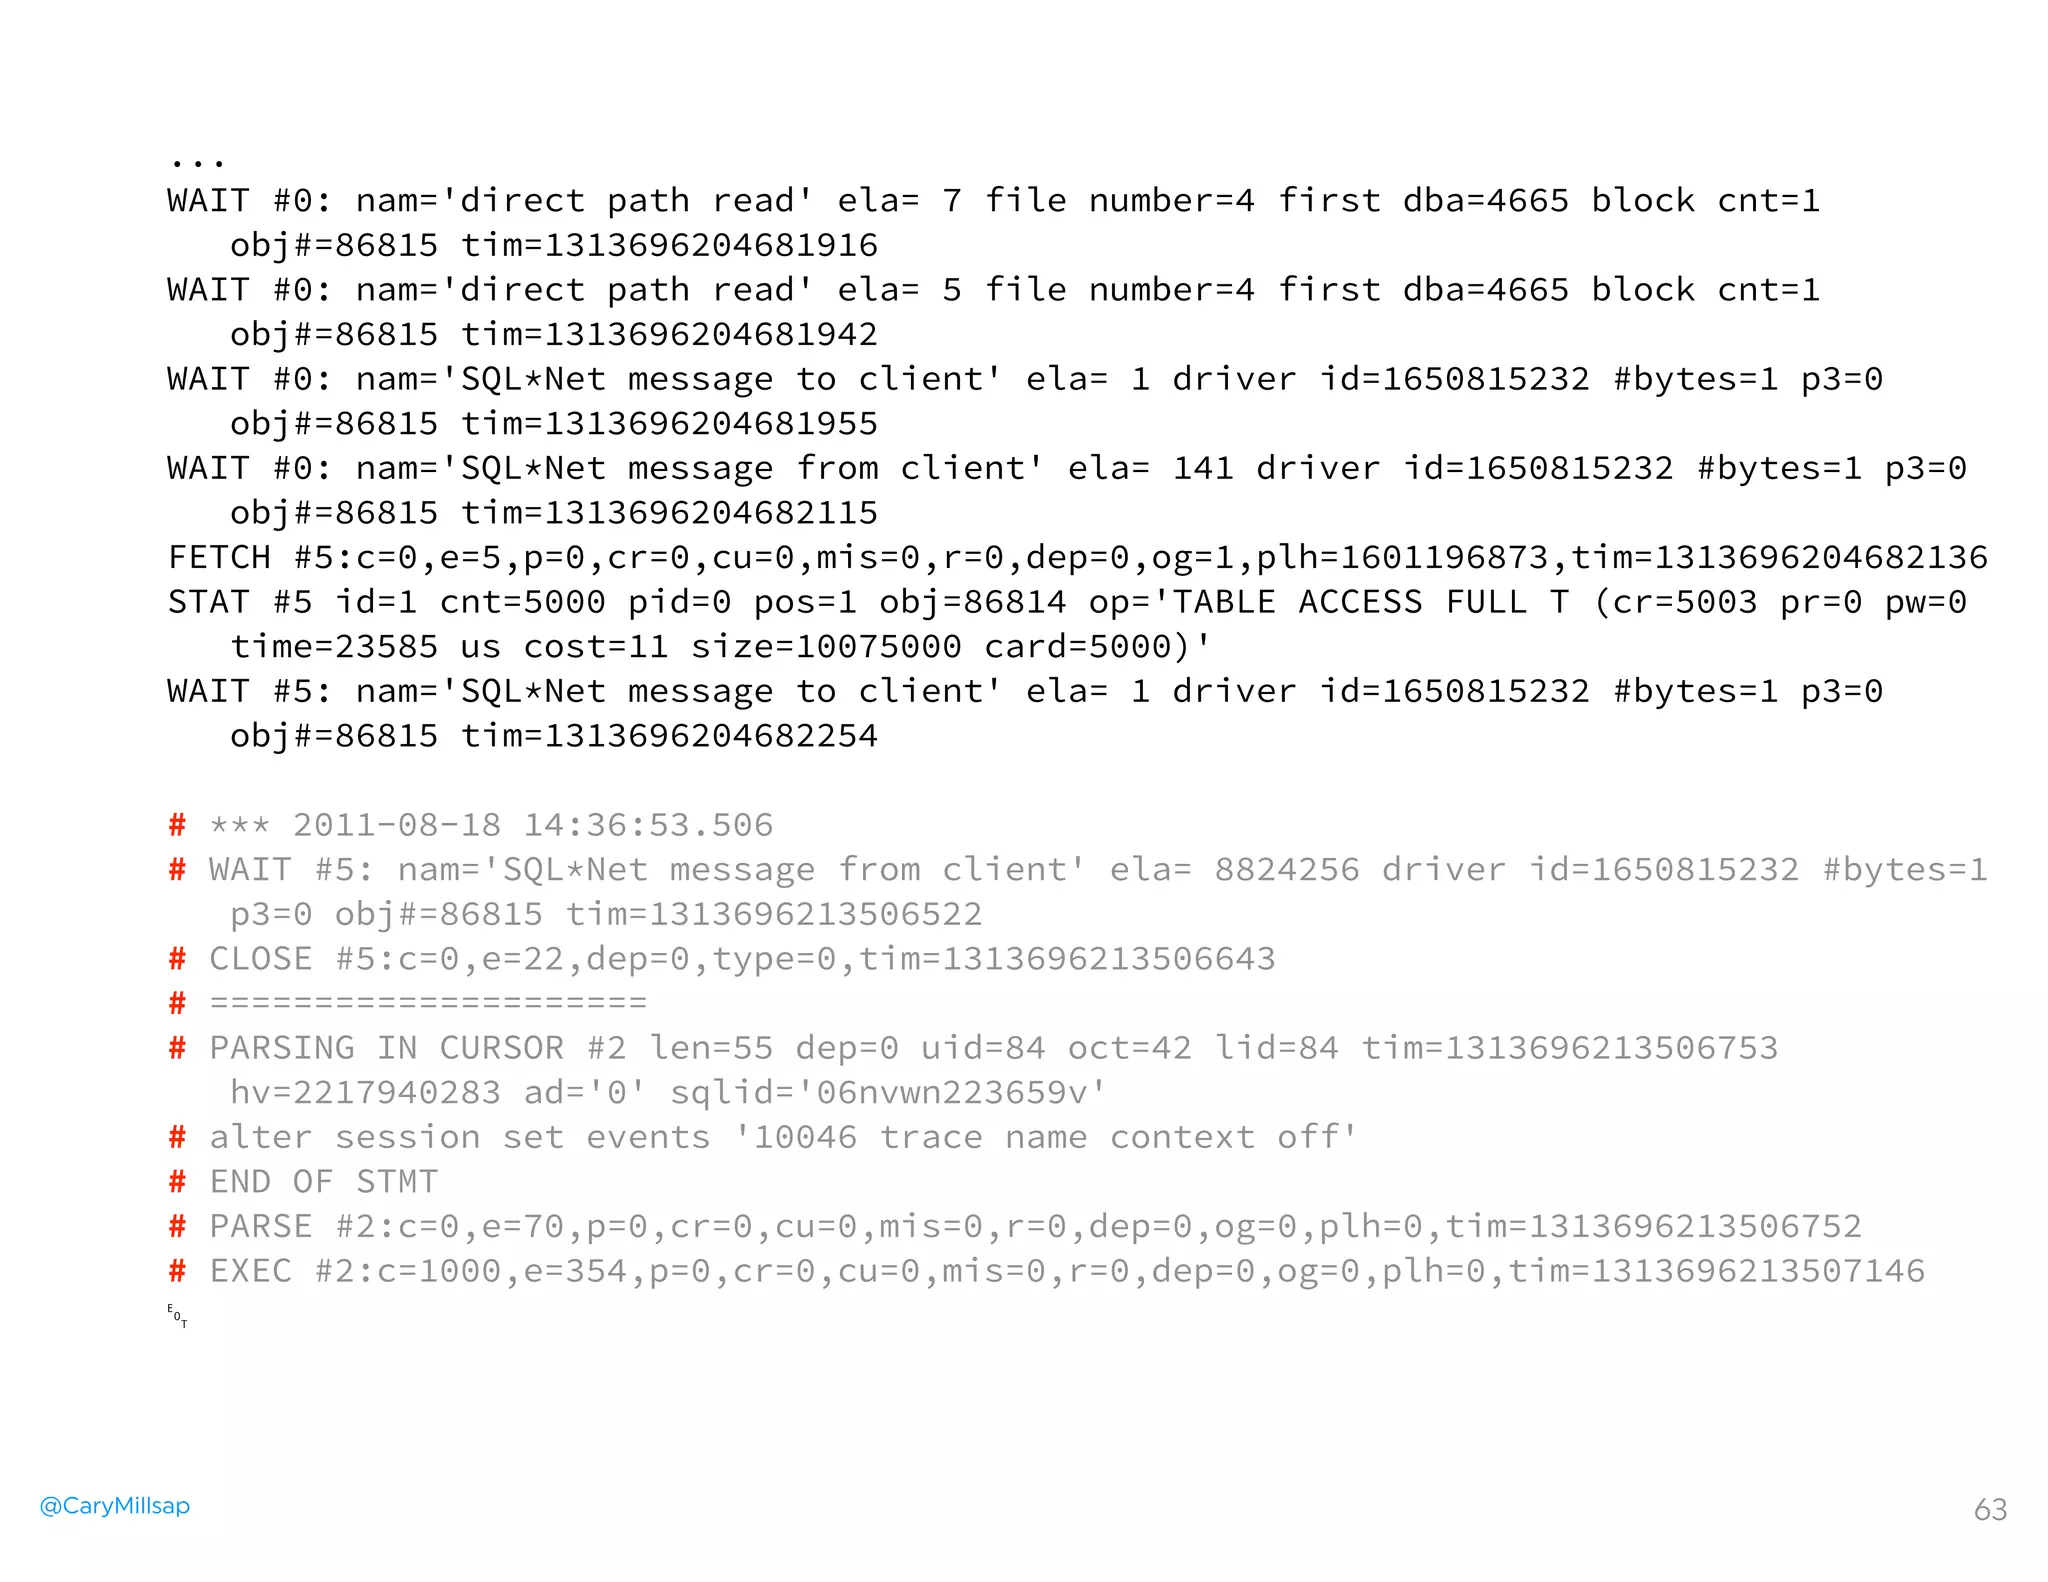

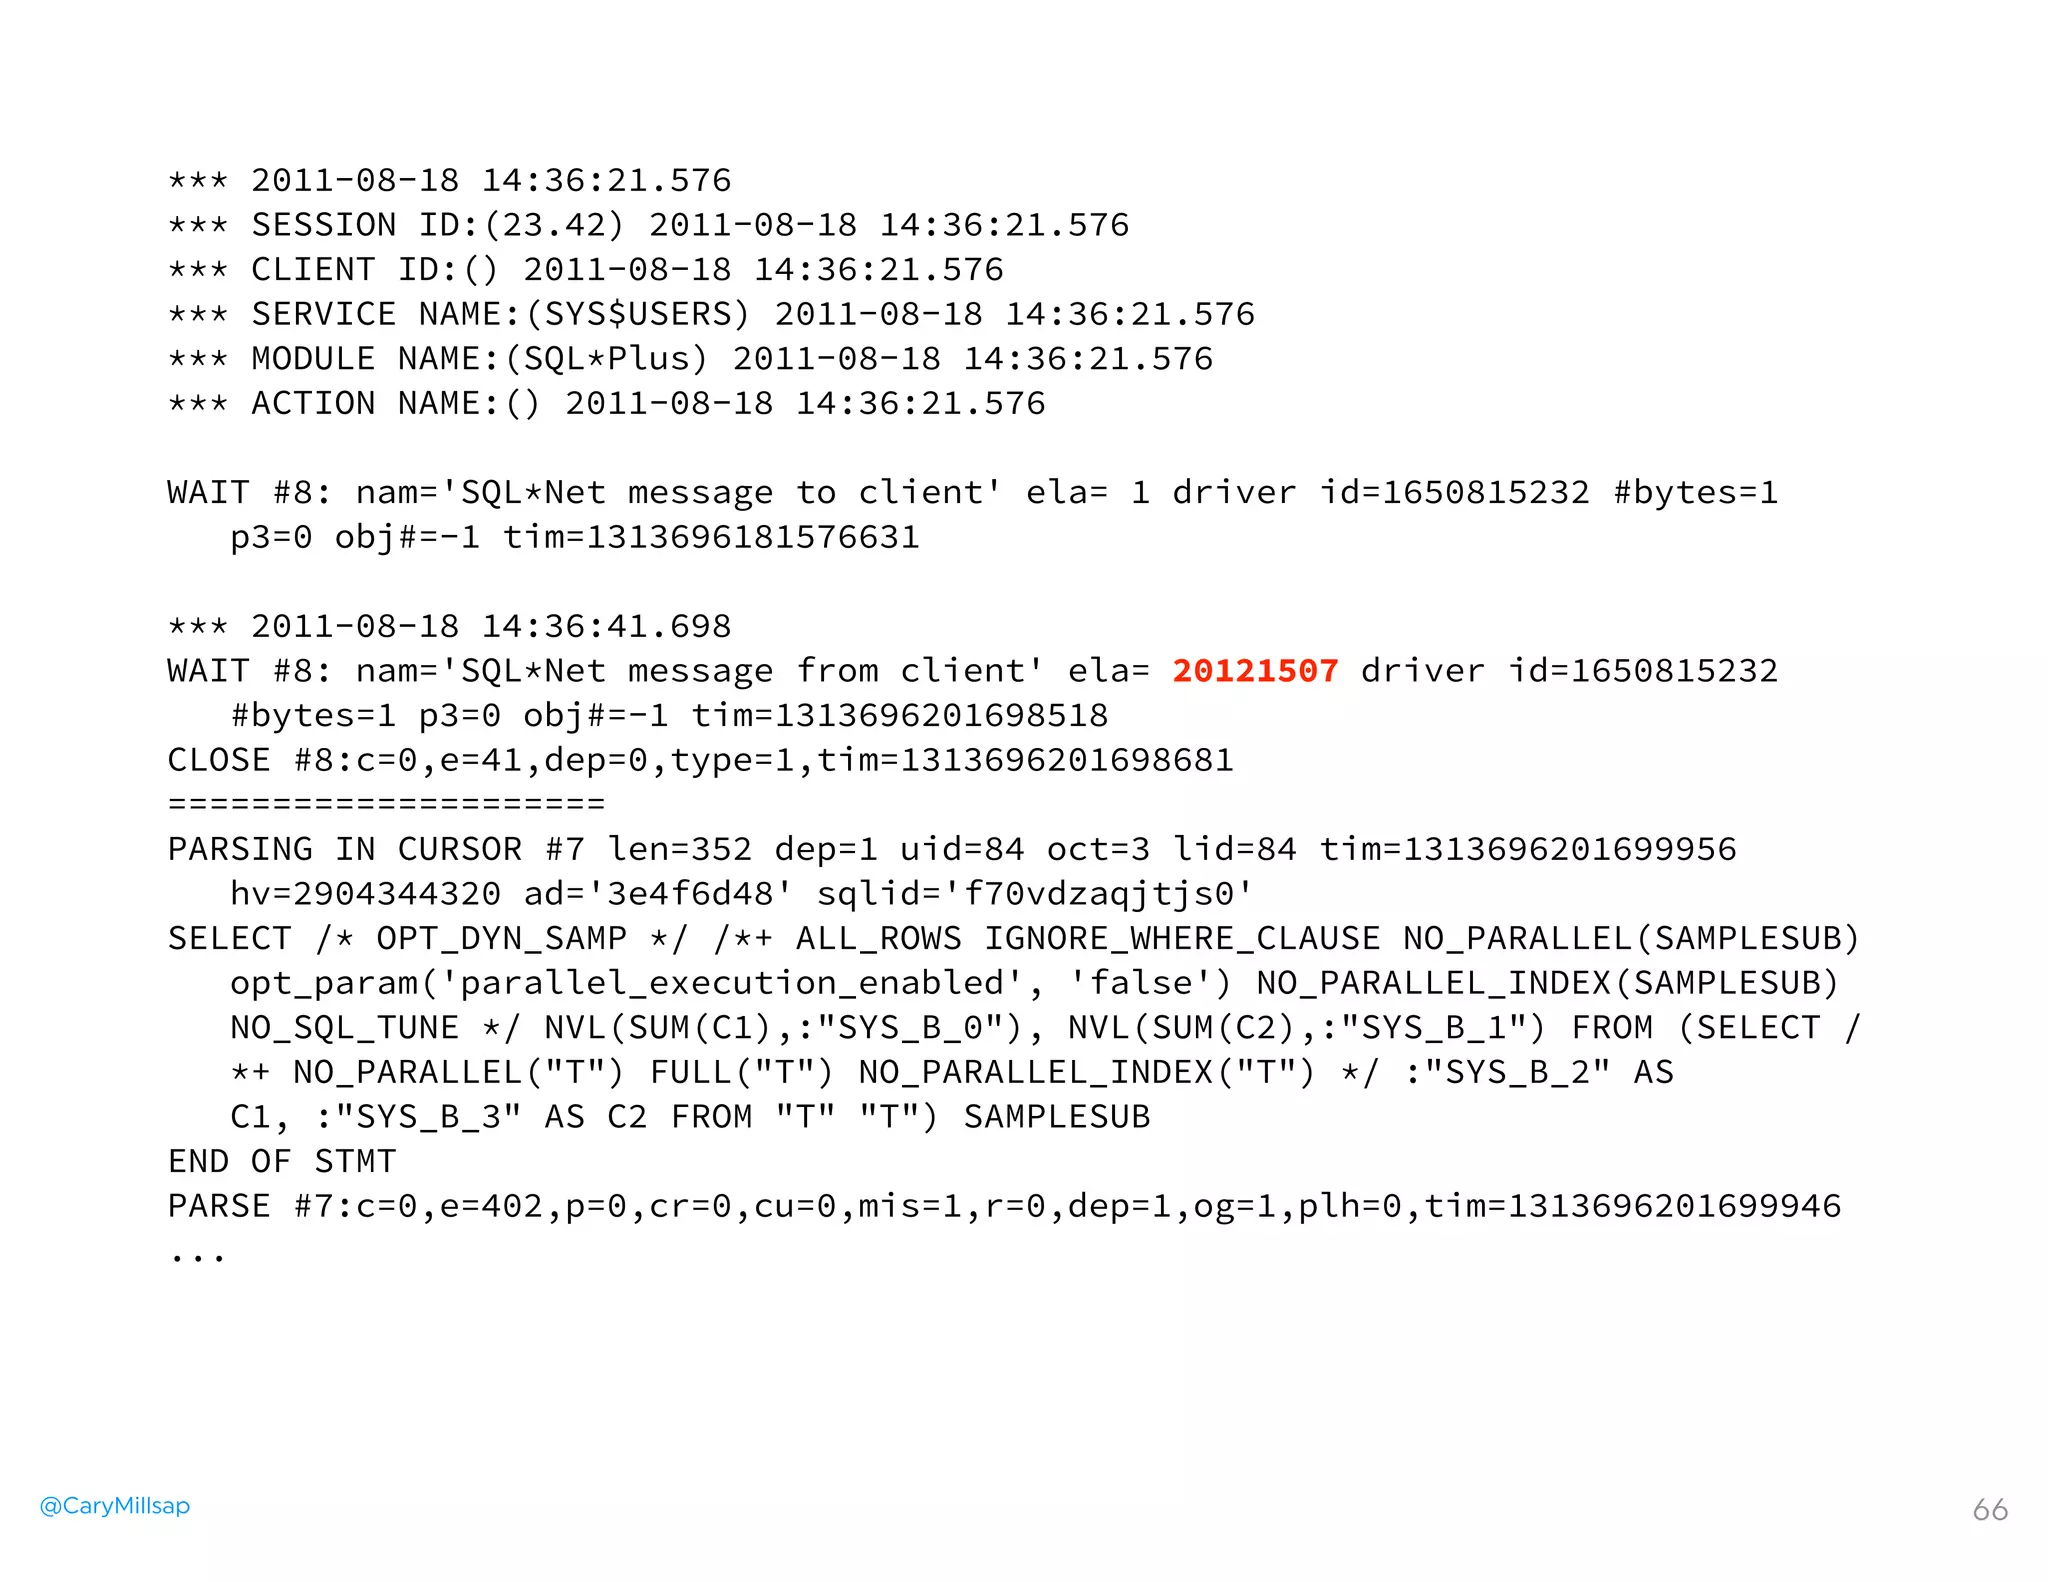
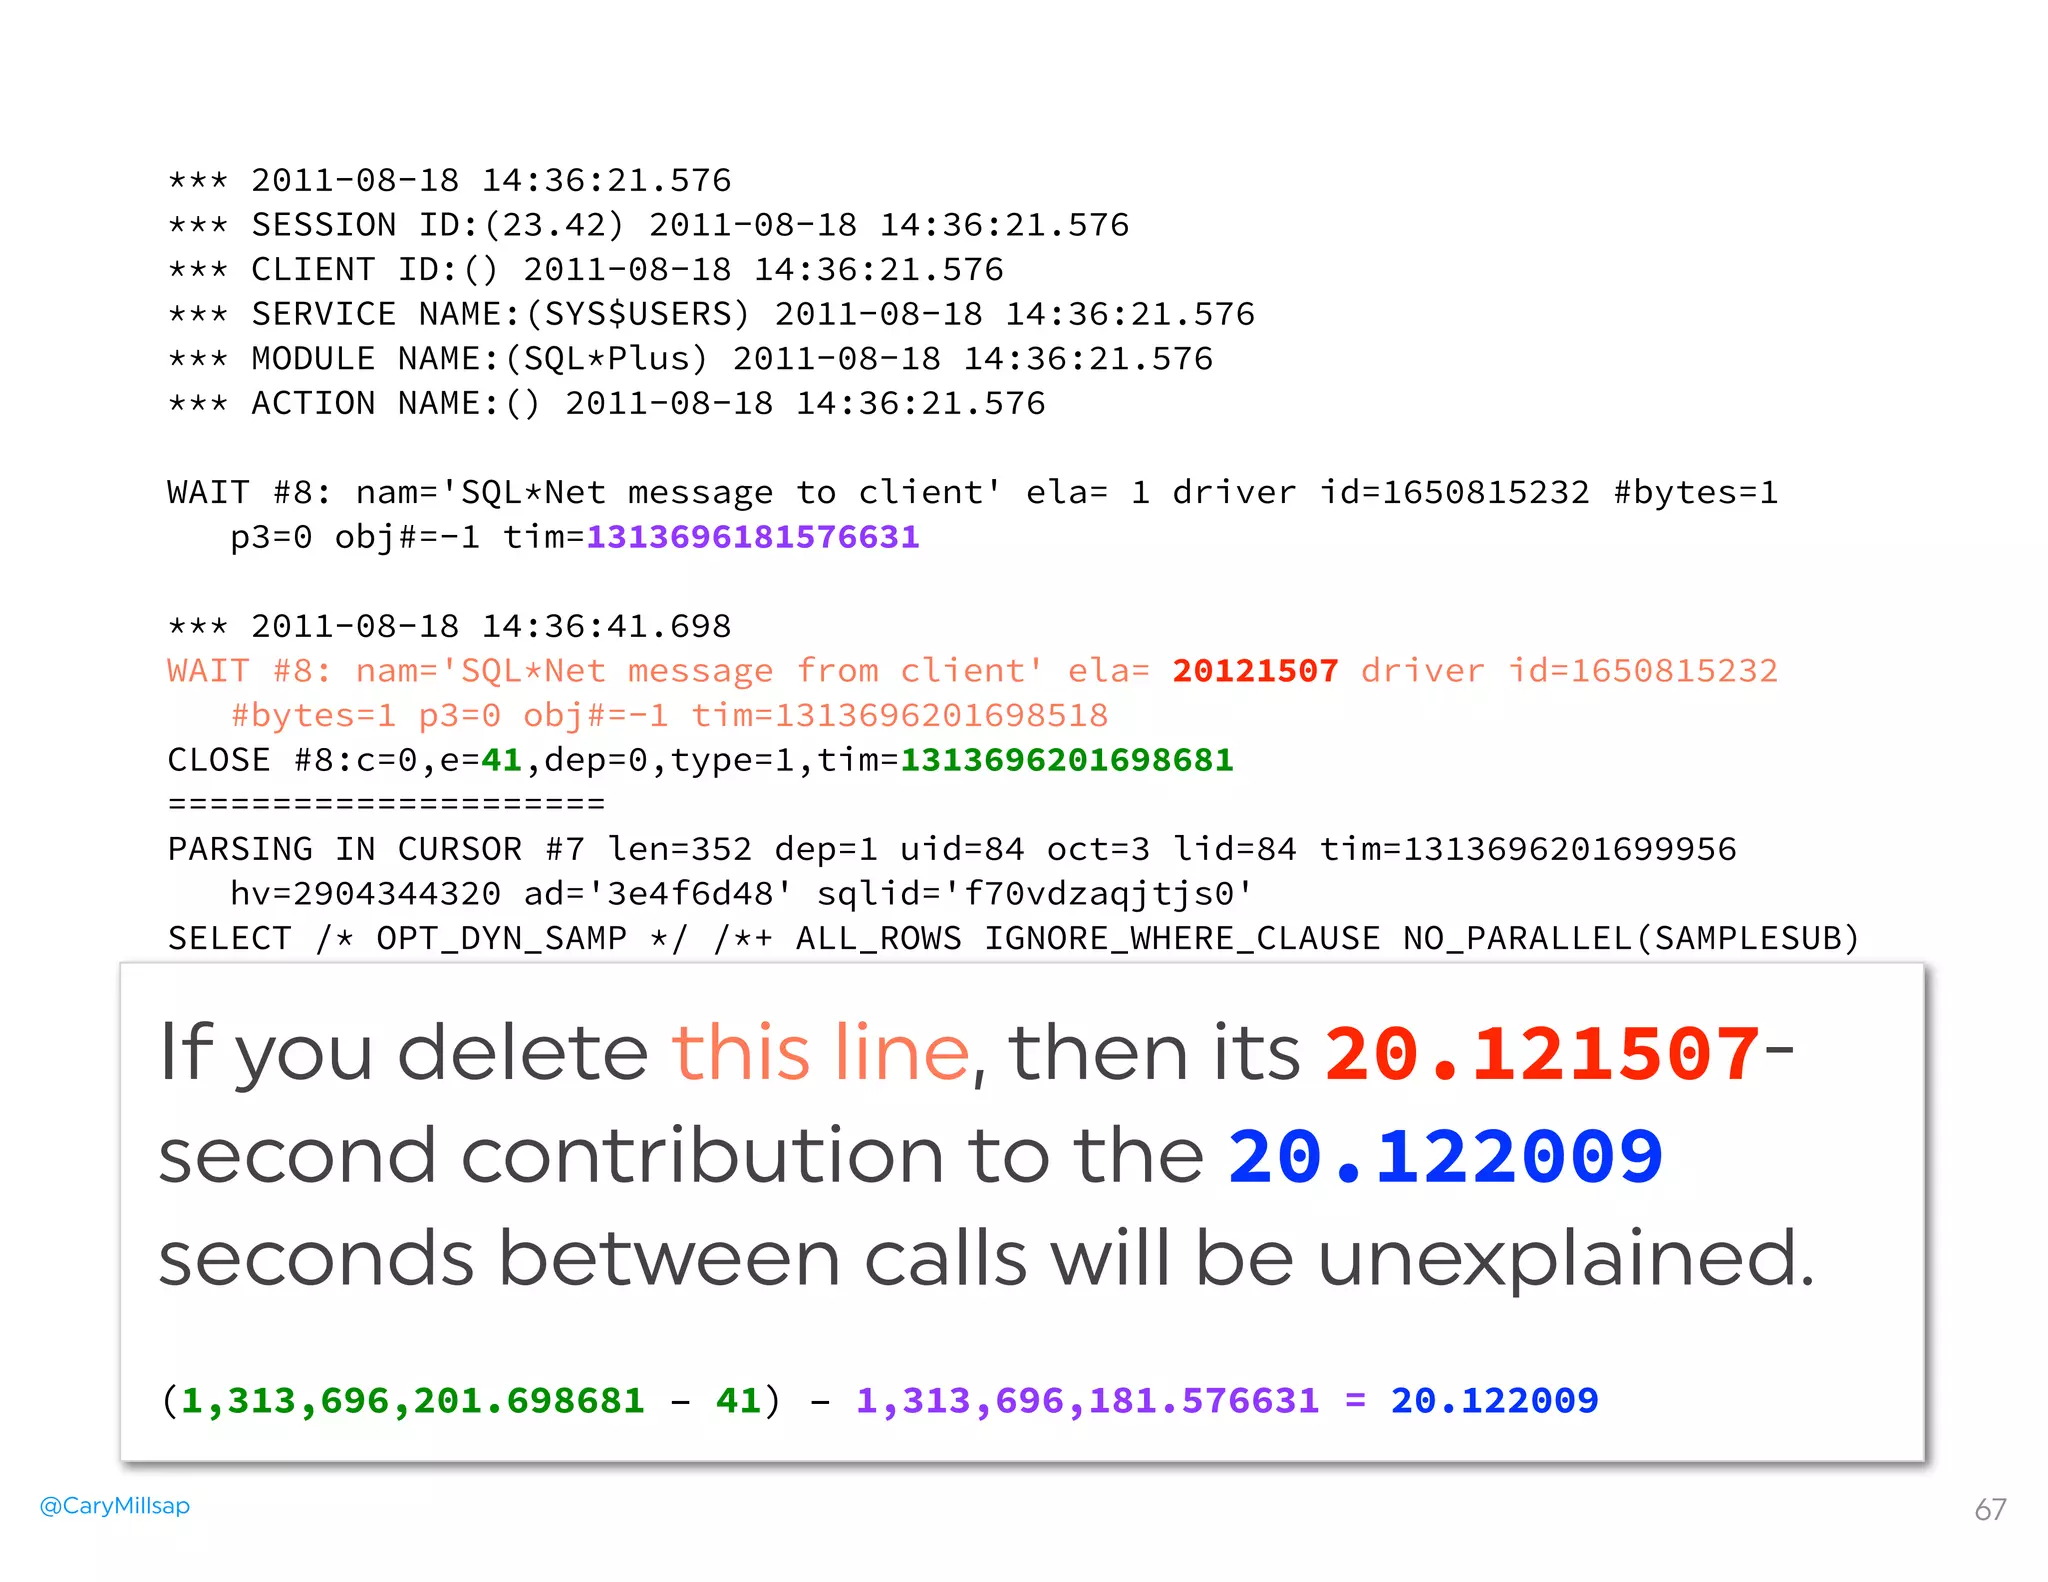
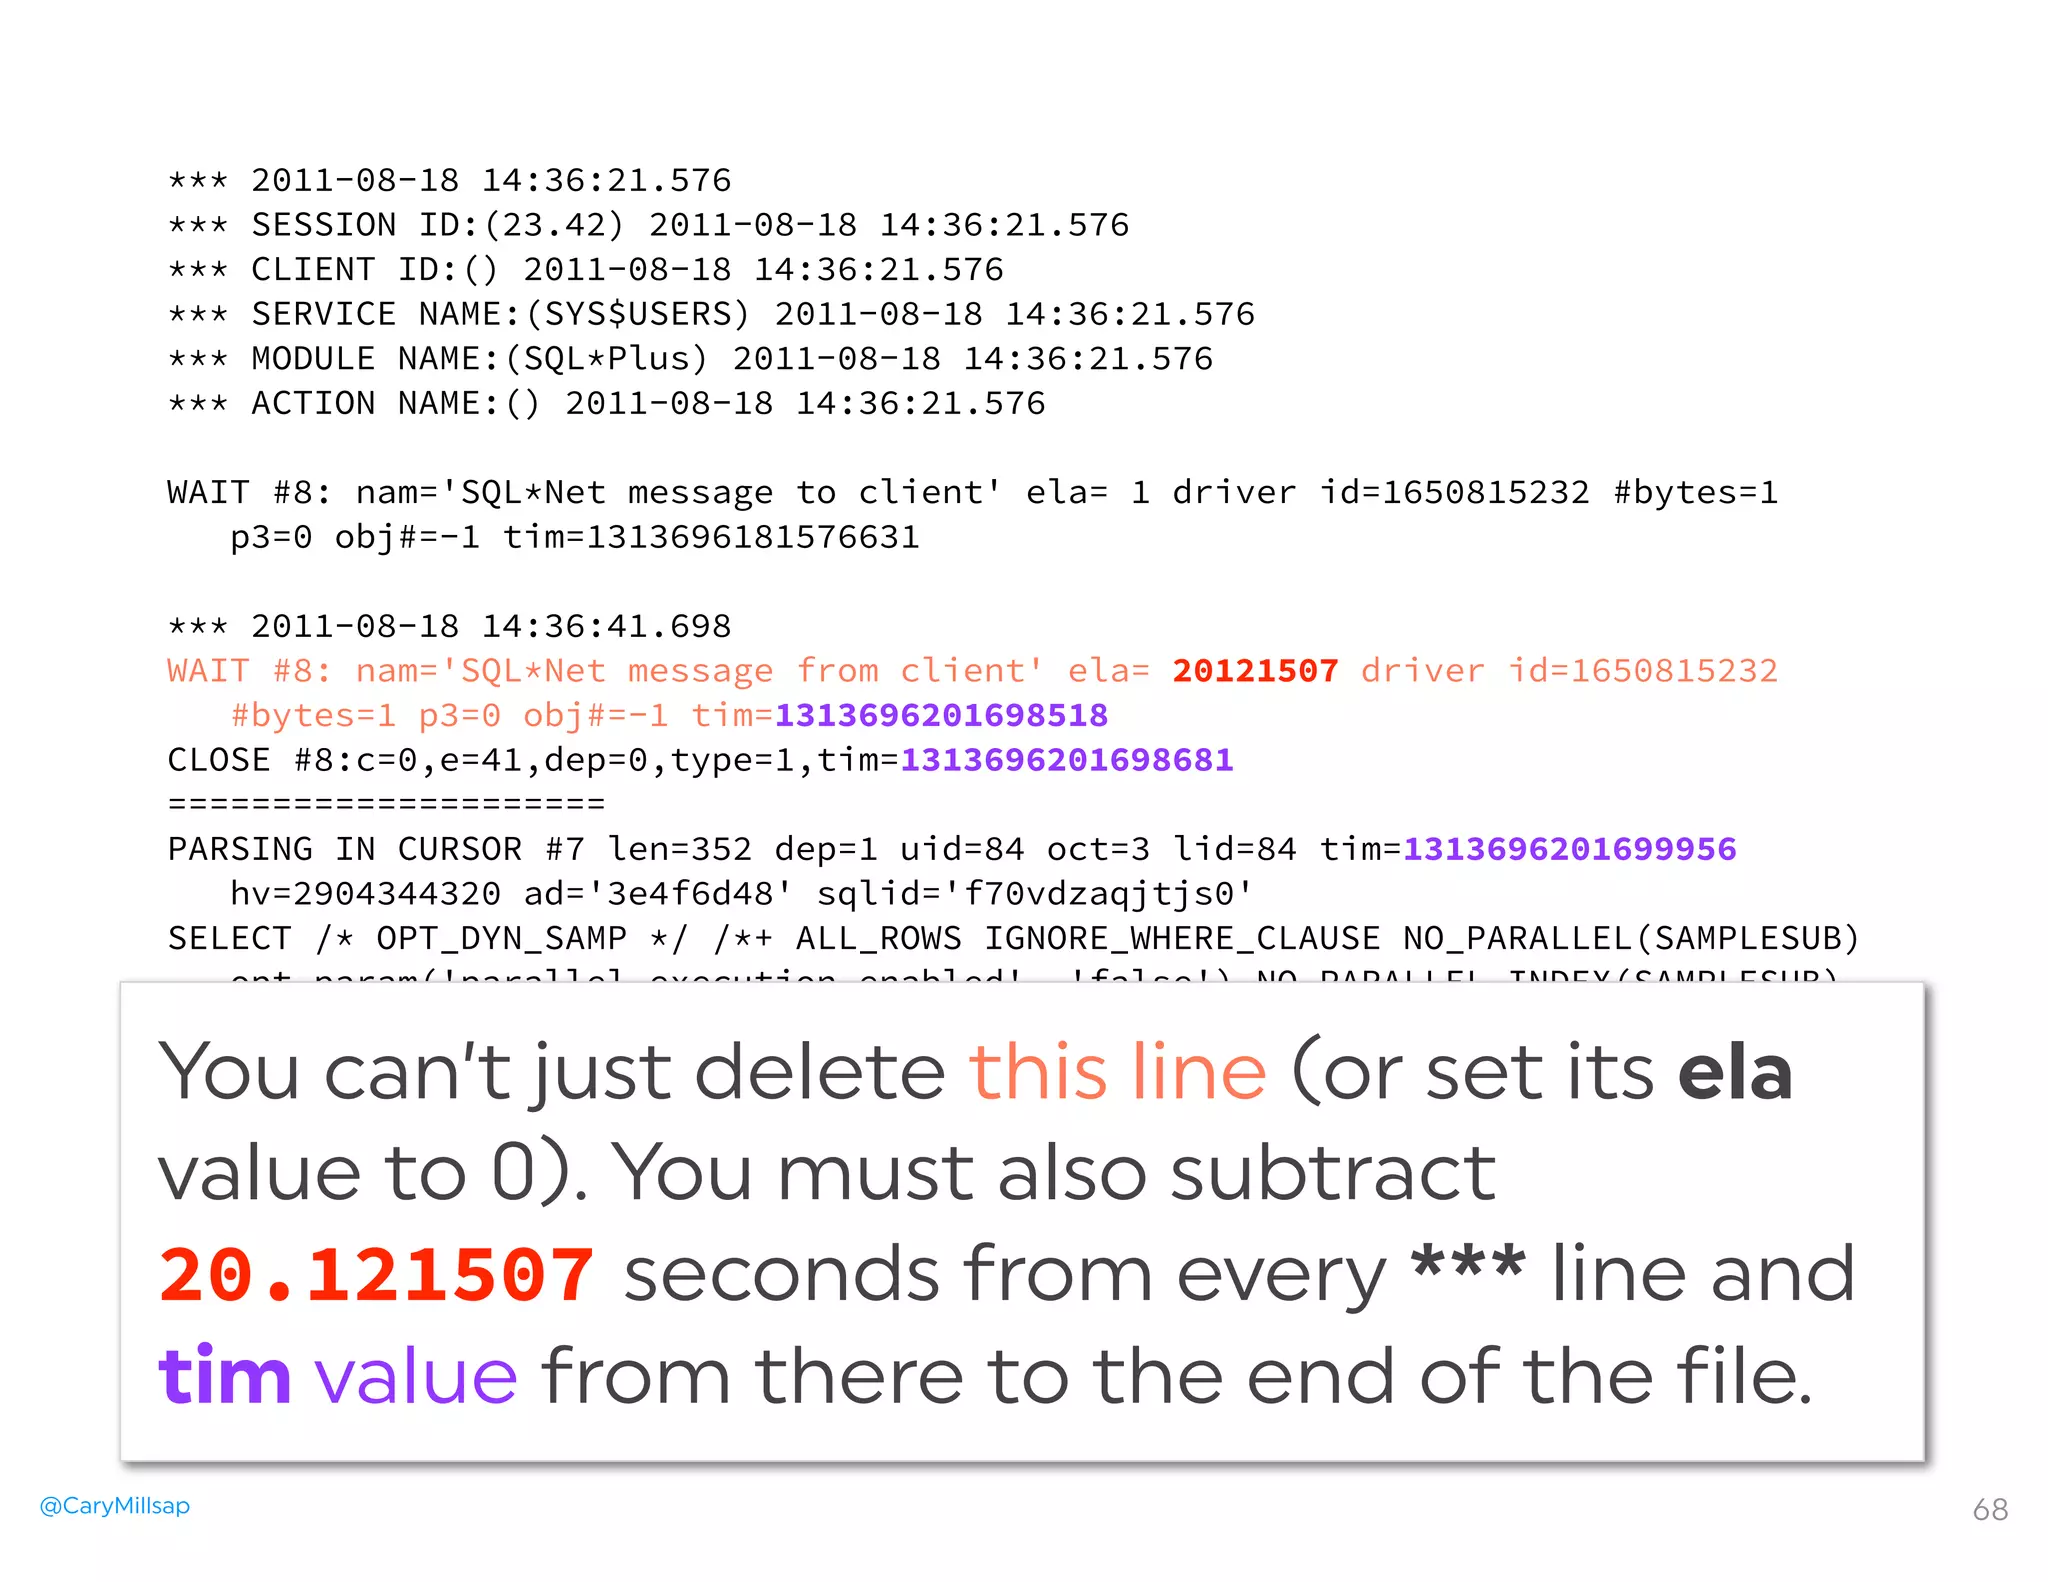

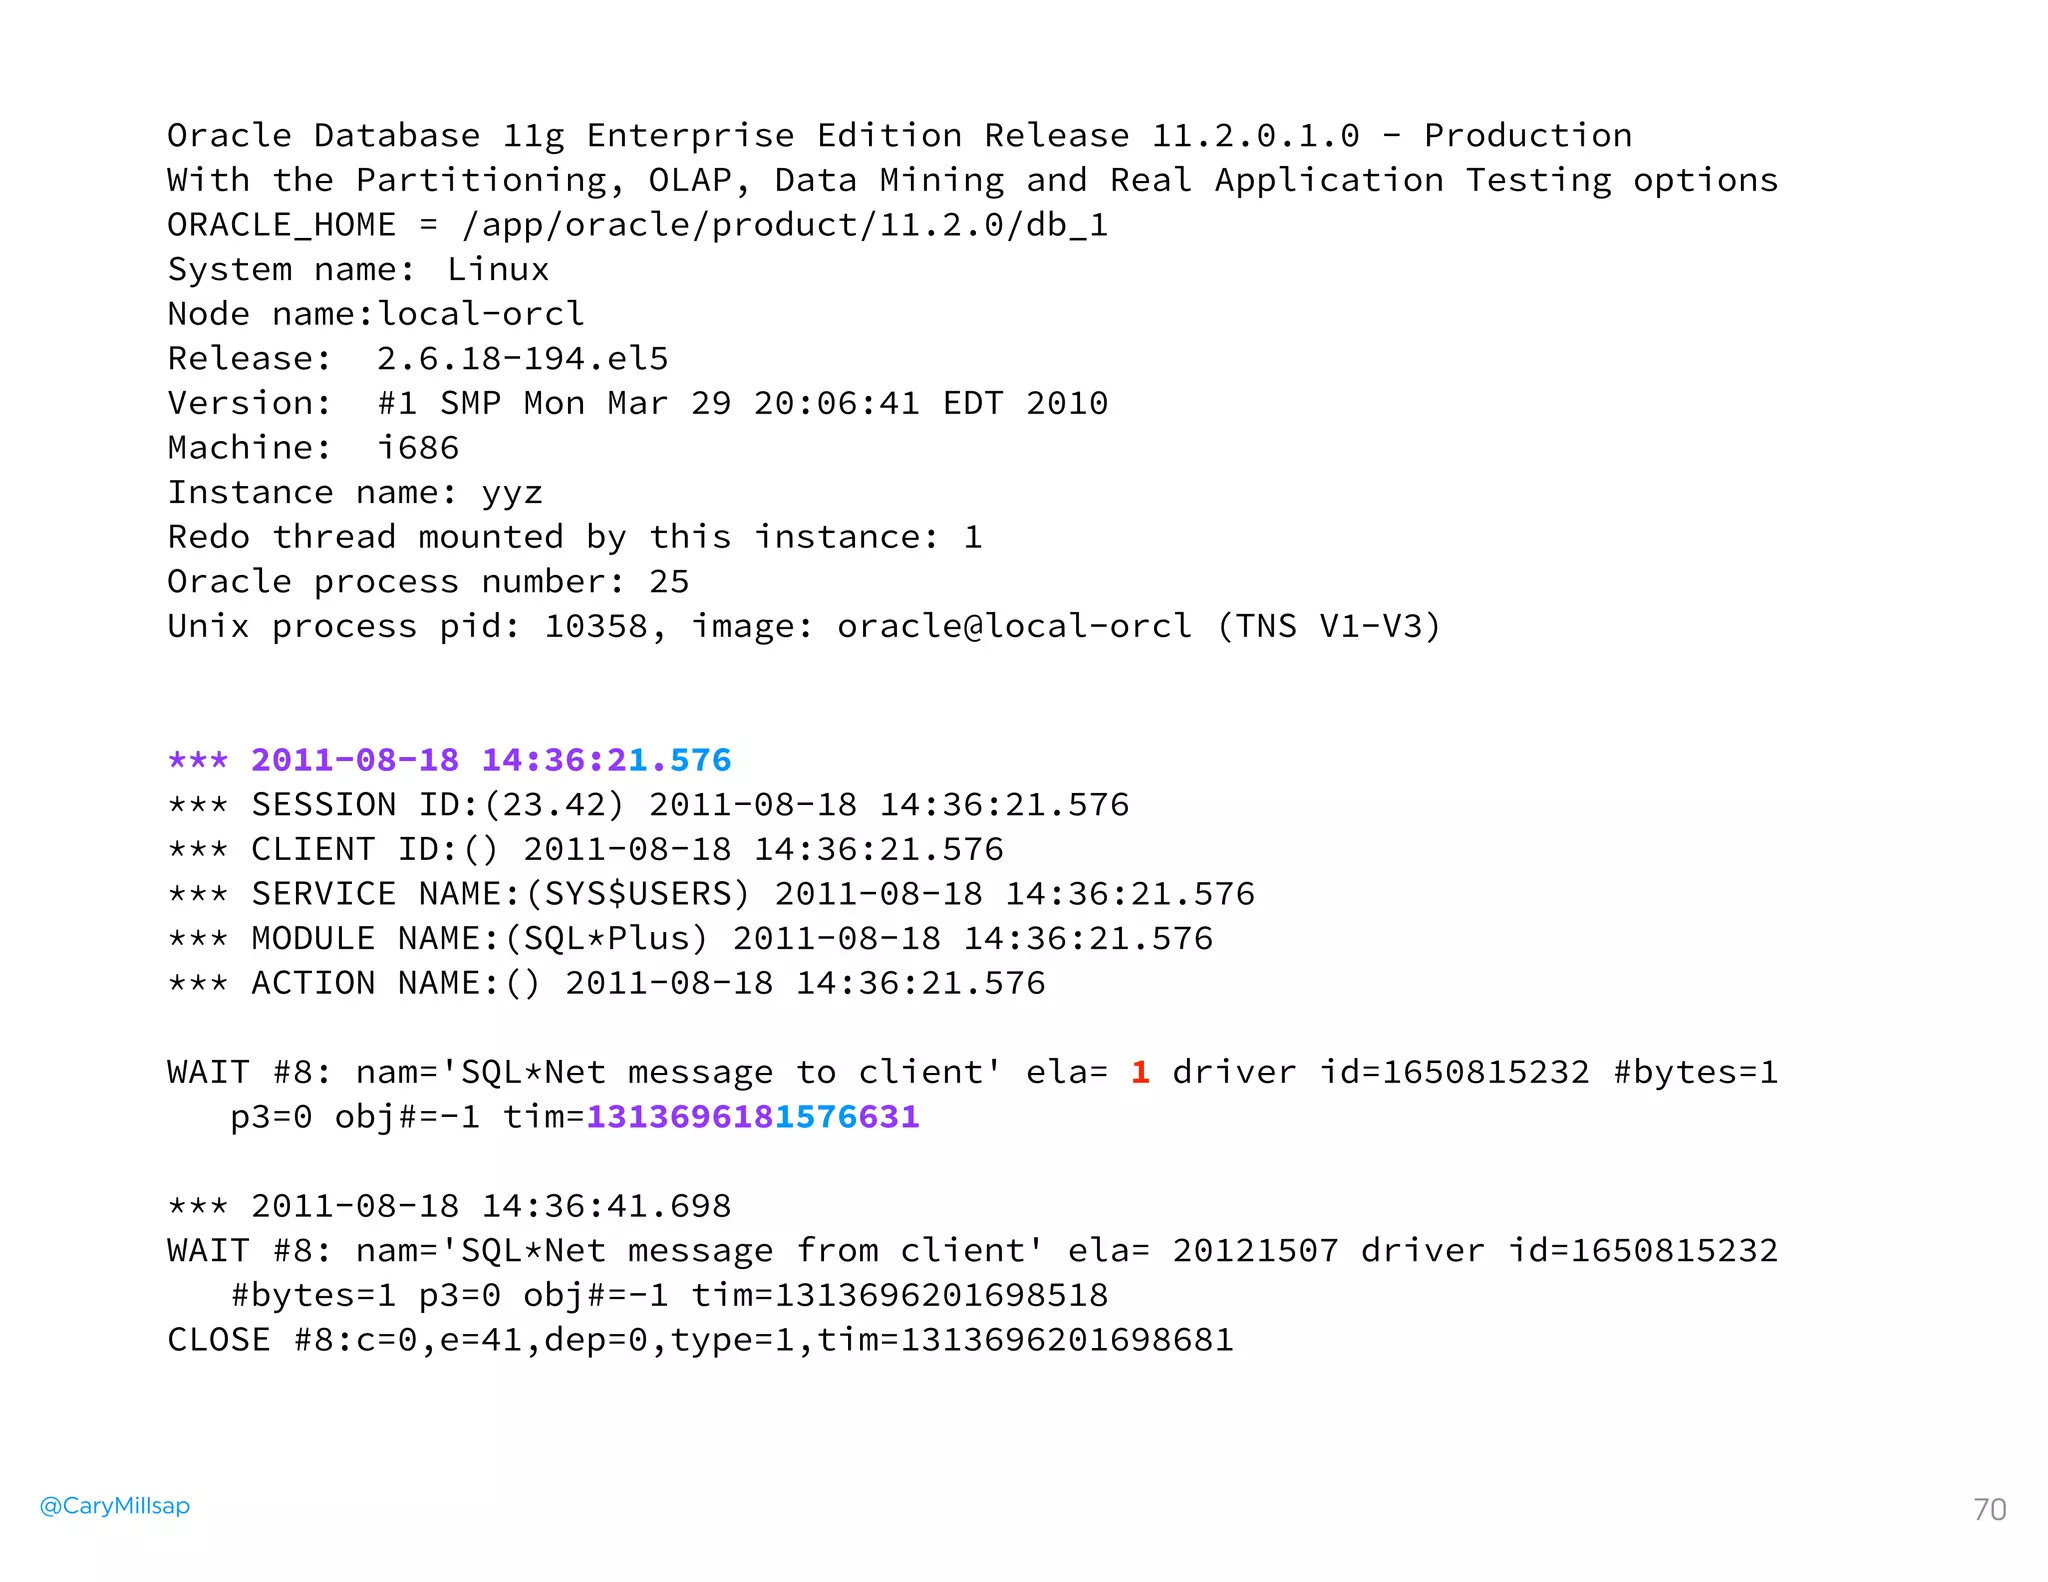


The document discusses performance analysis in Oracle systems, emphasizing the significance of understanding response times and their components through sequence diagrams and profiling. It highlights common mistakes in data collection, particularly regarding the SQL trace data, and provides examples of analyzing experiences to identify performance issues. The content is directed at enhancing performance diagnostics and avoiding pitfalls in analysis.