Calculating SQL Runtime Using Raw ASH Data
Yuan Yao
Who Am I
Yuan Yao
• Performance maven in Oracle & MySQL
• Oracle ACE
• Huawei Cloud’s Most Valuable Professional
• Former database manager@IBM
• Holder of more than 20 Oracle certificates
• Inventor of two computer patents
• Author of MySQL 8.0 Operations and Optimization (ISBN: 9787302602682)
Agenda
• How to address random outlier SQLs
• Calculating SQL runtime using raw ASH data
• Use cases
• find outlier SQLs in a time window
• find outlier executions of a specific SQL
www.byte-way.com https://x.com/YuanOracle
How to address random outlier SQLs
Random slow response incident
User: The application suddenly took a long
time to process a request!
DBA: Can you provide details?
User: It was random.
DBA: Has this happened before?
User: No, it seemed like a one-time issue.
DBA: How long does this request usually take?
User: A few seconds.
DBA: When did this slow request occur?
User: About two hours ago.
DBA: Any more specific time?
User: No, I'm not sure.
www.byte-way.com https://x.com/YuanOracle
Limitations of AWR in identifying random outlier SQLs
• Averages can mask performance spikes and outliers.
• Snapshot intervals (e.g., hourly) may miss transient anomalies.
• Lack of granularity.
• Overhead of frequent snapshots.
• Storage and performance impact of detailed logging.
www.byte-way.com https://x.com/YuanOracle
What we need
A method that can calculate the runtime of every single execution of
SQL with little overhead.
www.byte-way.com https://x.com/YuanOracle
Calculating SQL runtime using raw ASH data
A new approach to identifying culprit SQL statements
Sources of ASH data
V$ACTIVE_SESSION_HISTORY
• Use: Recent/active analysis
• Frequency: Every second
• Storage: In-memory
• Advantage: High precision, captures short-lived
SQL
• Limitation: Limited data retention.
www.byte-way.com https://x.com/YuanOracle
DBA_HIST_ACTIVE_SESS_HISTORY
• Use: Long-term analysis
• Frequency: Every 10 seconds
• Storage: Disk-based
• Advantage: Longer retention
• Limitation: May miss short SQL, less precise
The Active Session History (ASH) is a diagnostic tool in Oracle databases that takes
samples of all the active sessions and stores the sampled data in two tables.
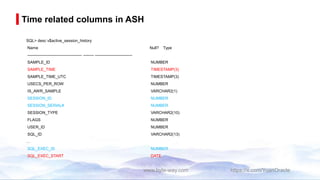
Time related columns in ASH
SQL> desc v$active_session_history
Name Null? Type
----------------------------------------- -------- ----------------------------
SAMPLE_ID NUMBER
SAMPLE_TIME TIMESTAMP(3)
SAMPLE_TIME_UTC TIMESTAMP(3)
USECS_PER_ROW NUMBER
IS_AWR_SAMPLE VARCHAR2(1)
SESSION_ID NUMBER
SESSION_SERIAL# NUMBER
SESSION_TYPE VARCHAR2(10)
FLAGS NUMBER
USER_ID NUMBER
SQL_ID VARCHAR2(13)
…
SQL_EXEC_ID NUMBER
SQL_EXEC_START DATE
www.byte-way.com https://x.com/YuanOracle
Formula
SQL Runtime = Maximum Sample Time - SQL Start Time
= max(sample_time)-sql_exec_start
www.byte-way.com https://x.com/YuanOracle
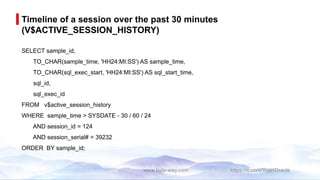
Timeline of a session over the past 30 minutes
(V$ACTIVE_SESSION_HISTORY)
SELECT sample_id,
TO_CHAR(sample_time, 'HH24:MI:SS') AS sample_time,
TO_CHAR(sql_exec_start, 'HH24:MI:SS') AS sql_start_time,
sql_id,
sql_exec_id
FROM v$active_session_history
WHERE sample_time > SYSDATE - 30 / 60 / 24
AND session_id = 124
AND session_serial# = 39232
ORDER BY sample_id;
www.byte-way.com https://x.com/YuanOracle
Output and analysis
SAMPLE_ID SAMPLE_T SQL_STAR SQL_ID SQL_EXEC_ID
---------- -------- -------- ------------- -----------
8937592 16:53:48 16:53:47 3wpnrxd1xpncv 16777216
8937593 16:53:49 16:53:47 3wpnrxd1xpncv 16777216
…
8937626 16:54:23 16:53:47 3wpnrxd1xpncv 16777216
8937627 16:54:24 16:53:47 3wpnrxd1xpncv 16777216
8937628 16:54:25 16:54:24 azrtjtkq79qa6 16777216
8937629 16:54:26 16:54:24 azrtjtkq79qa6 16777216
8937630 16:54:27 16:54:24 azrtjtkq79qa6 16777216
8937631 16:54:28 16:54:24 azrtjtkq79qa6 16777216
8937632 16:54:29 16:54:24 azrtjtkq79qa6 16777216
8937633 16:54:30 16:54:29 dkhax46cjukju 16777216
8937634 16:54:31 16:54:29 dkhax46cjukju 16777216
…
www.byte-way.com https://x.com/YuanOracle
• For the SQL ID `3wpnrxd1xpncv`, the start
time is `16:53:47` , the last sample time
is `16:54:24`, the deduced runtime is 37
seconds.
• For the SQL ID `azrtjtkq79qa6`, the start time
is `16:54:24,` the last sample time
is `16:54:29`, the runtime is 5 seconds.
Output of query DBA_HIST_ACTIVE_SESS_HISTORY
SAMPLE_ID SAMPLE_T SQL_STAR SQL_ID SQL_EXEC_ID
---------- -------- -------- ------------- -----------
8937596 16:53:52 16:53:47 3wpnrxd1xpncv 16777216
8937606 16:54:02 16:53:47 3wpnrxd1xpncv 16777216
8937616 16:54:12 16:53:47 3wpnrxd1xpncv 16777216
8937626 16:54:23 16:53:47 3wpnrxd1xpncv 16777216
8937636 16:54:33 16:54:29 dkhax46cjukju 16777216
8937646 16:54:43 16:54:29 dkhax46cjukju 16777216
...
www.byte-way.com https://x.com/YuanOracle
• For the SQL ID `3wpnrxd1xpncv`, the start
time is `16:53:47` , the maximum sample time
is `16:54:23`, the deduced runtime is 36
seconds.
• For the SQL ID `azrtjtkq79qa6`, this ID is not
present in the new output, indicating this
SQL execution has not been captured due to
the wider sampling interval.
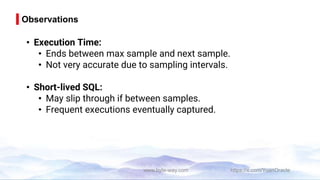
Observations
• Execution Time:
• Ends between max sample and next sample.
• Not very accurate due to sampling intervals.
• Short-lived SQL:
• May slip through if between samples.
• Frequent executions eventually captured.
www.byte-way.com https://x.com/YuanOracle
Use cases
find outlier SQLs in a time window
find outlier executions of a specific SQL
www.byte-way.com https://x.com/YuanOracle
Oracle stopped responding about two hours ago
-- This query captures 9 longest SQL executions within a one-hour window before and after two hours ago
select *
from (
select sql_id,
round((EXTRACT(DAY FROM (max(sample_time) - max(sql_exec_start))) * 86400) +
(EXTRACT(HOUR FROM (max(sample_time) - max(sql_exec_start))) * 3600) +
(EXTRACT(MINUTE FROM (max(sample_time) - max(sql_exec_start))) * 60) +
(EXTRACT(SECOND FROM (max(sample_time) - max(sql_exec_start)))), 2) as run_seconds,
to_char(max(sql_exec_start), 'YYYY-Mon-DD HH24:MI:SS') as exec_start,
to_char(max(sample_time), 'YYYY-Mon-DD HH24:MI:SS') as end_time,
sql_exec_id
from dba_hist_active_sess_history
where sql_exec_start between sysdate - interval '3' hour - interval '30' minute
and sysdate - interval '1' hour + interval '30' minute
and sql_exec_id > 0
group by sql_id, sql_exec_id
order by run_seconds desc
)
where rownum < 10;
www.byte-way.com https://x.com/YuanOracle
An example of output
SQL_ID RUN_SECONDS EXEC_START END_TIME SQL_EXEC_ID
7nz11m353mj22 93.25 2024-Jul-10 13:03:53 2024-Jul-10 13:05:26 16777217
c1nxkb8m44cpz 33.61 2024-Jul-10 13:03:00 2024-Jul-10 13:03:33 16777217
as2dr3ag24gay 11.37 2024-Jul-10 13:03:12 2024-Jul-10 13:03:23 16777224
cx67k8h01fp7y 8.73 2024-Jul-10 13:05:38 2024-Jul-10 13:05:46 16777217
cguxmj11h9gjx 8.09 2024-Jul-10 13:03:46 2024-Jul-10 13:03:54 16777217
b6usrg82hwsa3 8.05 2024-Jul-10 13:12:59 2024-Jul-10 13:13:07 16777228
ajfdc0t0jh5z5 4.49 2024-Jul-10 13:05:32 2024-Jul-10 13:05:36 16777216
as2dr3ag24gay 3.45 2024-Jul-10 13:06:14 2024-Jul-10 13:06:17 16777225
6t9uu481ygn89 2.85 2024-Jul-10 13:03:41 2024-Jul-10 13:03:43 16777217
The SQL statement with SQL_ID 7nz11m353mj22 and an execution time of 93.25 seconds is the most
likely culprit for the slow response reported by the user.
www.byte-way.com https://x.com/YuanOracle
Measuring a specific SQL statement
-- This query retrieves and calculates the execution time of a specific SQL statement on the current date
SELECT sql_id,
sql_exec_id,
ROUND((EXTRACT(DAY FROM (MAX(sample_time) - MIN(sql_exec_start))) * 86400) +
(EXTRACT(HOUR FROM (MAX(sample_time) - MIN(sql_exec_start))) * 3600) +
(EXTRACT(MINUTE FROM (MAX(sample_time) - MIN(sql_exec_start))) * 60) +
(EXTRACT(SECOND FROM (MAX(sample_time) - MIN(sql_exec_start)))), 2) AS run_seconds,
TO_CHAR(MIN(sql_exec_start), 'YYYY-Mon-DD HH24:MI:SS') AS exec_start,
TO_CHAR(MAX(sample_time), 'YYYY-Mon-DD HH24:MI:SS') AS end_time
FROM dba_hist_active_sess_history
WHERE sql_id = 'as2dr3ag24gay'
AND TRUNC(sample_time) = TRUNC(SYSDATE)
AND sql_exec_id > 0
GROUP BY sql_id, sql_exec_id
ORDER BY run_seconds DESC;
www.byte-way.com https://x.com/YuanOracle
An example of output
SQL_ID SQL_EXEC_ID RUN_SECONDS EXEC_START END_TIME
as2dr3ag24gay 16777224 45.12 2024-Jul-10 13:03:12 2024-Jul-10 13:03:57
as2dr3ag24gay 16777225 3.45 2024-Jul-10 13:06:14 2024-Jul-10 13:06:17
as2dr3ag24gay 16777226 3.67 2024-Jul-10 13:09:20 2024-Jul-10 13:09:24
as2dr3ag24gay 16777227 3.55 2024-Jul-10 13:12:31 2024-Jul-10 13:12:34
as2dr3ag24gay 16777228 3.60 2024-Jul-10 13:15:45 2024-Jul-10 13:15:48
as2dr3ag24gay 16777229 3.50 2024-Jul-10 13:18:50 2024-Jul-10 13:18:54
as2dr3ag24gay 16777230 3.48 2024-Jul-10 13:21:52 2024-Jul-10 13:21:55
as2dr3ag24gay 16777231 3.43 2024-Jul-10 13:24:58 2024-Jul-10 13:25:01
as2dr3ag24gay 16777232 3.46 2024-Jul-10 13:28:05 2024-Jul-10 13:28:08
as2dr3ag24gay 16777233 3.49 2024-Jul-10 13:31:10 2024-Jul-10 13:31:13
The execution of the SQL statement at “2024-Jul-10 13:03:12” is the outlier.
www.byte-way.com https://x.com/YuanOracle
Q & A

Calculating SQL Runtime Using Raw ASH Data.pdf

  • 1.
    Calculating SQL RuntimeUsing Raw ASH Data Yuan Yao
  • 2.
    Who Am I YuanYao • Performance maven in Oracle & MySQL • Oracle ACE • Huawei Cloud’s Most Valuable Professional • Former database manager@IBM • Holder of more than 20 Oracle certificates • Inventor of two computer patents • Author of MySQL 8.0 Operations and Optimization (ISBN: 9787302602682)
  • 3.
    Agenda • How toaddress random outlier SQLs • Calculating SQL runtime using raw ASH data • Use cases • find outlier SQLs in a time window • find outlier executions of a specific SQL www.byte-way.com https://x.com/YuanOracle
  • 4.
    How to addressrandom outlier SQLs
  • 5.
    Random slow responseincident User: The application suddenly took a long time to process a request! DBA: Can you provide details? User: It was random. DBA: Has this happened before? User: No, it seemed like a one-time issue. DBA: How long does this request usually take? User: A few seconds. DBA: When did this slow request occur? User: About two hours ago. DBA: Any more specific time? User: No, I'm not sure. www.byte-way.com https://x.com/YuanOracle
  • 6.
    Limitations of AWRin identifying random outlier SQLs • Averages can mask performance spikes and outliers. • Snapshot intervals (e.g., hourly) may miss transient anomalies. • Lack of granularity. • Overhead of frequent snapshots. • Storage and performance impact of detailed logging. www.byte-way.com https://x.com/YuanOracle
  • 7.
    What we need Amethod that can calculate the runtime of every single execution of SQL with little overhead. www.byte-way.com https://x.com/YuanOracle
  • 8.
    Calculating SQL runtimeusing raw ASH data A new approach to identifying culprit SQL statements
  • 9.
    Sources of ASHdata V$ACTIVE_SESSION_HISTORY • Use: Recent/active analysis • Frequency: Every second • Storage: In-memory • Advantage: High precision, captures short-lived SQL • Limitation: Limited data retention. www.byte-way.com https://x.com/YuanOracle DBA_HIST_ACTIVE_SESS_HISTORY • Use: Long-term analysis • Frequency: Every 10 seconds • Storage: Disk-based • Advantage: Longer retention • Limitation: May miss short SQL, less precise The Active Session History (ASH) is a diagnostic tool in Oracle databases that takes samples of all the active sessions and stores the sampled data in two tables.
  • 10.
    Time related columnsin ASH SQL> desc v$active_session_history Name Null? Type ----------------------------------------- -------- ---------------------------- SAMPLE_ID NUMBER SAMPLE_TIME TIMESTAMP(3) SAMPLE_TIME_UTC TIMESTAMP(3) USECS_PER_ROW NUMBER IS_AWR_SAMPLE VARCHAR2(1) SESSION_ID NUMBER SESSION_SERIAL# NUMBER SESSION_TYPE VARCHAR2(10) FLAGS NUMBER USER_ID NUMBER SQL_ID VARCHAR2(13) … SQL_EXEC_ID NUMBER SQL_EXEC_START DATE www.byte-way.com https://x.com/YuanOracle
  • 11.
    Formula SQL Runtime =Maximum Sample Time - SQL Start Time = max(sample_time)-sql_exec_start www.byte-way.com https://x.com/YuanOracle
  • 12.
    Timeline of asession over the past 30 minutes (V$ACTIVE_SESSION_HISTORY) SELECT sample_id, TO_CHAR(sample_time, 'HH24:MI:SS') AS sample_time, TO_CHAR(sql_exec_start, 'HH24:MI:SS') AS sql_start_time, sql_id, sql_exec_id FROM v$active_session_history WHERE sample_time > SYSDATE - 30 / 60 / 24 AND session_id = 124 AND session_serial# = 39232 ORDER BY sample_id; www.byte-way.com https://x.com/YuanOracle
  • 13.
    Output and analysis SAMPLE_IDSAMPLE_T SQL_STAR SQL_ID SQL_EXEC_ID ---------- -------- -------- ------------- ----------- 8937592 16:53:48 16:53:47 3wpnrxd1xpncv 16777216 8937593 16:53:49 16:53:47 3wpnrxd1xpncv 16777216 … 8937626 16:54:23 16:53:47 3wpnrxd1xpncv 16777216 8937627 16:54:24 16:53:47 3wpnrxd1xpncv 16777216 8937628 16:54:25 16:54:24 azrtjtkq79qa6 16777216 8937629 16:54:26 16:54:24 azrtjtkq79qa6 16777216 8937630 16:54:27 16:54:24 azrtjtkq79qa6 16777216 8937631 16:54:28 16:54:24 azrtjtkq79qa6 16777216 8937632 16:54:29 16:54:24 azrtjtkq79qa6 16777216 8937633 16:54:30 16:54:29 dkhax46cjukju 16777216 8937634 16:54:31 16:54:29 dkhax46cjukju 16777216 … www.byte-way.com https://x.com/YuanOracle • For the SQL ID `3wpnrxd1xpncv`, the start time is `16:53:47` , the last sample time is `16:54:24`, the deduced runtime is 37 seconds. • For the SQL ID `azrtjtkq79qa6`, the start time is `16:54:24,` the last sample time is `16:54:29`, the runtime is 5 seconds.
  • 14.
    Output of queryDBA_HIST_ACTIVE_SESS_HISTORY SAMPLE_ID SAMPLE_T SQL_STAR SQL_ID SQL_EXEC_ID ---------- -------- -------- ------------- ----------- 8937596 16:53:52 16:53:47 3wpnrxd1xpncv 16777216 8937606 16:54:02 16:53:47 3wpnrxd1xpncv 16777216 8937616 16:54:12 16:53:47 3wpnrxd1xpncv 16777216 8937626 16:54:23 16:53:47 3wpnrxd1xpncv 16777216 8937636 16:54:33 16:54:29 dkhax46cjukju 16777216 8937646 16:54:43 16:54:29 dkhax46cjukju 16777216 ... www.byte-way.com https://x.com/YuanOracle • For the SQL ID `3wpnrxd1xpncv`, the start time is `16:53:47` , the maximum sample time is `16:54:23`, the deduced runtime is 36 seconds. • For the SQL ID `azrtjtkq79qa6`, this ID is not present in the new output, indicating this SQL execution has not been captured due to the wider sampling interval.
  • 15.
    Observations • Execution Time: •Ends between max sample and next sample. • Not very accurate due to sampling intervals. • Short-lived SQL: • May slip through if between samples. • Frequent executions eventually captured. www.byte-way.com https://x.com/YuanOracle
  • 16.
    Use cases find outlierSQLs in a time window find outlier executions of a specific SQL
  • 17.
  • 18.
    Oracle stopped respondingabout two hours ago -- This query captures 9 longest SQL executions within a one-hour window before and after two hours ago select * from ( select sql_id, round((EXTRACT(DAY FROM (max(sample_time) - max(sql_exec_start))) * 86400) + (EXTRACT(HOUR FROM (max(sample_time) - max(sql_exec_start))) * 3600) + (EXTRACT(MINUTE FROM (max(sample_time) - max(sql_exec_start))) * 60) + (EXTRACT(SECOND FROM (max(sample_time) - max(sql_exec_start)))), 2) as run_seconds, to_char(max(sql_exec_start), 'YYYY-Mon-DD HH24:MI:SS') as exec_start, to_char(max(sample_time), 'YYYY-Mon-DD HH24:MI:SS') as end_time, sql_exec_id from dba_hist_active_sess_history where sql_exec_start between sysdate - interval '3' hour - interval '30' minute and sysdate - interval '1' hour + interval '30' minute and sql_exec_id > 0 group by sql_id, sql_exec_id order by run_seconds desc ) where rownum < 10; www.byte-way.com https://x.com/YuanOracle
  • 19.
    An example ofoutput SQL_ID RUN_SECONDS EXEC_START END_TIME SQL_EXEC_ID 7nz11m353mj22 93.25 2024-Jul-10 13:03:53 2024-Jul-10 13:05:26 16777217 c1nxkb8m44cpz 33.61 2024-Jul-10 13:03:00 2024-Jul-10 13:03:33 16777217 as2dr3ag24gay 11.37 2024-Jul-10 13:03:12 2024-Jul-10 13:03:23 16777224 cx67k8h01fp7y 8.73 2024-Jul-10 13:05:38 2024-Jul-10 13:05:46 16777217 cguxmj11h9gjx 8.09 2024-Jul-10 13:03:46 2024-Jul-10 13:03:54 16777217 b6usrg82hwsa3 8.05 2024-Jul-10 13:12:59 2024-Jul-10 13:13:07 16777228 ajfdc0t0jh5z5 4.49 2024-Jul-10 13:05:32 2024-Jul-10 13:05:36 16777216 as2dr3ag24gay 3.45 2024-Jul-10 13:06:14 2024-Jul-10 13:06:17 16777225 6t9uu481ygn89 2.85 2024-Jul-10 13:03:41 2024-Jul-10 13:03:43 16777217 The SQL statement with SQL_ID 7nz11m353mj22 and an execution time of 93.25 seconds is the most likely culprit for the slow response reported by the user. www.byte-way.com https://x.com/YuanOracle
  • 20.
    Measuring a specificSQL statement -- This query retrieves and calculates the execution time of a specific SQL statement on the current date SELECT sql_id, sql_exec_id, ROUND((EXTRACT(DAY FROM (MAX(sample_time) - MIN(sql_exec_start))) * 86400) + (EXTRACT(HOUR FROM (MAX(sample_time) - MIN(sql_exec_start))) * 3600) + (EXTRACT(MINUTE FROM (MAX(sample_time) - MIN(sql_exec_start))) * 60) + (EXTRACT(SECOND FROM (MAX(sample_time) - MIN(sql_exec_start)))), 2) AS run_seconds, TO_CHAR(MIN(sql_exec_start), 'YYYY-Mon-DD HH24:MI:SS') AS exec_start, TO_CHAR(MAX(sample_time), 'YYYY-Mon-DD HH24:MI:SS') AS end_time FROM dba_hist_active_sess_history WHERE sql_id = 'as2dr3ag24gay' AND TRUNC(sample_time) = TRUNC(SYSDATE) AND sql_exec_id > 0 GROUP BY sql_id, sql_exec_id ORDER BY run_seconds DESC; www.byte-way.com https://x.com/YuanOracle
  • 21.
    An example ofoutput SQL_ID SQL_EXEC_ID RUN_SECONDS EXEC_START END_TIME as2dr3ag24gay 16777224 45.12 2024-Jul-10 13:03:12 2024-Jul-10 13:03:57 as2dr3ag24gay 16777225 3.45 2024-Jul-10 13:06:14 2024-Jul-10 13:06:17 as2dr3ag24gay 16777226 3.67 2024-Jul-10 13:09:20 2024-Jul-10 13:09:24 as2dr3ag24gay 16777227 3.55 2024-Jul-10 13:12:31 2024-Jul-10 13:12:34 as2dr3ag24gay 16777228 3.60 2024-Jul-10 13:15:45 2024-Jul-10 13:15:48 as2dr3ag24gay 16777229 3.50 2024-Jul-10 13:18:50 2024-Jul-10 13:18:54 as2dr3ag24gay 16777230 3.48 2024-Jul-10 13:21:52 2024-Jul-10 13:21:55 as2dr3ag24gay 16777231 3.43 2024-Jul-10 13:24:58 2024-Jul-10 13:25:01 as2dr3ag24gay 16777232 3.46 2024-Jul-10 13:28:05 2024-Jul-10 13:28:08 as2dr3ag24gay 16777233 3.49 2024-Jul-10 13:31:10 2024-Jul-10 13:31:13 The execution of the SQL statement at “2024-Jul-10 13:03:12” is the outlier. www.byte-way.com https://x.com/YuanOracle
  • 22.