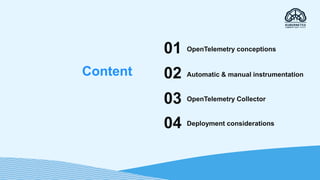
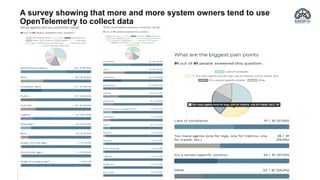
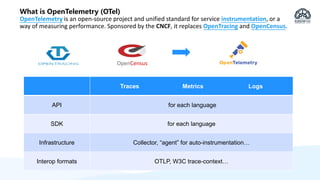
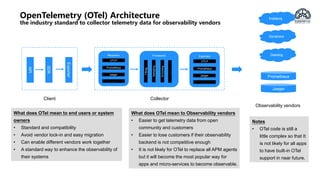
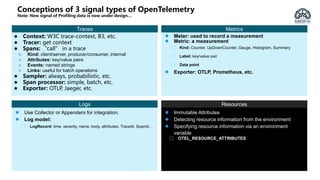
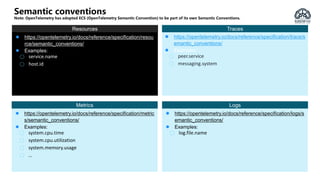
OpenTelemetry is an open source project that provides tools to collect telemetry data like traces, metrics, and logs to analyze application behavior and performance. It provides a standard way to collect telemetry data across different technologies. The document discusses using OpenTelemetry in .NET applications, including adding the necessary packages, configuring logging, and exporting telemetry data to the console. It highlights advantages like easy implementation, integration with other tools via exporters, good community support, and minimal performance impact.
This document provides an overview of an upcoming meetup on OpenTelemetry. The meetup agenda includes introductions to OpenTelemetry, the history and benefits of distributed tracing, and new capabilities enabled by OpenTelemetry like unified telemetry across traces, metrics and logs. Attendees will learn about distributed tracing concepts like traces and spans. They will also learn how OpenTelemetry can provide new workflows for root cause analysis, performance analysis and analytics through its support for distributed traces.
Everyone wants observability into their system, but find themselves with too many vendors and tools, each with its own API, SDK, agent and collectors.
In this talk I will present OpenTelemetry, an ambitious open source project with the promise of a unified framework for collecting observability data. With OpenTelemetry you could instrument your application in a vendor-agnostic way, and then analyze the telemetry data in your backend tool of choice, whether Prometheus, Jaeger, Zipkin, or others.
I will cover the current state of the various projects of OpenTelemetry (across programming languages, exporters, receivers, protocols), some of which not even GA yet, and provide useful guidance on how to get started with it.
Everything You wanted to Know About Distributed TracingAmuhinda Hungai
In the age of microservices, understanding how applications are executing in a highly distributed environment can be complicated. Looking at log files only gives a snapshot of the whole story and looking at a single service in isolation simply does not give enough information. Each service is just one side of a bigger story. Distributed tracing has emerged as an invaluable technique that succeeds in summarizing all sides of the story into a shared timeline. Yet deploying it can be quite challenging, especially in the large scale, polyglot environments of modern companies that mix together many different technologies. During this session, we will take a look at patterns and means to implement Tracing for services. After introducing the basic concepts we will cover how the tracing model works, and how to safely use it in production to troubleshoot and diagnose issues.
Modern cloud-native applications are incredibly complex systems. Keeping the systems healthy and meeting SLAs for our customers is crucial for long-term success. In this session, we will dive into the three pillars of observability - metrics, logs, tracing - the foundation of successful troubleshooting in distributed systems. You'll learn the gotchas and pitfalls of rolling out the OpenTelemetry stack on Kubernetes to effectively collect all your signals without worrying about a vendor lock in. Additionally we will replace parts of the Prometheus stack to scrape metrics with OpenTelemetry collector and operator.
OSMC 2022 | OpenTelemetry 101 by Dotan Horovit s.pdfNETWAYS
This document provides an overview of OpenTelemetry, including:
- OpenTelemetry is an observability framework that assists in generating and capturing telemetry data from cloud-native software across traces, metrics, and logs.
- It includes vendor-agnostic APIs, SDKs, and tools for generating, collecting, and exporting telemetry data to analysis tools.
- OpenTelemetry has reached general availability for tracing and is in release candidate for metrics, with client libraries available for many popular programming languages.
The monolith to cloud-native, microservices evolution has driven a shift from monitoring to observability. OpenTelemetry, a merger of the OpenTracing and OpenCensus projects, is enabling Observability 2.0. This talk gives an overview of the OpenTelemetry project and then outlines some production-proven architectures for improving the observability of your applications and systems.
This presentation has been presented at the "Vienna DevOps & Security Meetup" in 2021.
It discusses the state of monitoring, what Opentelemetry is and why should you care about it.
Concepts and basics are discussed and presented in a full example extracting traces, metrics and logs.
Demo: https://github.com/secustor/opentelemetry-meetup
My contribution to the "Grafana & Friends" Meetup.
This presentation goes into the context in the Observability landscape, the basics of OpenTelemetry with its signals and lookout what to expect next.
- OpenTelemetry is a unified observability library that provides APIs, SDKs, and middleware for generating and exporting traces, metrics, and logs. It combines OpenCensus and OpenTracing into a single open source project.
- The OpenTelemetry architecture includes APIs, SDKs, a collector, and exporters. The SDK implements the API to generate traces and metrics. The collector receives telemetry data from the SDK and exports it to backends like Jaeger and Prometheus.
- The document demonstrates how to instrument a Go application with OpenTelemetry tracing by creating spans from HTTP requests and exporting them to Jaeger for analysis.
Observability in Java: Getting Started with OpenTelemetryDevOps.com
Our software is more complex than ever: applications must be reliable, predictable, and easy to use to meet modern expectations. As developers, this means our responsibilities have grown while the things we can control have stayed the same. In order to better understand our systems and create truly modern software, we need observability.
This workshop will walk through what observability means for Java developers and how to achieve it in our systems with the least amount of work using the open source observability project OpenTelemetry.
This document provides an overview of OpenTelemetry for operators. It discusses some of the limitations of current observability platforms and how OpenTelemetry addresses these issues. It introduces the OpenTelemetry project which combines distributed tracing, metrics, and logging APIs. It describes the OpenTelemetry Collector which receives, processes, and exports telemetry data. It provides examples of Collector configuration and running it in production. It also discusses some innovations in the observability space from vendors like Dynatrace, New Relic, Splunk SignalFX, and others.
Are you interested in dipping your toes in the cloud native observability waters, but as an engineer you are not sure where to get started with tracing problems through your microservices and application landscapes on Kubernetes? Then this is the session for you, where we take you on your first steps in an active open-source project that offers a buffet of languages, challenges, and opportunities for getting started with telemetry data.
The project is called openTelemetry, but before diving into the specifics, we’ll start with de-mystifying key concepts and terms such as observability, telemetry, instrumentation, cardinality, percentile to lay a foundation. After understanding the nuts and bolts of observability and distributed traces, we’ll explore the openTelemetry community; its Special Interest Groups (SIGs), repositories, and how to become not only an end-user, but possibly a contributor.We will wrap up with an overview of the components in this project, such as the Collector, the OpenTelemetry protocol (OTLP), its APIs, and its SDKs.
Attendees will leave with an understanding of key observability concepts, become grounded in distributed tracing terminology, be aware of the components of openTelemetry, and know how to take their first steps to an open-source contribution!
Key Takeaways: Open source, vendor neutral instrumentation is an exciting new reality as the industry standardizes on openTelemetry for observability. OpenTelemetry is on a mission to enable effective observability by making high-quality, portable telemetry ubiquitous. The world of observability and monitoring today has a steep learning curve and in order to achieve ubiquity, the project would benefit from growing our contributor community.
OpenTelemetry is a set of APIs, SDKs, tooling and integrations that are designed for the creation and management of telemetry data such as traces, metrics, and logs. It aims to enable effective observability by making high-quality, portable telemetry ubiquitous and vendor-agnostic. The OpenTelemetry Collector is an independent process that acts as a "universal agent" to collect, process, and export telemetry data in a highly performant and stable manner, supporting multiple types of telemetry through customizable pipelines consisting of receivers, processors, and exporters.
This document discusses concepts related to observability including Prometheus, ELK stack, OpenTracing, and Victoria Metrics. It provides examples of setting up Prometheus and Grafana to monitor metrics from applications instrumented with exporters. It also demonstrates setting up Filebeat, Logstash and Elasticsearch (ELK stack) to monitor logs and send them to Elasticsearch. Additionally, it shows how to implement OpenTracing in a Java application and visualize traces using Jaeger. Finally, it outlines an exercise to build a microservices ecommerce application incorporating logging, metrics and tracing using the discussed tools.
Kubernetes Observability with Prometheus by ExampleThomas Riley
This talk was given at Cloud Native + Kubernetes Manchester, July 2019.
Prometheus is quickly becoming the de factor open-source monitoring and alerting tool for Kubernetes. Through a series of live demos I will explain how to deploy Prometheus into Kubernetes and make use of it for monitoring Kubernetes. I will also demonstrate how to successfully run Prometheus in HA with the Thanos project and how to store years worth of metrics without requiring heaps of CPU, memory and storage for Prometheus.
Understand your system like never before with OpenTelemetry, Grafana, and Pro...LibbySchulze
This document discusses using OpenTelemetry, Grafana, and Promscale to gain insights into distributed systems. It summarizes OpenTelemetry for instrumentation, Promscale as an observability backend built on TimescaleDB that allows analyzing metrics, traces and business data together, and demonstrates this using a lightweight microservices demo that generates absurd passwords. The demo can be run locally and visualized in Grafana.
The monolith to cloud-native, microservices evolution has driven a shift from monitoring to observability. OpenTelemetry, a merger of the OpenTracing and OpenCensus projects, is enabling Observability 2.0. This talk covers the fundamental concepts of observability and then demonstrates how to instrument your applications using the OpenTelemetry libraries.
Observability, Distributed Tracing, and Open Source: The Missing PrimerVMware Tanzu
Open source tools like OpenTelemetry, OpenTracing, and W3C Trace Context are helping to standardize distributed tracing and observability. This allows developers to understand problems in microservices architectures by propagating unique trace IDs and collecting metrics and traces across services. While open source tools are useful for development and pre-production, commercial solutions are needed to handle production workloads at scale with additional features like access control and automated instrumentation. Standardization through open source is key to managing today's complexity in distributed systems.
Application Performance Monitoring with OpenTelemetryJan Mikeš
OpenTelemetry is an open source observability framework that provides standard APIs and SDKs for instrumenting applications to generate and collect telemetry data. It aims to solve the problem of different APM tools requiring re-instrumentation of code by providing a common data format. OpenTelemetry consists of SDKs that instrument code to generate traces and metrics, exporters to send that data to backends, and a collector service that can receive telemetry in a vendor-agnostic way before exporting to various APM solutions. It is supported by many cloud providers and vendors but does not include its own monitoring backend.
stackconf 2023 | Practical introduction to OpenTelemetry tracing by Nicolas F...NETWAYS
Tracking a request’s flow across different components in distributed systems is essential. With the rise of microservices, their importance has risen to critical levels. Some proprietary tools for tracking have been used already: Jaeger and Zipkin naturally come to mind. Observability is built on three pillars: logging, metrics, and tracing. OpenTelemetry is a joint effort to bring an open standard to them. Jaeger and Zipkin joined the effort so that they are now OpenTelemetry compatible. In this talk, I’ll describe the above in more detail and showcase a (simple) use case to demo how you could benefit from OpenTelemetry in your distributed architecture.
Prometheus is an open-source monitoring system that collects metrics from instrumented systems and applications and allows for querying and alerting on metrics over time. It is designed to be simple to operate, scalable, and provides a powerful query language and multidimensional data model. Key features include no external dependencies, metrics collection by scraping endpoints, time-series storage, and alerting handled by the AlertManager with support for various integrations.
The document summarizes an introduction presentation about Loki, an open source log aggregation system. It describes Loki's origins and timeline, components including Loki, Promtail and Grafana, its architecture that indexes logs by label rather than text, interfaces for accessing logs, and concludes that Loki is open source, integrates well with Grafana, and is easy to use with Kubernetes.
Microservices architecture involves many services that are being distributed over the network resulting in many more ways of failure. This session will try to cover the available tools that can help you when designing/building such distributed system in Go
Prometheus has become the defacto monitoring system for cloud native applications, with systems like Kubernetes and Etcd natively exposing Prometheus metrics. In this talk Tom will explore all the moving part for a working Prometheus-on-Kubernetes monitoring system, including kube-state-metrics, node-exporter, cAdvisor and Grafana. You will learn about the various methods for getting to a working setup: the manual approach, using CoreOSs Prometheus Operator, or using Prometheus Ksonnet Mixin. Tom will also share some little tips and tricks for getting the most out of your Prometheus monitoring, including the common pitfalls and what you should be alerting on.
This document discusses distributed tracing and OpenTelemetry. It provides an overview of tracing concepts like spans and context propagation. It describes the OpenTelemetry architecture including specifications, instrumentation libraries, and the OpenTelemetry collector. It discusses how to instrument applications for automatic tracing and exporting telemetry data. Finally, it covers best practices for debugging distributed systems using observability data and next steps to get involved in the OpenTelemetry community.
It's been said that open source software is eating the world. In the observability space, the project making this possible is OpenTelemetry. It's quickly becoming the standard for instrumentation and data collection of observability data. Understanding what data to collect and how to collect it properly is fundamental to ensuring users can quickly address availability and performance issues. Steve Flanders, Director of Engineering at Splunk, discusses the components of the project, its current status, and how you can get started integrating it into your modern app infrastructure.
Speakers:
Steve Flanders
For the Docker users out there, Sematext's DevOps Evangelist, Stefan Thies, goes through a number of different Docker monitoring options, points out their pros and cons, and offers solutions for Docker monitoring. Webinar contains actionable content, diagrams and how-to steps.
OpenTelemetry is a vendor-neutral observability framework that focuses on generating, collecting, managing and exporting telemetry data like traces, metrics and logs. It consists of specifications, SDKs, and a collector. The SDK instruments code to emit telemetry which is sent to the collector via protocols like OTLP. The collector then processes and exports this data to observability backends through components like receivers, processors and exporters. OpenTelemetry enables distributed tracing across services by propagating trace context in HTTP headers.
CodeChecker is a static analysis tool that finds bugs in code by performing interprocedural analysis across files and functions. It uses the Clang compiler infrastructure to run checks from tools like the Clang Static Analyzer and Clang Tidy. CodeChecker provides features like cross-translation unit analysis, suppressing and tagging issues, and integration with version control systems. It outputs analysis results that are easy for developers to understand and fix issues.
No production system is complete without a way to monitor it. In software, we define observability as the ability to understand how our system is performing. This talk dives into capabilities and tools that are recommended for implementing observability when running K8s in production as the main platform today for deploying and maintaining containers with cloud-native solutions.
We start by introducing the concept of observability in the context of distributed systems such as K8s and the difference with monitoring. We continue by reviewing the observability stack in K8s and the main functionalities. Finally, we will review the tools K8s provides for monitoring and logging, and get metrics from applications and infrastructure.
Between the points to be discussed we can highlight:
-Introducing the concept of observability
-Observability stack in K8s
-Tools and apps for implementing Kubernetes observability
-Integrating Prometheus with OpenMetrics
The document discusses proposals for implementing profiling middleware and tools for Swift. It outlines a profiling architecture that would inject profiling at the system, process, code and line level granularity. Profiling data would be collected and stored in a multi-dimensional model covering dimensions like time, workload, system and code metrics. Open source profiling tools could then be used to analyze and visualize the data to identify performance bottlenecks.
Measuring P99 Latency in Event-Driven Architectures with OpenTelemetryScyllaDB
While there are numerous benefits to Event-Driven Architecture, like improved productivity, flexibility, and scalability, they also pose a few disadvantages, such as the complexity of measuring end-to-end latency and identifying bottlenecks in specific services.
This talk shows you how to produce telemetry from your services using an open standard to retain control of data. OpenTelemetry allows you to instrument your application code through vendor-neutral APIs, libraries, and tools. It provides the tools necessary for you to gain visibility into the performance of your services and overall latency.
Anton will share his experience building high-throughput services and strategies to use distributed tracing in an optimal way without affecting the overall performance of the services.
Building a data pipeline to ingest data into Hadoop in minutes using Streamse...Guglielmo Iozzia
Slides from my talk at the Hadoop User Group Ireland meetup on June 13th 2016: building a data pipeline to ingest data from sources of different nature into Hadoop in minutes (and no coding at all) using the Open Source Streamsets Data Collector tool.
Logitoring - log-driven monitoring and the Rocket scienceEDS Systems
Talking about a common way of delivering, storing and analyzing monitoring/log/trace data flows.
Do the data in monitoring have the same
nature as data in logging?
Building an Observability Platform in 389 Difficult StepsDigitalOcean
Watch this Tech Talk: https://do.co/video_dworth
Dave Worth, Engineering Manager at Strava, lays out a strategy for choosing the right tech stack depending on your business and team need. Watch as he guides you through tool sets that navigate around business constraints and regulatory concerns.
About the Presenter
Dave Worth’s professional life consists of being a web and backend engineer who developed specialization in observability through building reliable distributed systems at Strava, and previously DigitalOcean. In his spare time, Dave loves cycling, jiu jitsu, and searching for another great math book to only read the first 50 pages of.
New to DigitalOcean? Get US $100 in credit when you sign up: https://do.co/deploytoday
To learn more about DigitalOcean: https://www.digitalocean.com/
Follow us on Twitter: https://twitter.com/digitalocean
Like us on Facebook: https://www.facebook.com/DigitalOcean
Follow us on Instagram: https://www.instagram.com/thedigitalocean/
We're hiring: http://do.co/careers
Manage Microservices Chaos and Complexity with ObservabilityNGINX, Inc.
Learn about the three principal classes of observability data, the importance of infrastructure and app alignment, and ways to start analyzing deep data.
Herding cats & catching fire: Workday's telemetry & middlewareSensu Inc.
In this talk from Sensu Summit 2018, David Beaurpere, Principal Software Engineer for the Observability Group at Workday Ltd, discusses how Sensu 1.x evolved from a Nagios replacement to the backbone monitoring data collection and transport at Workday.
LCU14-101: Coresight Overview
---------------------------------------------------
Speaker: Mathieu Poirier
Date: September 15, 2014
---------------------------------------------------
Coresight is the name given to a set of IP blocks providing hardware assisted tracing for ARM based SoCs. This presentation will give an introduction to the technology, how it works and offer a glimpse of the capabilities it offers. More specifically we will go over the components that are part of the architecture and how they are used. Next will be presented the framework Linaro is working on in an effort to provide consolidation and standardization of interfaces to the coresight subsystem. We will conclude with a status of our current upstreaming efforts and how we see the coming months unfolding.
---------------------------------------------------
★ Resources ★
Zerista: http://lcu14.zerista.com/event/member/137703
Google Event: https://plus.google.com/u/0/events/cvb85kqv10dsc4k3e0hcvbr6i58
Presentation: http://www.slideshare.net/linaroorg/lcu14-101-coresight-overview
Video: https://www.youtube.com/watch?v=NzKPd3FByxI&list=UUIVqQKxCyQLJS6xvSmfndLA
Etherpad: http://pad.linaro.org/p/lcu14-101
---------------------------------------------------
★ Event Details ★
Linaro Connect USA - #LCU14
September 15-19th, 2014
Hyatt Regency San Francisco Airport
---------------------------------------------------
http://www.linaro.org
http://connect.linaro.org
Kapacitor - Real Time Data Processing EnginePrashant Vats
Kapacitor is a native data processing engine.Kapacitor is a native data processing engine.It can process both stream and batch data from InfluxDB.It lets you plug in your own custom logic or user-defined functions to process alerts with dynamic thresholds. Key Kapacitor Capabilities
-Alerting
-ETL (Extraction, Transformation and Loading)
-Action Oriented
-Streaming Analytics
-Anomaly Detection
Kapacitor uses a DSL (Domain Specific Language) called TICKscript to define tasks.
Tech Talk: ONOS- A Distributed SDN Network Operating Systemnvirters
This event takes us to the cusp of Distributed Software Development and SDN Controllers. We will be hosting Madan and Brian who have been involved in the architecture and development of ONOS (Open Network Operating System).
Synopsis
ONOS is a distributed SDN network operating system architected to provide performance, scale-out, resiliency, and well-defined northbound and southbound abstractions. Madan and Brian, both from ON.Lab, will start the talk with a deep-dive into ONOS architecture, including the key technical challenges that were solved to build this platform. They will also walk us through a live demo of building a SDN application on ONOS.
Details:
ONOS Architecture
ONOS Abstractions and Modularity
ONOS Distributed architecture
ONOS APIs and their usage
Live demo- Building a SDN app on ONOS
Speaker Bios
Madan Jampani, Distributed Systems Architect, ONOS
Madan is Distributed Systems Architect at ON.Lab focusing on the core distributed systems problems for ONOS. Prior to joining ON.Lab in Sep 2014, Madan worked at Amazon for around 10 years. At Amazon, Madan was instrumental in building several key technologies ranging from Amazon retail ordering systems, distributed data stores and shared compute clusters for running large-scale data processing and machine learning workloads.
Brian O’Connor, Lead Developer, ONOS
Brian is the ONOS Application Intent Framework lead and a core developer at ON.Lab, working on ONOS and Mininet. Brian O’Connor received Bachelor’s and Master’s degrees in Computer Science from Stanford University. At Stanford, he helped develop “An Introduction to Computer Networking,” one of Stanford’s first MOOCs (Massively Open Online Courses).
ABOUT ON.LAB and ONOS
Open Networking Lab (ON.Lab) is a non-profit organization founded by SDN inventors and leaders from Stanford University and UC Berkeley to foster an open source community for developing tools and platforms to realize the full potential of SDN. ON.Lab brings innovative ideas from leading edge research and delivers high quality open source platforms on which members of its ecosystem and the industry can build real products and solutions.
ONOS, a SDN network operating system for service provider and mission critical networks, was open sourced on Dec 5th, 2014. ONOS delivers a highly available, scalable SDN control plane featuring northbound and southbound abstractions and interfaces for a diversity of management, control, service applications and network devices. ONOS ecosystem comprises of ON.Lab, organizations who are funding and contributing to the ONOS initiative including AT&T, NTT Communications, SK Telecom, Ciena, Cisco, Ericsson, Fujitsu, Huawei, Intel, NEC; members who are collaborating and contributing to ONOS include ONF, Infoblox, SRI, Internet2, Happiest Minds, CNIT, Black Duck, Create-Net and the broader ONOS community. Learn how you can get involved with ONOS at onosproject.org.
The ORTE implements the RTPS communications model for embedded systems, running on a standard UDP/IP stack. It provides a publish-subscribe middleware interface that handles network communication tasks, allowing publishers and subscribers to label messages with topics rather than node addresses. The demo Shape Demo uses ORTE and QT libraries to demonstrate real-time publish-subscribe capabilities by globally transferring shape data between publisher and subscriber nodes configured through a graphical interface. ORTE is implemented as a set of manager, application, writer, and reader objects and supports Linux, RTLinux, and Windows platforms.
Improving monitoring systems Interoperability with OpenMetricsChan Shik Lim
Introduction Prometheus with OpenMetrics for improving monitoring system interoperability.
- Introduction Prometheus
- Introduction OpenMetrics
- Demo: Prometheus and Datadog integration with OpenMetrics
Hyperledger Besu 빨리 따라하기 (Private Networks)wonyong hwang
Hyperledger Besu의 Private Networks에서 진행하는 실습입니다. 주요 내용은 공식 문서인https://besu.hyperledger.org/private-networks/tutorials 의 내용에서 발췌하였으며, Privacy Enabled Network와 Permissioned Network까지 다루고 있습니다.
This is a training session at Hyperledger Besu's Private Networks, with the main content excerpts from the official document besu.hyperledger.org/private-networks/tutorials and even covers the Private Enabled and Permitted Networks.
DECODING JAVA THREAD DUMPS: MASTER THE ART OF ANALYSISTier1 app
Are you ready to unlock the secrets hidden within Java thread dumps? Join us for a hands-on session where we'll delve into effective troubleshooting patterns to swiftly identify the root causes of production problems. Discover the right tools, techniques, and best practices while exploring *real-world case studies of major outages* in Fortune 500 enterprises. Engage in interactive lab exercises where you'll have the opportunity to troubleshoot thread dumps and uncover performance issues firsthand. Join us and become a master of Java thread dump analysis!
Flutter vs. React Native: A Detailed Comparison for App Development in 2024dhavalvaghelanectarb
Choosing the right framework for your cross-platform mobile app can be a tough decision. Both Flutter and React Native offer compelling features and have earned their place in the development world. Here is a detailed comparison to help you weigh their strengths and weaknesses. Here are the pros and cons of developing mobile apps in React Native vs Flutter.
Boost Your Savings with These Money Management AppsJhone kinadey
A money management app can transform your financial life by tracking expenses, creating budgets, and setting financial goals. These apps offer features like real-time expense tracking, bill reminders, and personalized insights to help you save and manage money effectively. With a user-friendly interface, they simplify financial planning, making it easier to stay on top of your finances and achieve long-term financial stability.
Just like life, our code must adapt to the ever changing world we live in. From one day coding for the web, to the next for our tablets or APIs or for running serverless applications. Multi-runtime development is the future of coding, the future is to be dynamic. Let us introduce you to BoxLang.
Consistent toolbox talks are critical for maintaining workplace safety, as they provide regular opportunities to address specific hazards and reinforce safe practices.
These brief, focused sessions ensure that safety is a continual conversation rather than a one-time event, which helps keep safety protocols fresh in employees' minds. Studies have shown that shorter, more frequent training sessions are more effective for retention and behavior change compared to longer, infrequent sessions.
Engaging workers regularly, toolbox talks promote a culture of safety, empower employees to voice concerns, and ultimately reduce the likelihood of accidents and injuries on site.
The traditional method of conducting safety talks with paper documents and lengthy meetings is not only time-consuming but also less effective. Manual tracking of attendance and compliance is prone to errors and inconsistencies, leading to gaps in safety communication and potential non-compliance with OSHA regulations. Switching to a digital solution like Safelyio offers significant advantages.
Safelyio automates the delivery and documentation of safety talks, ensuring consistency and accessibility. The microlearning approach breaks down complex safety protocols into manageable, bite-sized pieces, making it easier for employees to absorb and retain information.
This method minimizes disruptions to work schedules, eliminates the hassle of paperwork, and ensures that all safety communications are tracked and recorded accurately. Ultimately, using a digital platform like Safelyio enhances engagement, compliance, and overall safety performance on site. https://safelyio.com/
Secure-by-Design Using Hardware and Software Protection for FDA ComplianceICS
This webinar explores the “secure-by-design” approach to medical device software development. During this important session, we will outline which security measures should be considered for compliance, identify technical solutions available on various hardware platforms, summarize hardware protection methods you should consider when building in security and review security software such as Trusted Execution Environments for secure storage of keys and data, and Intrusion Detection Protection Systems to monitor for threats.
The Power of Visual Regression Testing_ Why It Is Critical for Enterprise App...kalichargn70th171
Visual testing plays a vital role in ensuring that software products meet the aesthetic requirements specified by clients in functional and non-functional specifications. In today's highly competitive digital landscape, users expect a seamless and visually appealing online experience. Visual testing, also known as automated UI testing or visual regression testing, verifies the accuracy of the visual elements that users interact with.
How GenAI Can Improve Supplier Performance Management.pdfZycus
Data Collection and Analysis with GenAI enables organizations to gather, analyze, and visualize vast amounts of supplier data, identifying key performance indicators and trends. Predictive analytics forecast future supplier performance, mitigating risks and seizing opportunities. Supplier segmentation allows for tailored management strategies, optimizing resource allocation. Automated scorecards and reporting provide real-time insights, enhancing transparency and tracking progress. Collaboration is fostered through GenAI-powered platforms, driving continuous improvement. NLP analyzes unstructured feedback, uncovering deeper insights into supplier relationships. Simulation and scenario planning tools anticipate supply chain disruptions, supporting informed decision-making. Integration with existing systems enhances data accuracy and consistency. McKinsey estimates GenAI could deliver $2.6 trillion to $4.4 trillion in economic benefits annually across industries, revolutionizing procurement processes and delivering significant ROI.
Hands-on with Apache Druid: Installation & Data Ingestion StepsservicesNitor
Supercharge your analytics workflow with https://bityl.co/Qcuk Apache Druid's real-time capabilities and seamless Kafka integration. Learn about it in just 14 steps.
🏎️Tech Transformation: DevOps Insights from the Experts 👩💻campbellclarkson
Connect with fellow Trailblazers, learn from industry experts Glenda Thomson (Salesforce, Principal Technical Architect) and Will Dinn (Judo Bank, Salesforce Development Lead), and discover how to harness DevOps tools with Salesforce.
The Role of DevOps in Digital Transformation.pdfmohitd6
DevOps plays a crucial role in driving digital transformation by fostering a collaborative culture between development and operations teams. This approach enhances the speed and efficiency of software delivery, ensuring quicker deployment of new features and updates. DevOps practices like continuous integration and continuous delivery (CI/CD) streamline workflows, reduce manual errors, and increase the overall reliability of software systems. By leveraging automation and monitoring tools, organizations can improve system stability, enhance customer experiences, and maintain a competitive edge. Ultimately, DevOps is pivotal in enabling businesses to innovate rapidly, respond to market changes, and achieve their digital transformation goals.
Penify - Let AI do the Documentation, you write the Code.KrishnaveniMohan1
Penify automates the software documentation process for Git repositories. Every time a code modification is merged into "main", Penify uses a Large Language Model to generate documentation for the updated code. This automation covers multiple documentation layers, including InCode Documentation, API Documentation, Architectural Documentation, and PR documentation, each designed to improve different aspects of the development process. By taking over the entire documentation process, Penify tackles the common problem of documentation becoming outdated as the code evolves.
https://www.penify.dev/
Building API data products on top of your real-time data infrastructureconfluent
This talk and live demonstration will examine how Confluent and Gravitee.io integrate to unlock value from streaming data through API products.
You will learn how data owners and API providers can document, secure data products on top of Confluent brokers, including schema validation, topic routing and message filtering.
You will also see how data and API consumers can discover and subscribe to products in a developer portal, as well as how they can integrate with Confluent topics through protocols like REST, Websockets, Server-sent Events and Webhooks.
Whether you want to monetize your real-time data, enable new integrations with partners, or provide self-service access to topics through various protocols, this webinar is for you!
4. A survey showing that more and more system owners tend to use
OpenTelemetry to collect data
5. What is OpenTelemetry (OTel)
OpenTelemetry is an open-source project and unified standard for service instrumentation, or a
way of measuring performance. Sponsored by the CNCF, it replaces OpenTracing and OpenCensus.
+ OpenCensus
Traces Metrics Logs
API for each language
SDK for each language
Infrastructure Collector, “agent” for auto-instrumentation…
Interop formats OTLP, W3C trace-context…
6. OpenTelemetry (OTel) Architecture
the industry standard to collector telemetry data for observability vendors
Client
API
SDK
Exporter
Collector
Receivers
OTLP
Prometheus
Jaeger
… …
Processors
Filling
Sampling
Enriching
…
…
Exporters
OTLP
Prometheus
Jaeger
… …
Instana
Dynatrace
Datadog
… …
Prometheus
Jaeger
… …
Observability vendors
What does OTel mean to end users or system
owners
• Standard and compatibility
• Avoid vendor lock-in and easy migration
• Can enable different vendors work together
• A standard way to enhance the observability of
their systems
What does OTel mean to Observability vendors
• Easier to get telemetry data from open
community and customers
• Easier to lose customers if their observability
backend is not competitive enough
• It is not likely for OTel to replace all APM agents
but it will become the most popular way for
apps and micro-services to become observable.
Notes
• OTel code is still a
little complex so that It
is not likely for all apps
to have built-in OTel
support in near future.
7. Conceptions of 3 signal types of OpenTelemetry
Note: New signal of Profiling data is now under design…
● Context: W3C trace-context, B3, etc.
● Tracer: get context
● Spans: “call” in a trace
○ Kind: client/server, producer/consumer, internal
○ Attributes: key/value pairs
○ Events: named strings
○ Links: useful for batch operations
● Sampler: always, probabilistic, etc.
● Span processor: simple, batch, etc.
● Exporter: OTLP, Jaeger, etc.
Traces
● Meter: used to record a measurement
● Metric: a measurement
○ Kind: Counter, UpDownCounter, Gauge, Histogram, Summary
○ Label: key/value pair
○ Data point
● Exporter: OTLP, Prometheus, etc.
Metrics
● Use Collector or Appenders for integration.
● Log model:
○ LogRecord: time, severity, name, body, attributes, TraceId, SpanId…
Logs
● Immutable Attributes
● Detecting resource information from the environment
● Specifying resource information via an environment
variable
○ OTEL_RESOURCE_ATTRIBUTES
Resources
8. Semantic conventions
Note: OpenTelemetry has adopted ECS (OpenTelemetry Semantic Convention) to be part of its own Semantic Conventions.
● https://opentelemetry.io/docs/reference/specification/trace/s
emantic_conventions/
● Examples:
○ peer.service
○ messaging.system
Traces
● https://opentelemetry.io/docs/reference/specification/metric
s/semantic_conventions/
● Examples:
○ system.cpu.time
○ system.cpu.utilization
○ system.memory.usage
○ …
Metrics
● https://opentelemetry.io/docs/reference/specification/logs/s
emantic_conventions/
● Examples:
○ log.file.name
Logs
● https://opentelemetry.io/docs/reference/specification/resou
rce/semantic_conventions/
● Examples:
○ service.name
○ host.id
Resources
10. Solutions of automatic instrumentation for different languages
Language Support? Solution
Java Yes Java Agent
Python Yes Python agent
.Net Yes .NET Profiler
Javacript Yes Preloaded module
GoLang Yes(Beta) eBPF
PHP Yes(At least PHP 8.0) the OpenTelemetry PHP extension
Ruby minor global code changes use the opentelemetry-instrumentation-all package
C++ N/A Manu-instrumentation, vcpkg
Rust N/A Manu-instrumentation
Note: OpenTelemetry Operator supports convenient auto-instrumentation installation in Kubernetes
environments.
11. Example of Java auto-instrumentation
Example-1 for Java
export JAVA_OPTS="-javaagent:/opt/dev/otel/res/opentelemetry-
javaagent.jar"
export OTEL_TRACES_EXPORTER=logging
export OTEL_METRICS_EXPORTER=logging
export OTEL_LOGS_EXPORTER=logging
Example-2 for Java
export JAVA_OPTS="-javaagent:/opt/dev/otel/res/opentelemetry-javaagent.jar"
export OTEL_TRACES_EXPORTER=otlp
export OTEL_METRICS_EXPORTER=none
export OTEL_LOGS_EXPORTER=none
export OTEL_EXPORTER_OTLP_TRACES_ENDPOINT="https://otlp-orange-
saas.instana.io:4317"
export OTEL_SERVICE_NAME=lr1service
export OTEL_EXPORTER_OTLP_PROTOCOL=grpc
export OTEL_EXPORTER_OTLP_HEADERS="x-instana-key=xxxxxxxxx,x-instana-
host=dk-liurui"
12. Example of Java manual-instrumentation
Initialization Instrumentation for traces
16. Best practice to use OpenTelemetry Collector
❖ Key points:
➢ Collectors can be chained
➢ Receiver instance can be shared
➢ Processor instance cannot be shared
➢ Exporter instance can be shared
➢ Use Connector can build complex stream flows
within a single Collector.
❖ Some popular components of Collector:
➢ Receivers ~ 91
otlp, filelog, hostmetric, prometheus, jaeger…
➢ Processors ~ 25
batch, filter, resourcedetection, spanmetrics,
transform, probabilisticsampler…
➢ Exporters ~ 49
otlp, otlphttp, prometheus, jaeger, logging, file…
➢ Connectors ~ 5
forward, spanmetrics, count
18. Deployments of OpenTelemetry
• With Binary OpenTelemetry Collector – for example for the usage of host metrics receiver…
• With Container based OpenTelemetry Collector – optionally using docker compose.
• Enable OpenTelemetry in Kubernetes
• Deploy OpenTelemetry Collector with built-in Kubernetes components (deployments or daemonset,
service, configmap…), optionally using Helm chart.
• Using OpenTelemetry Operator
• Have built-in OpenTelemetry Collector
• Support auto-instrumentation (inject sidecar into workloads with predefined annotation) for Java, Python, .Net,
NodeJS, GoLang…