Download as PDF, PPTX


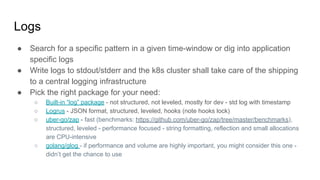

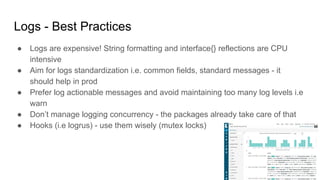
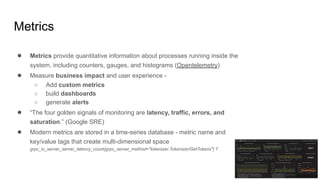

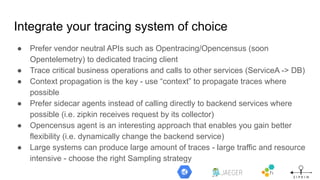
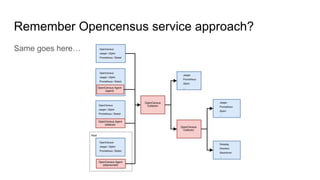
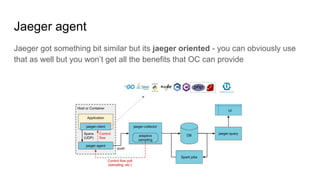

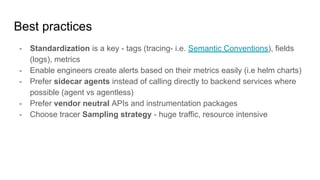
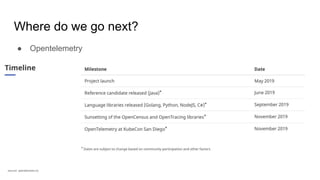


The document discusses observability in cloud-native systems, emphasizing the importance of logs, metrics, and distributed tracing to gain insights into system behavior. It highlights best practices for logging, standardization, and the use of vendor-neutral APIs like OpenTelemetry for effective monitoring and tracing. The content also touches on the evolution of observability tools and strategies to improve system understanding and performance.