Download as ODP, PPTX


![11
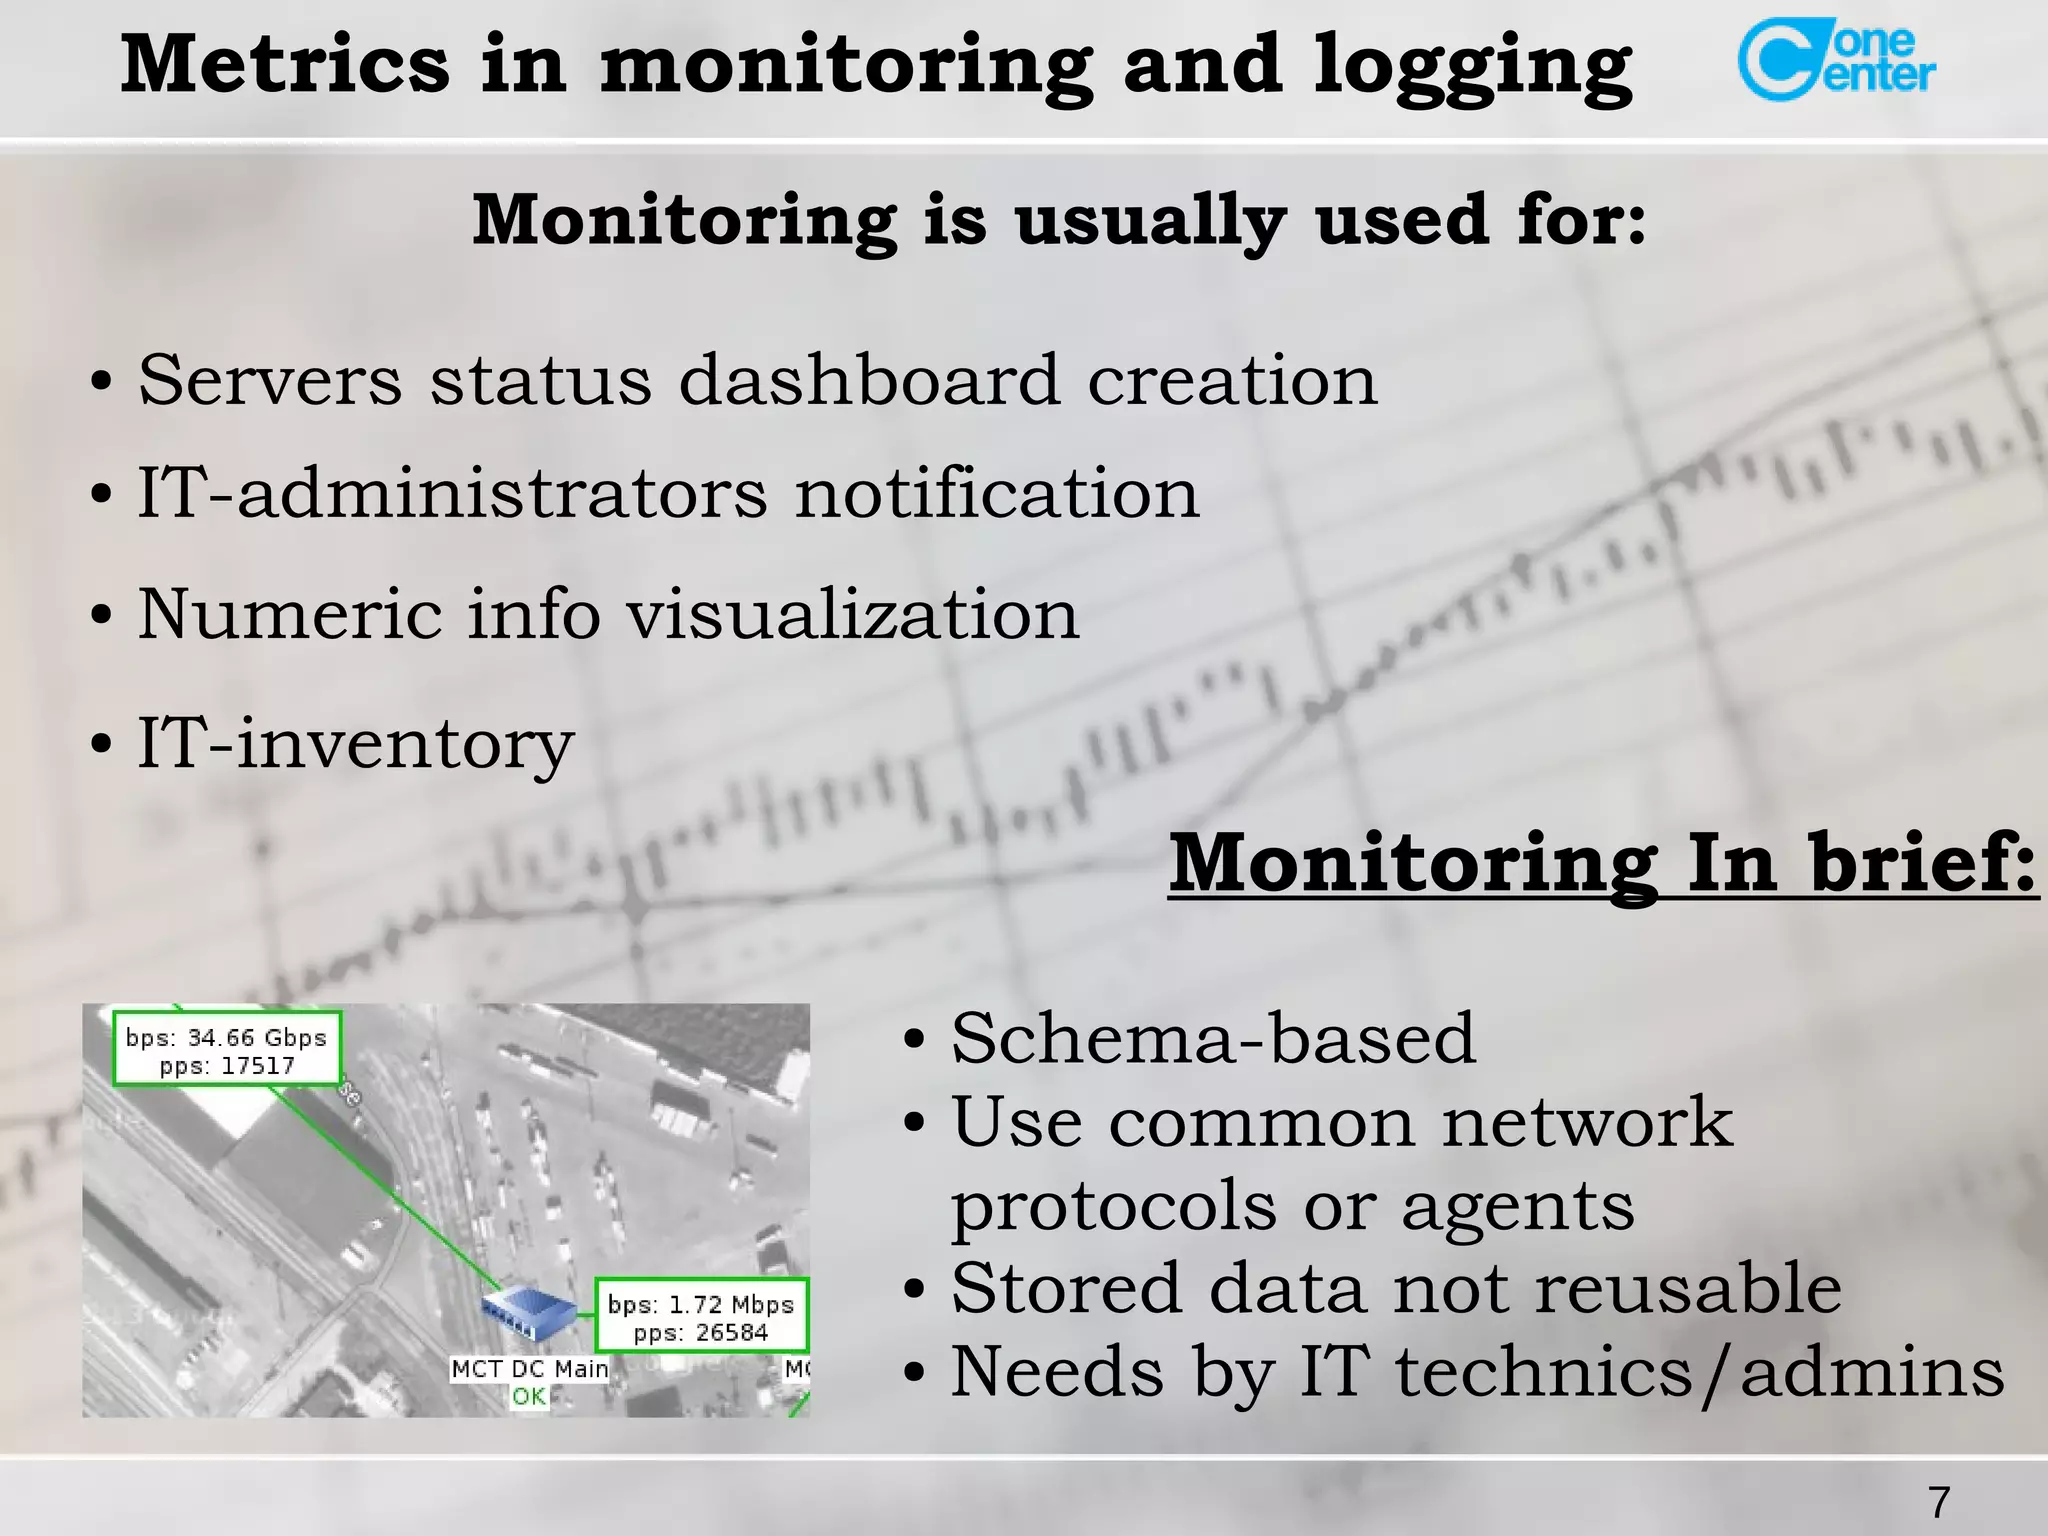
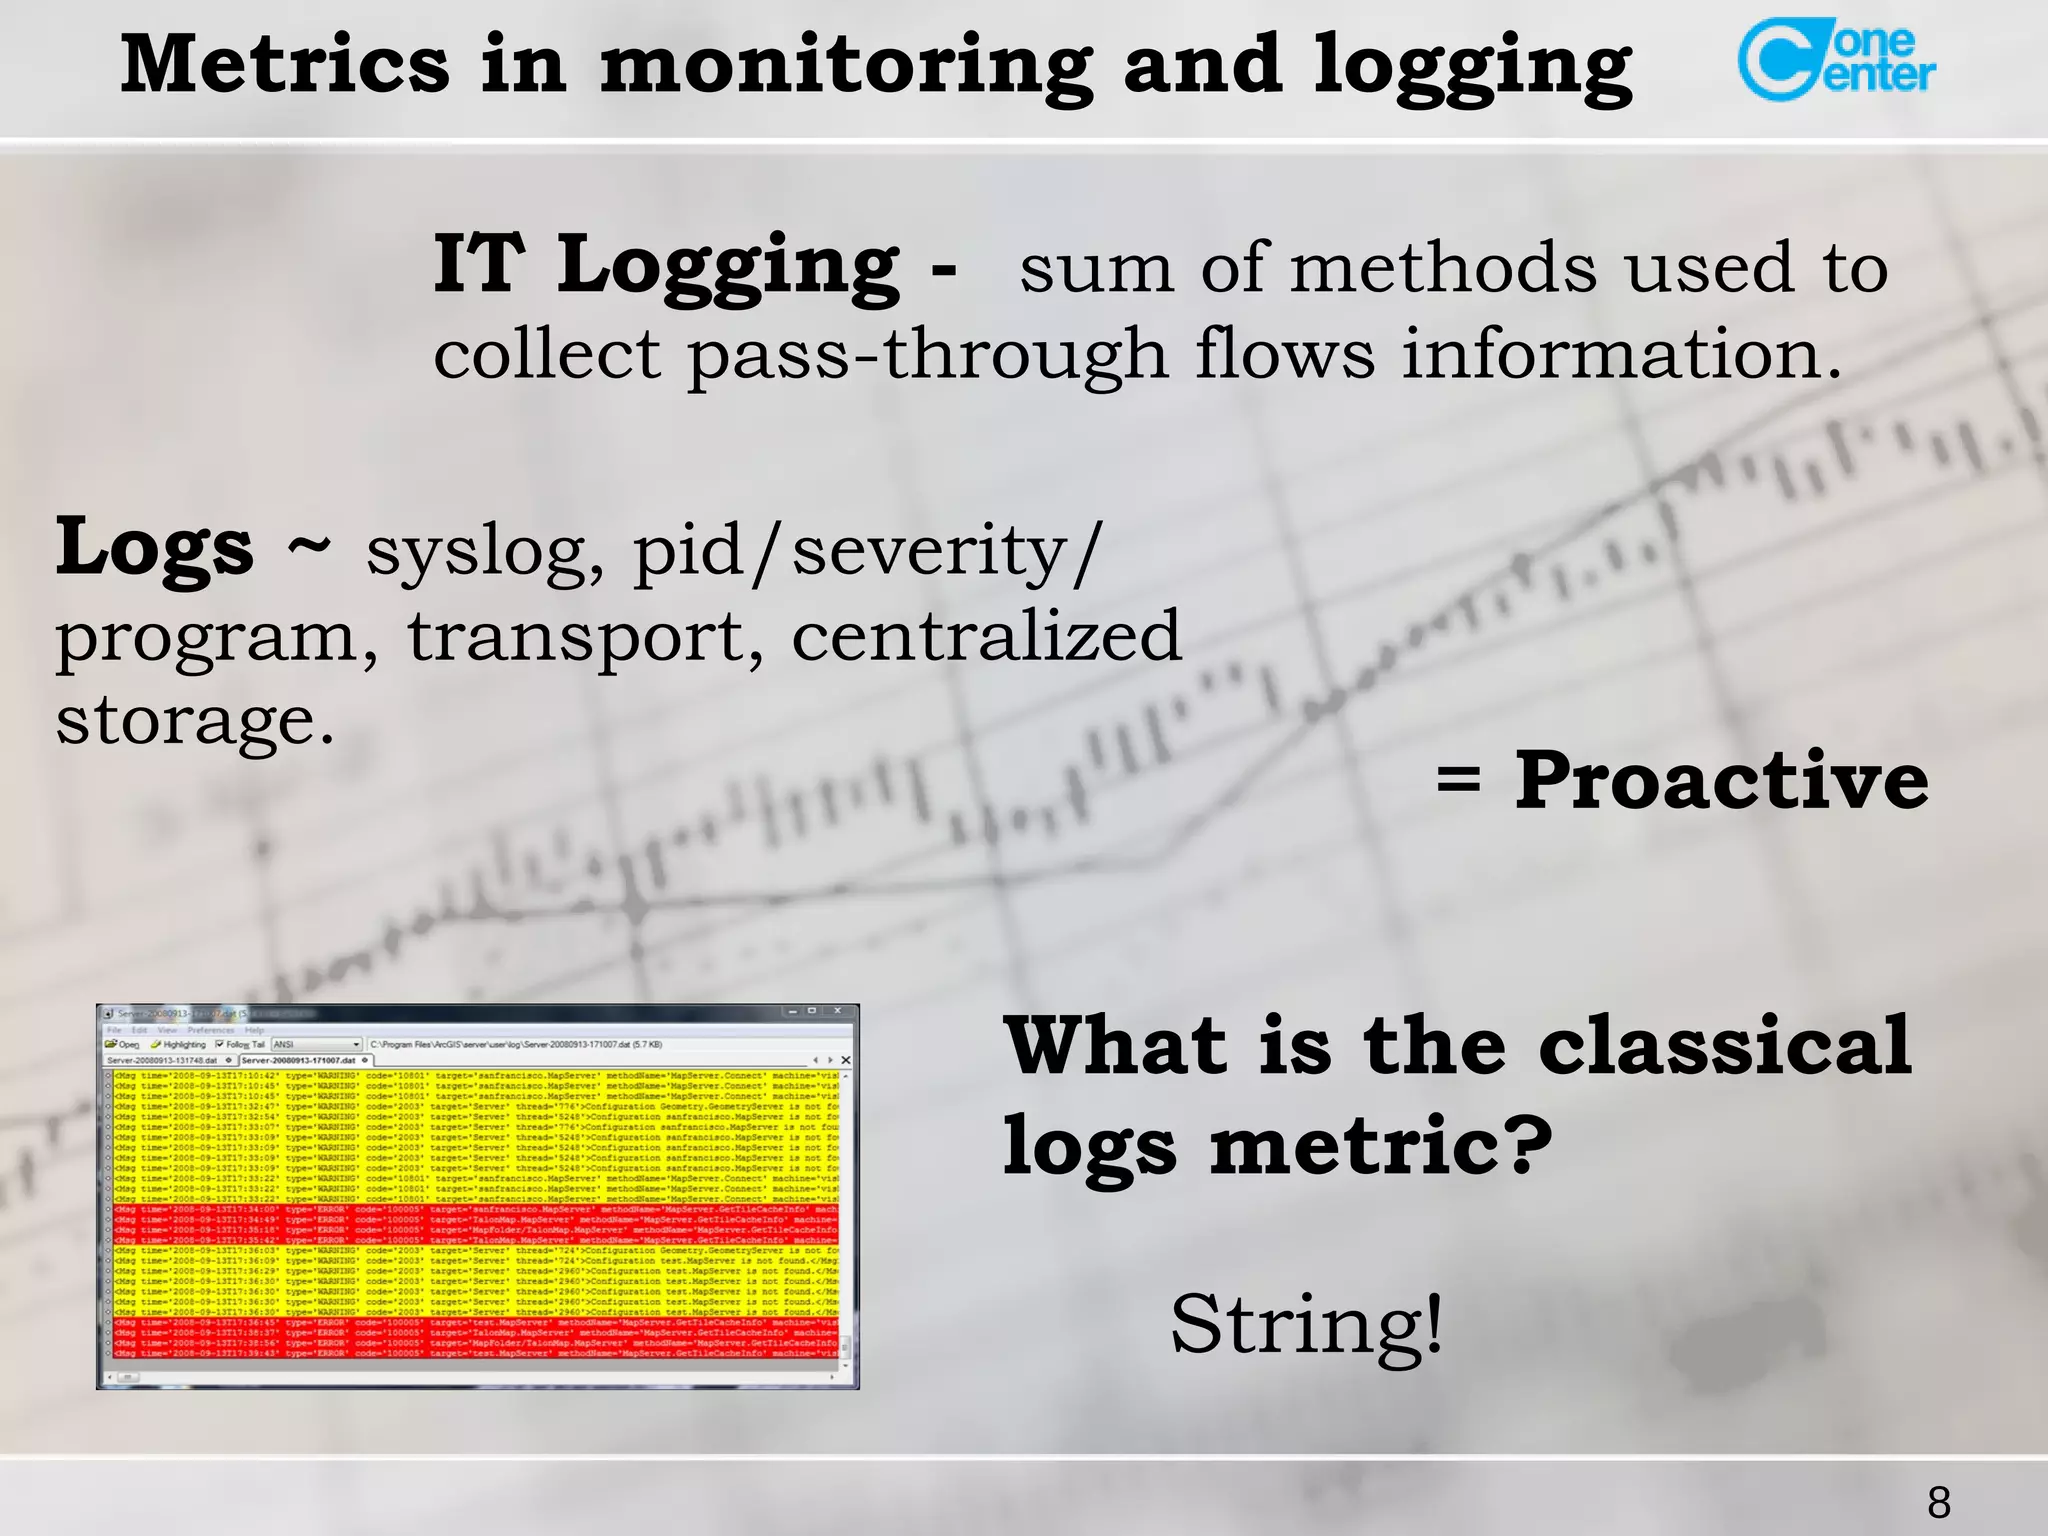
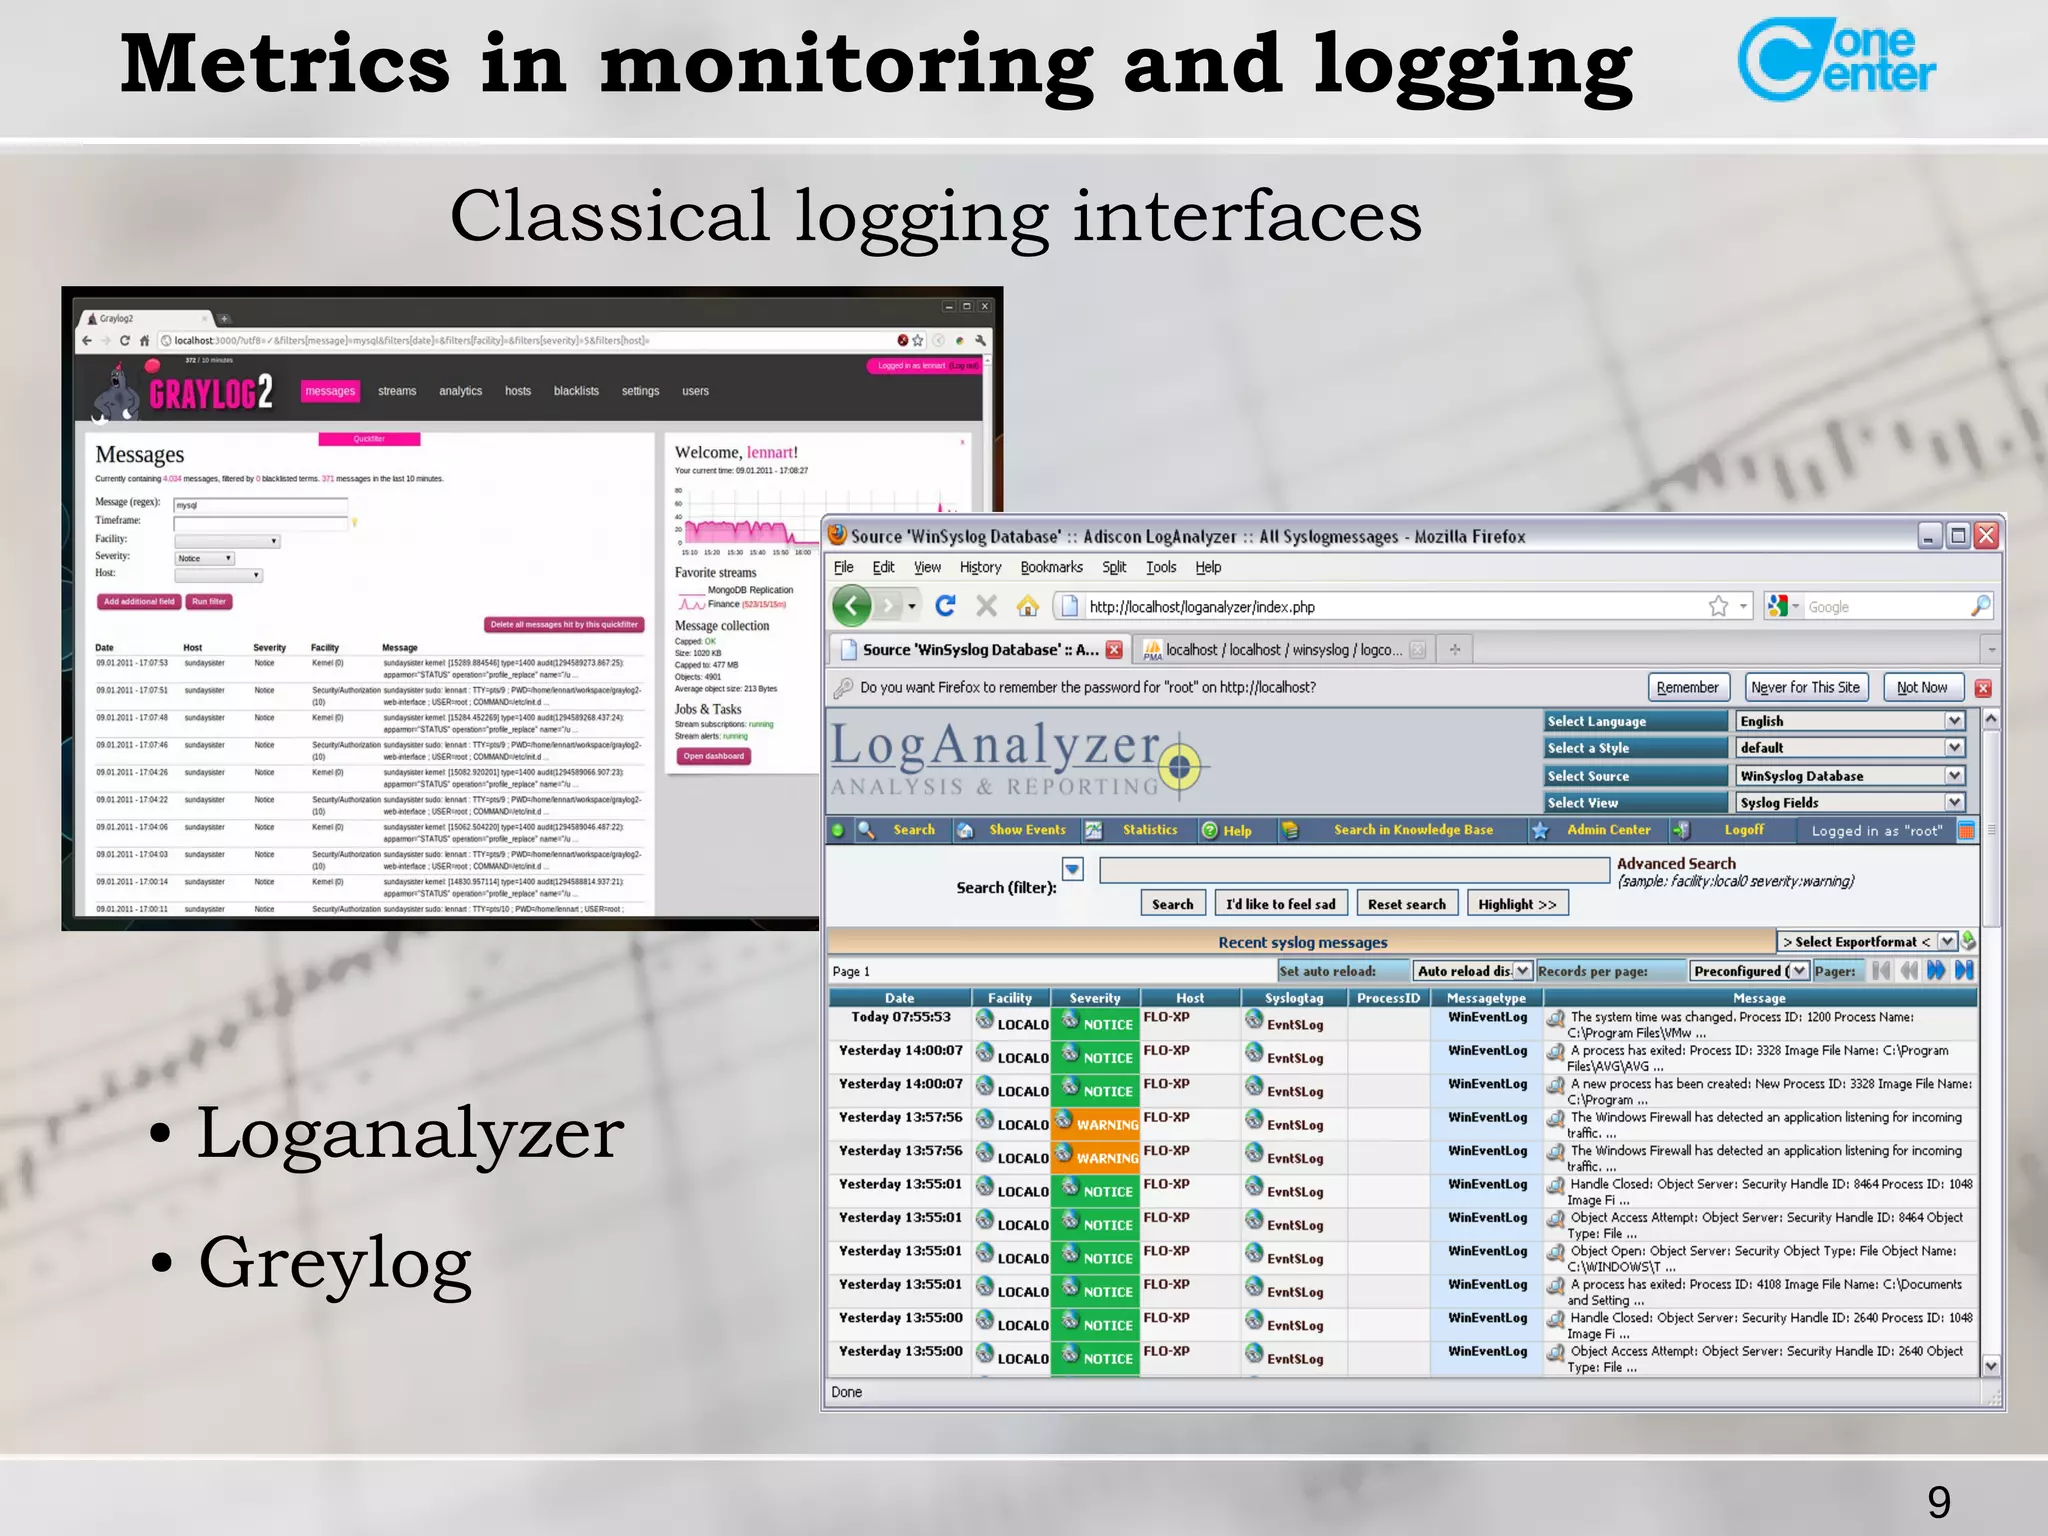
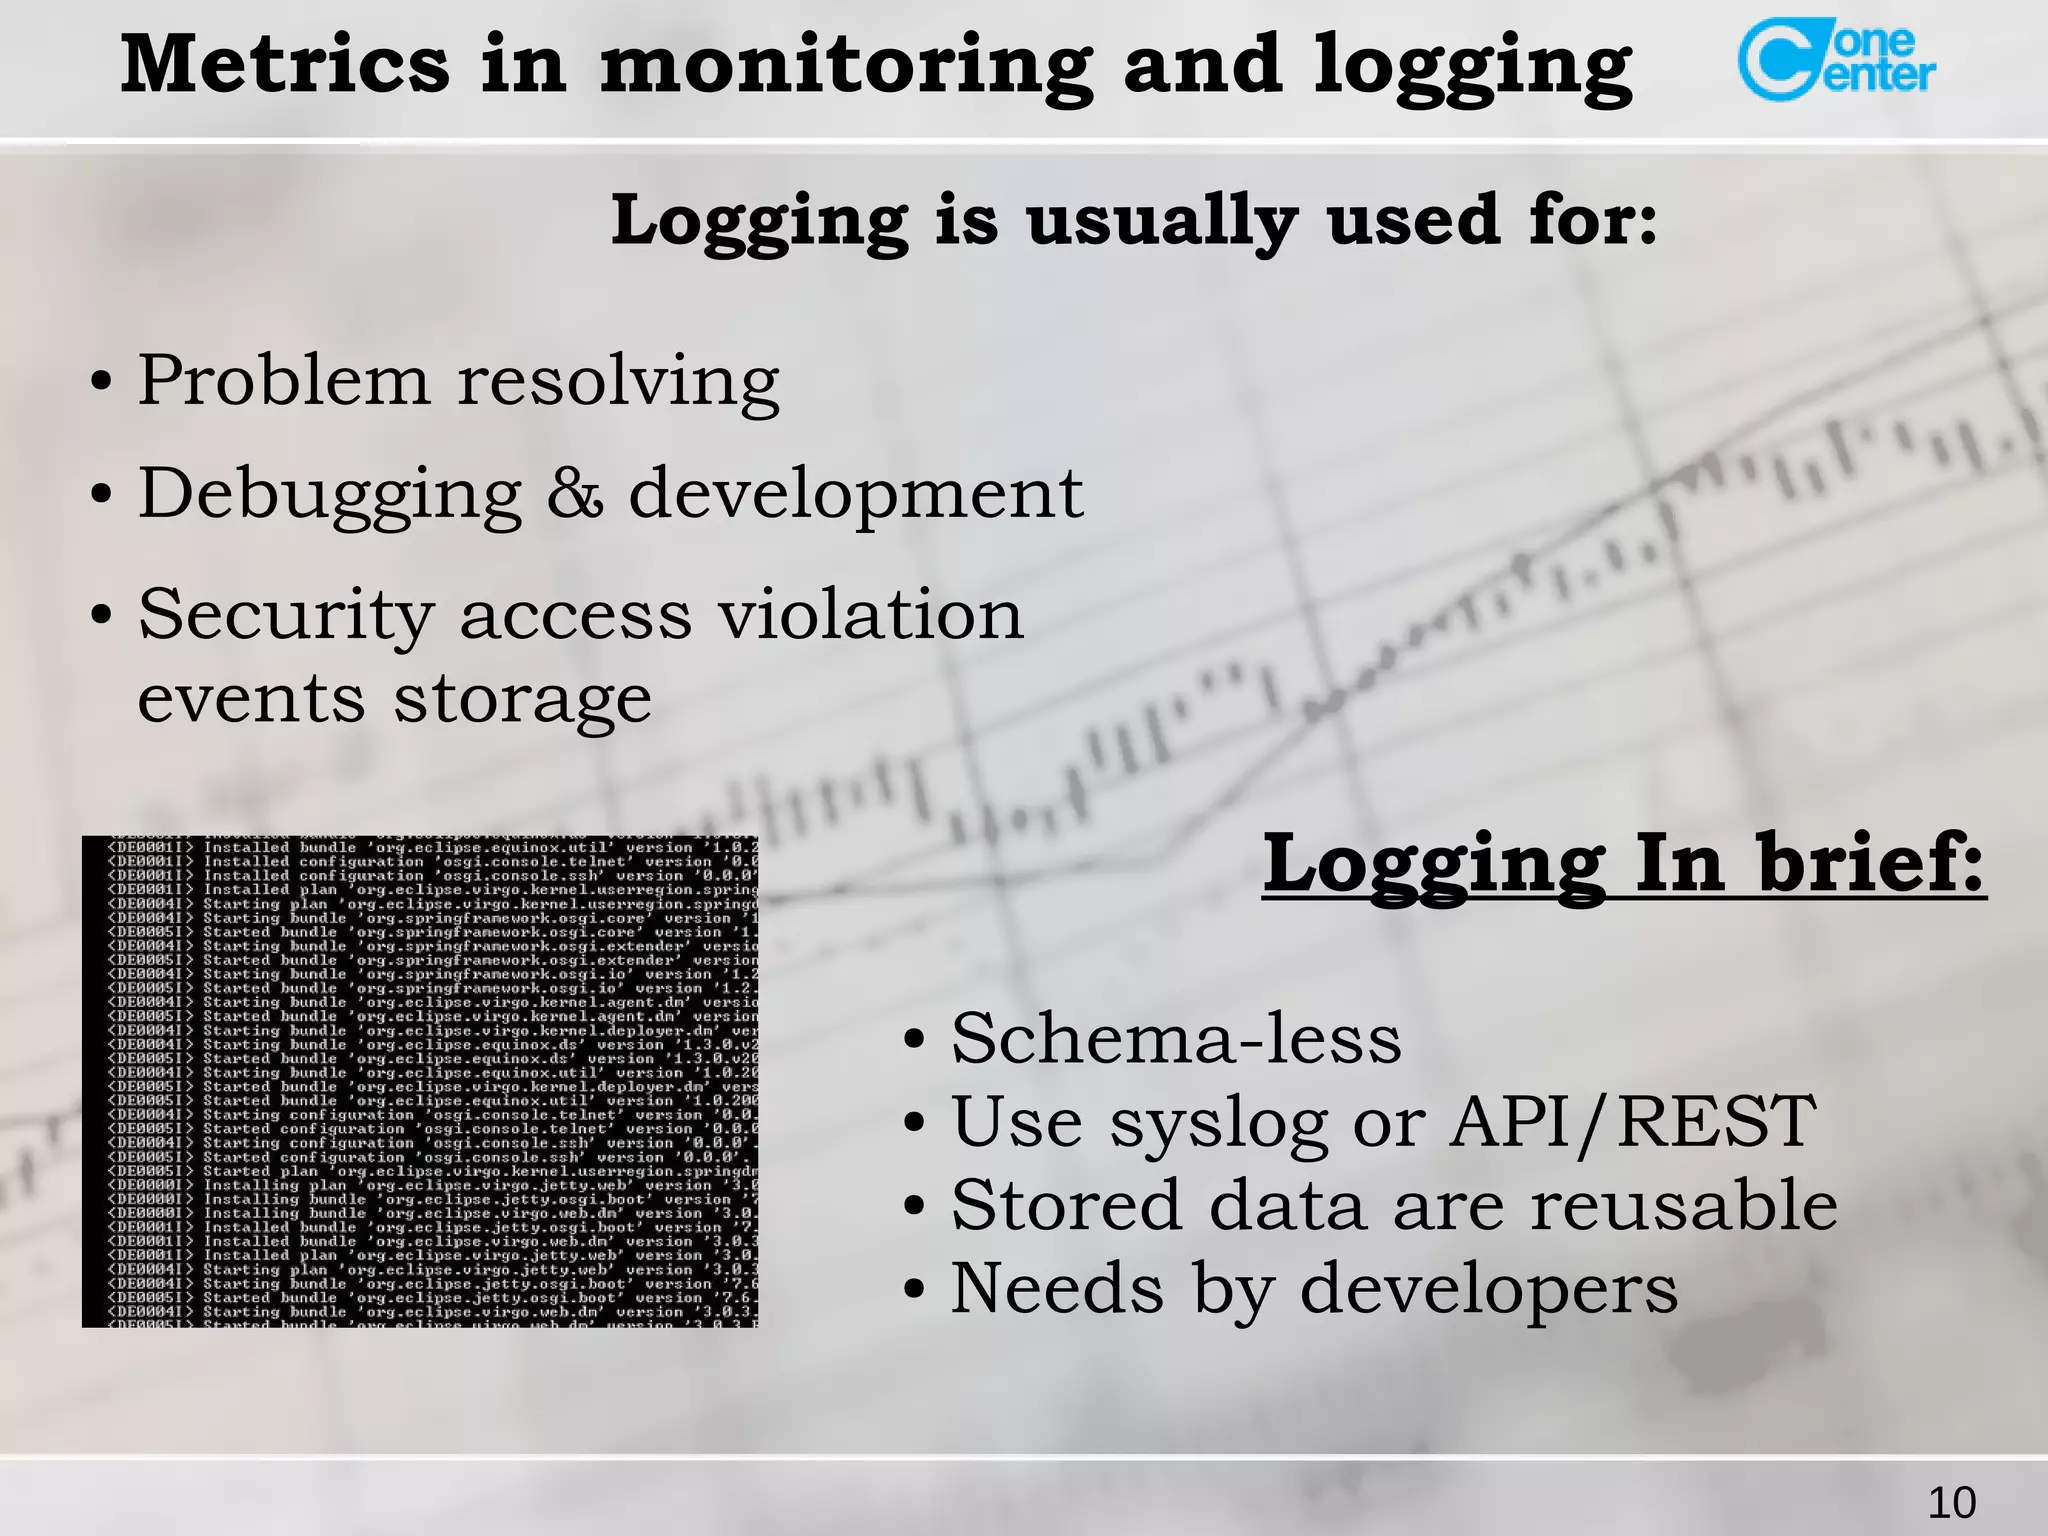
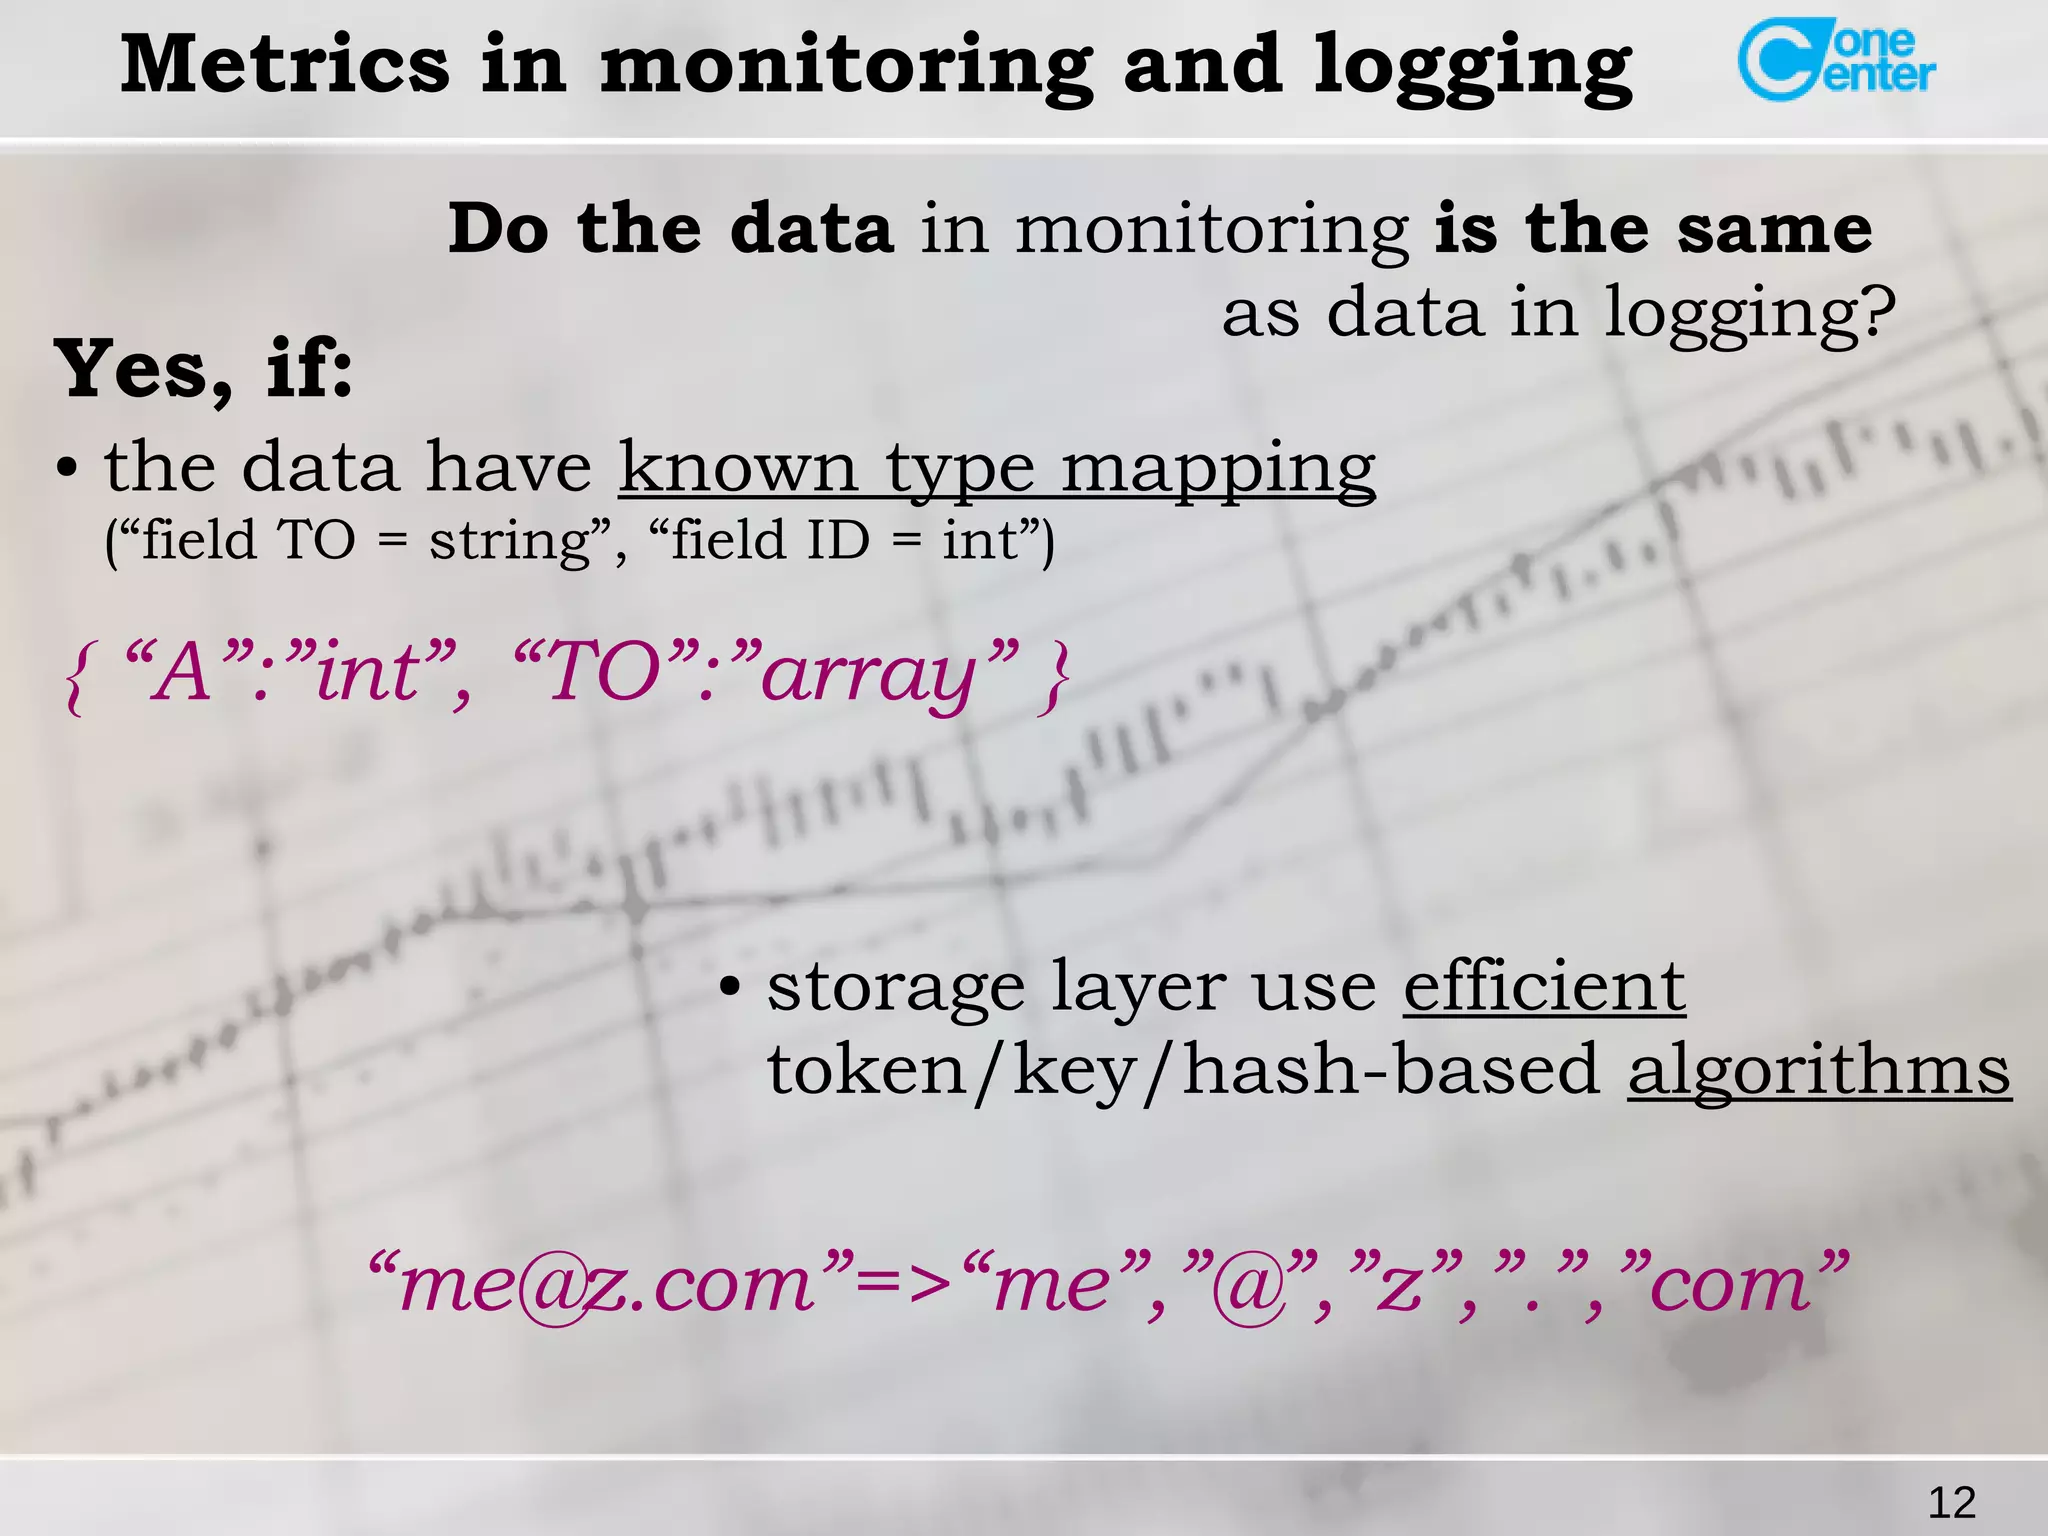
Metrics in monitoring and logging
Do the data in monitoring is the same
as data in logging? Yes, if:
● the data is well tokenized (known keys)
A=2, TO=me@z.com...
● the data have a common syntax
(JSON/CSV)
{ “A”:”2”, “TO”:[“me@z.com”,...] }](https://image.slidesharecdn.com/istomineugene-zabbix2014-140915152828-phpapp01/75/Logitoring-log-driven-monitoring-and-the-Rocket-science-11-2048.jpg)
![13
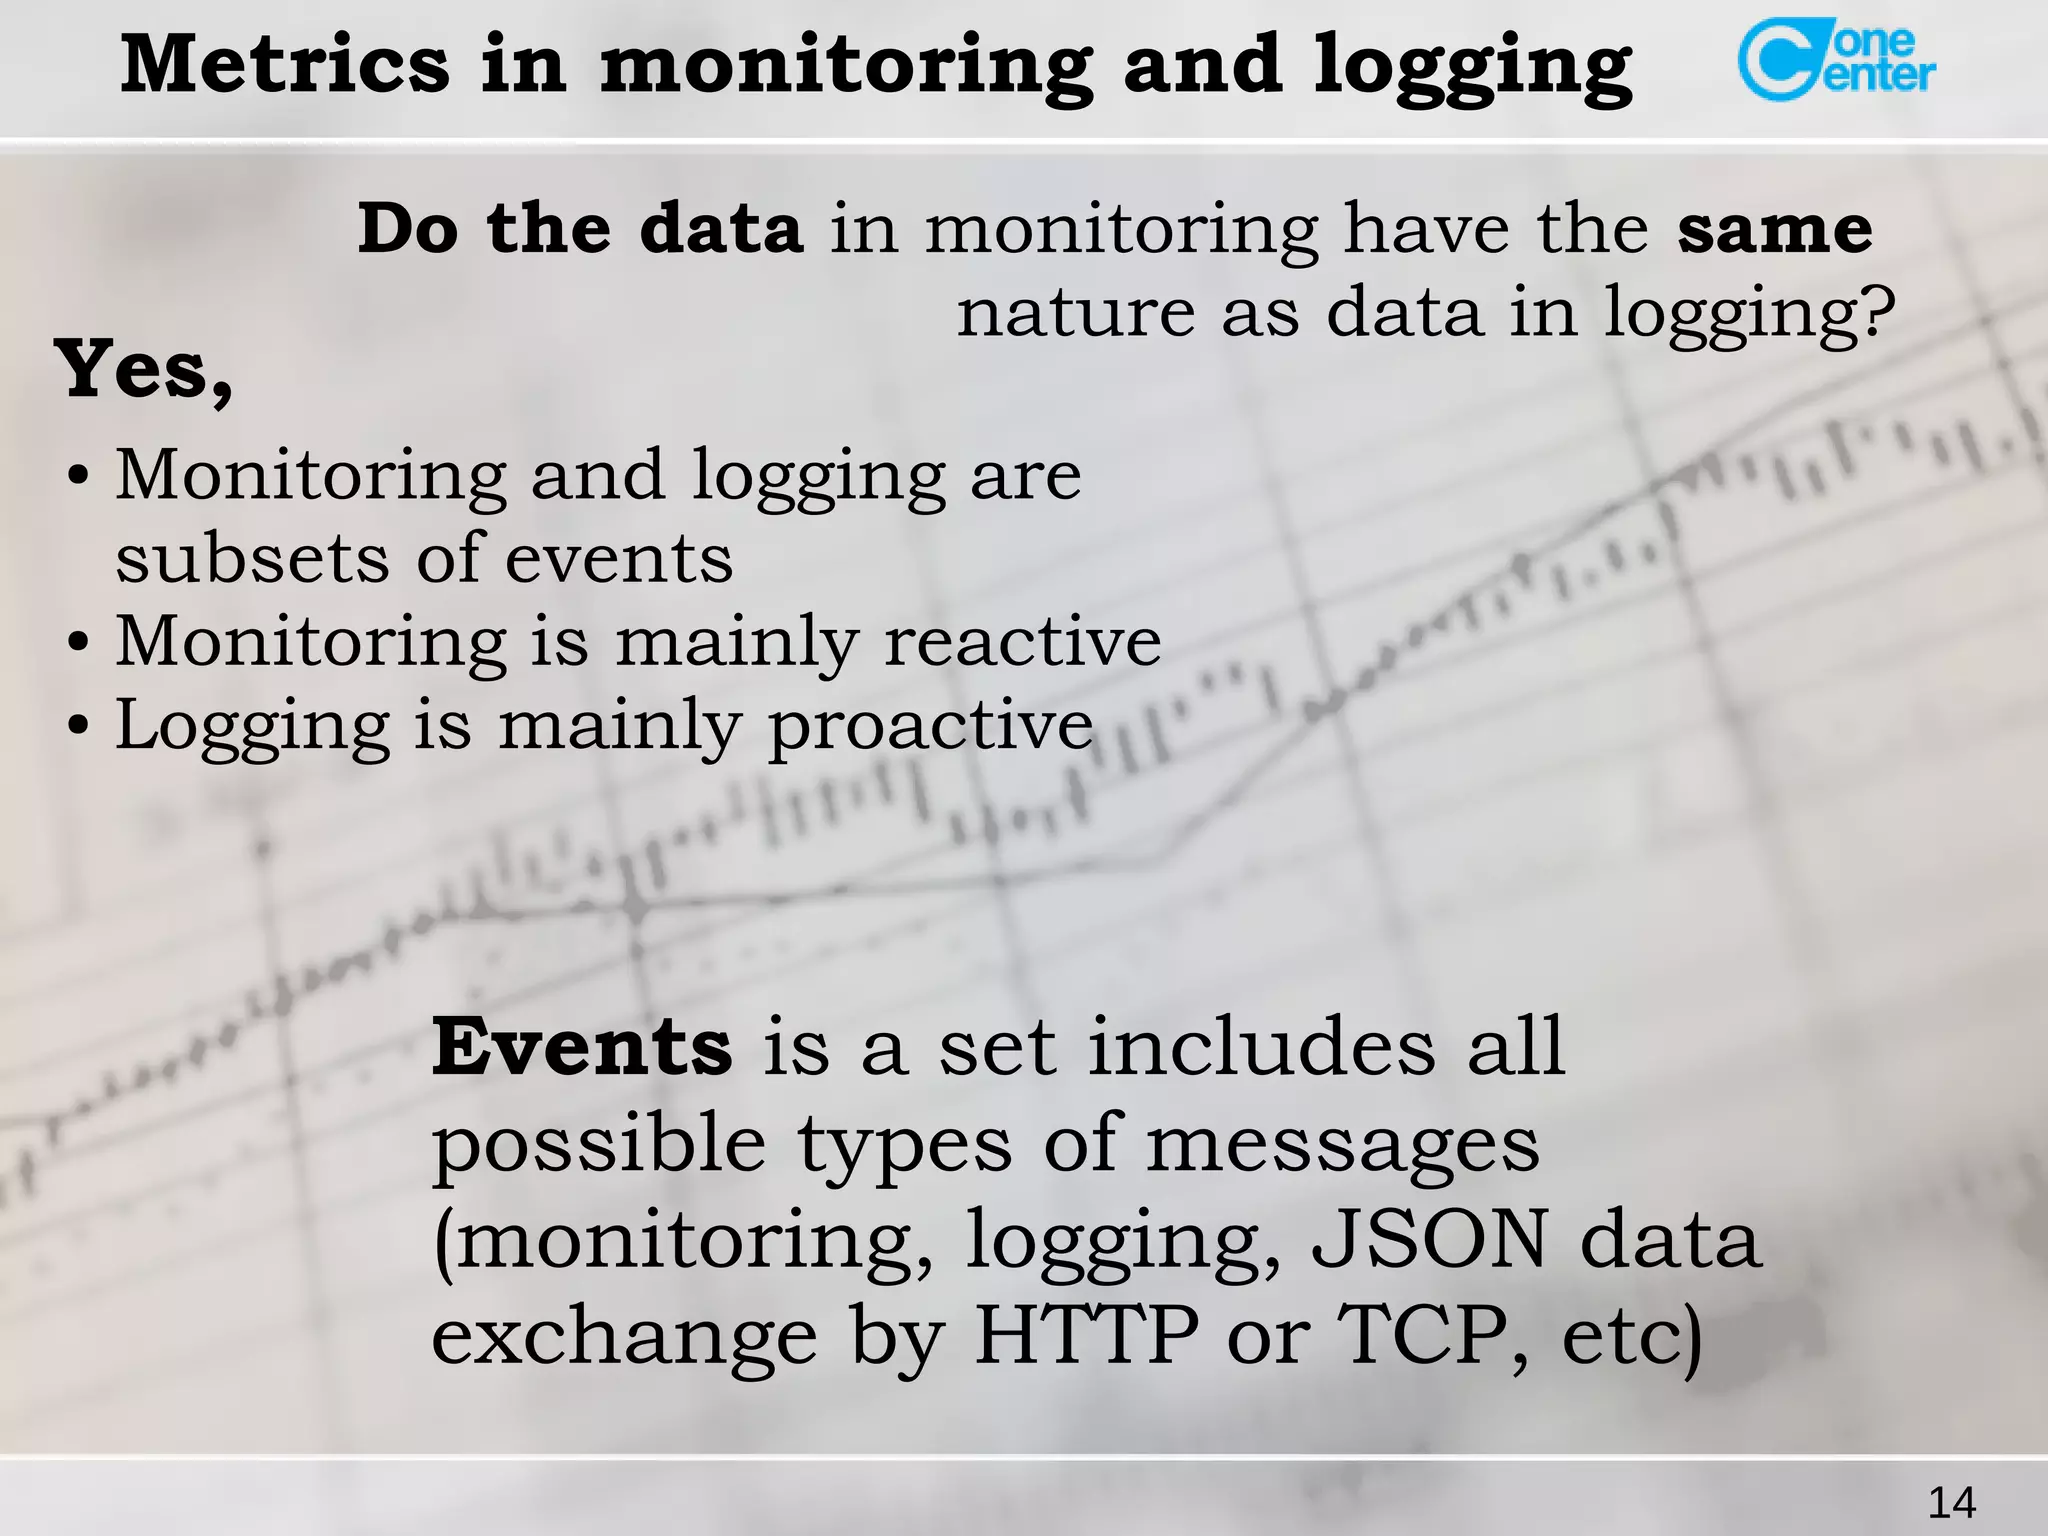
Metrics in monitoring and logging
Do the data in monitoring is the same
as data in logging? Yes, if:
● user UI/API can ask for mixed
fields content using complex
expressions
(regexp/ranges/sorts)
"query_string" : {
"fields" : ["TO.*"],
"query" : "a AND com OR z"
}](https://image.slidesharecdn.com/istomineugene-zabbix2014-140915152828-phpapp01/75/Logitoring-log-driven-monitoring-and-the-Rocket-science-13-2048.jpg)
![16
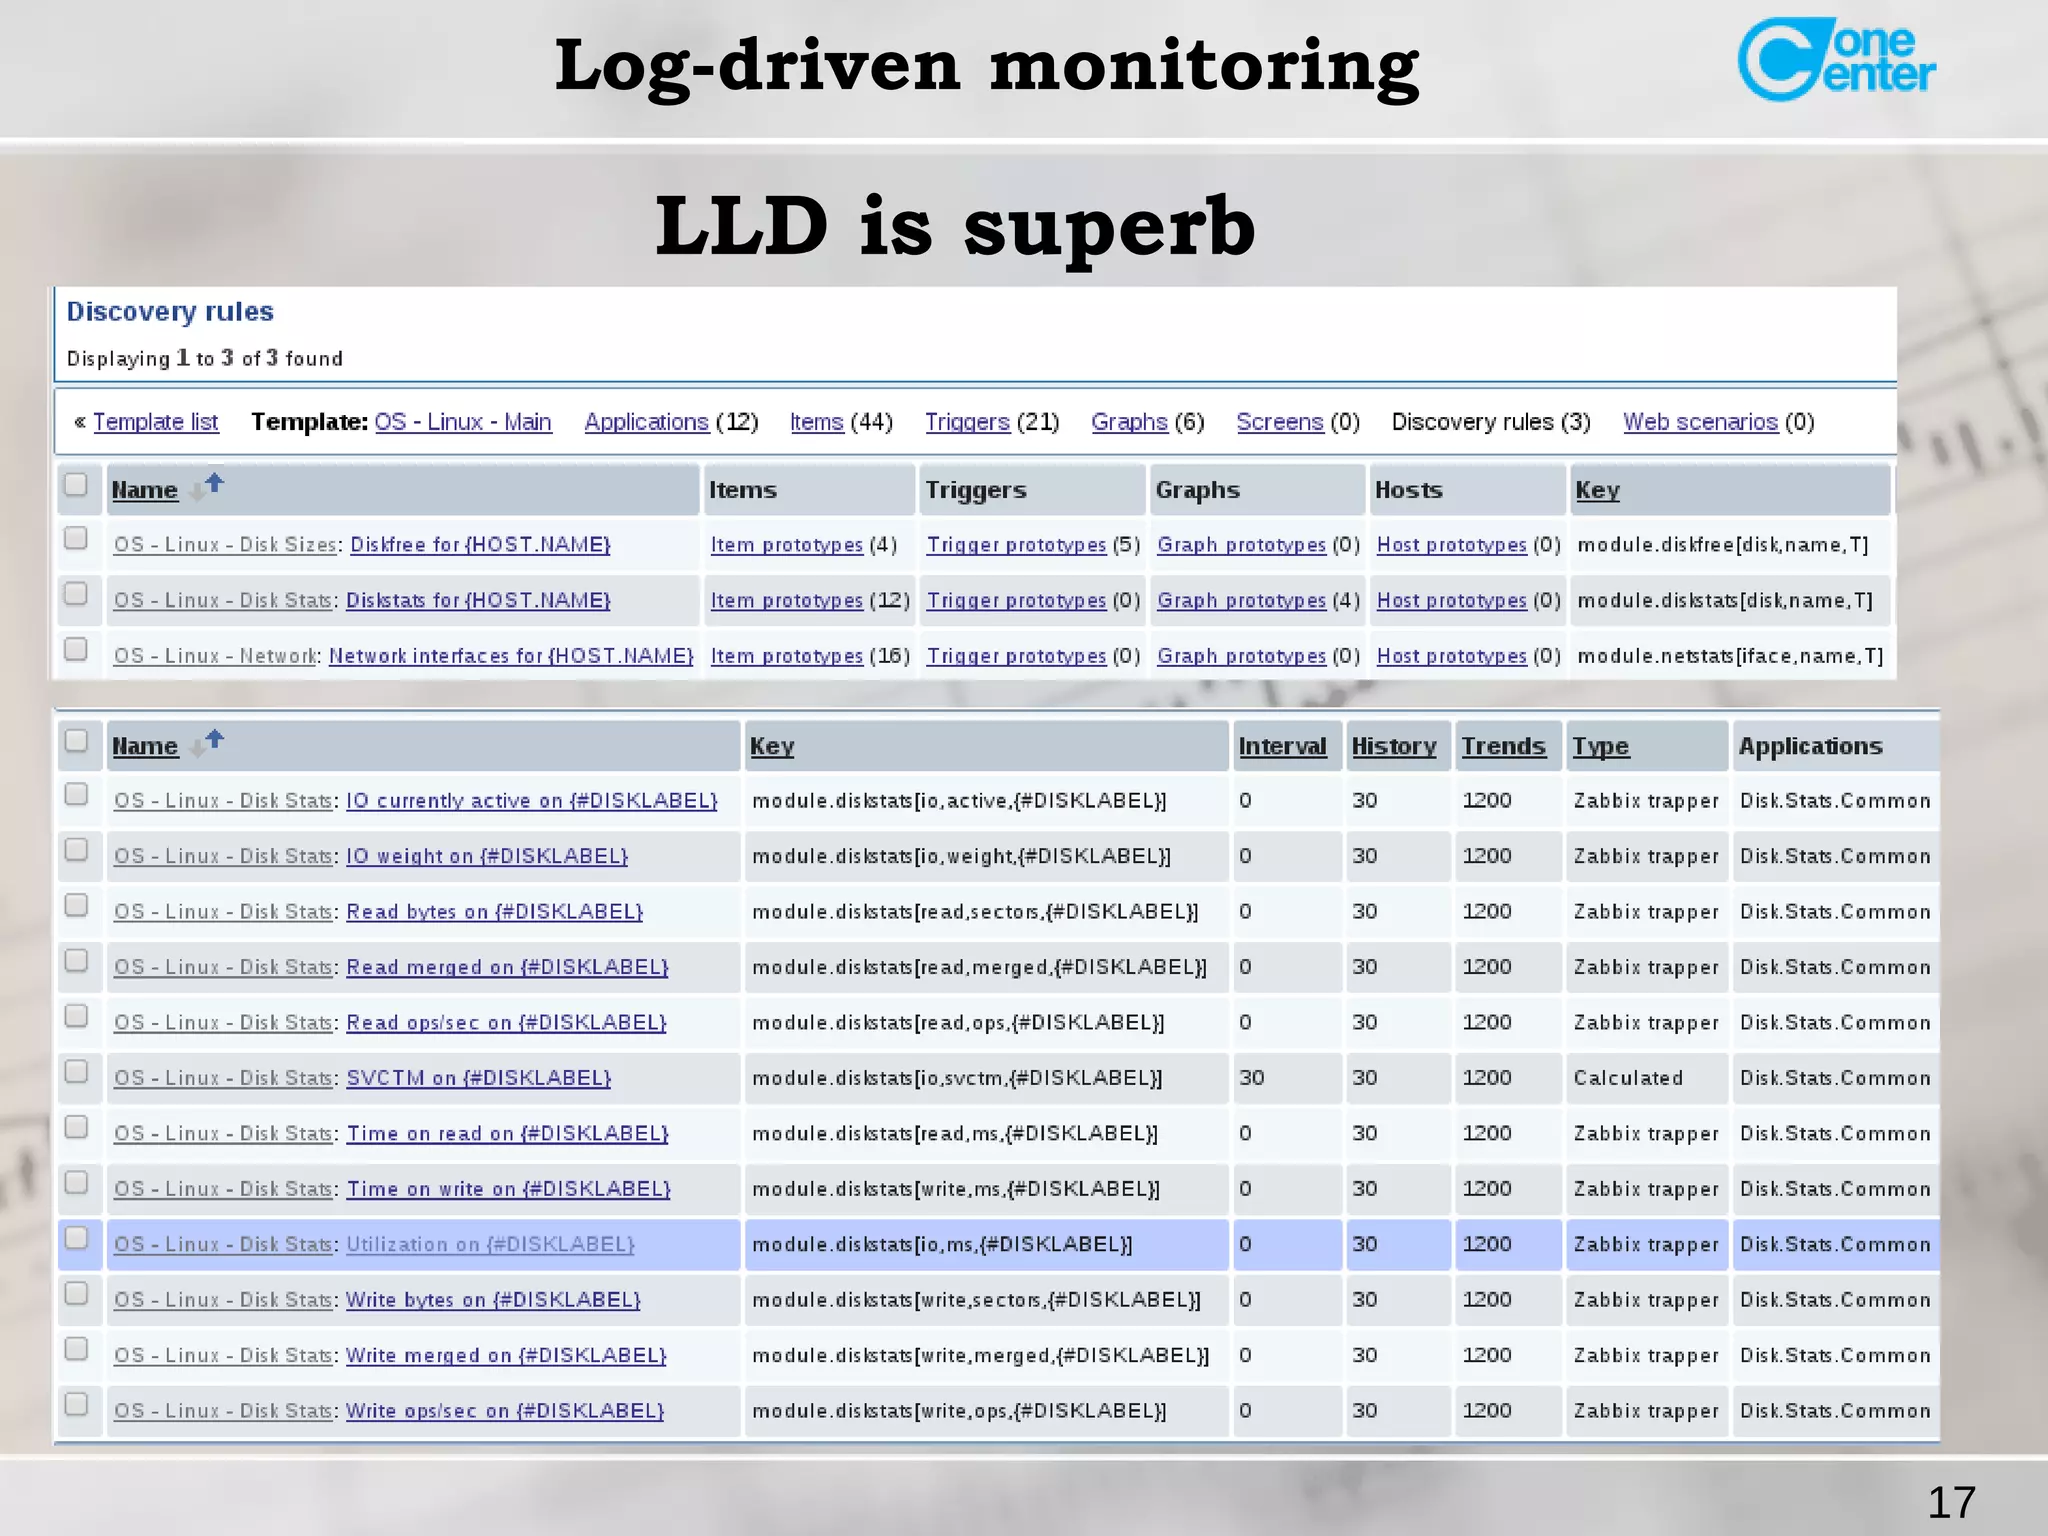
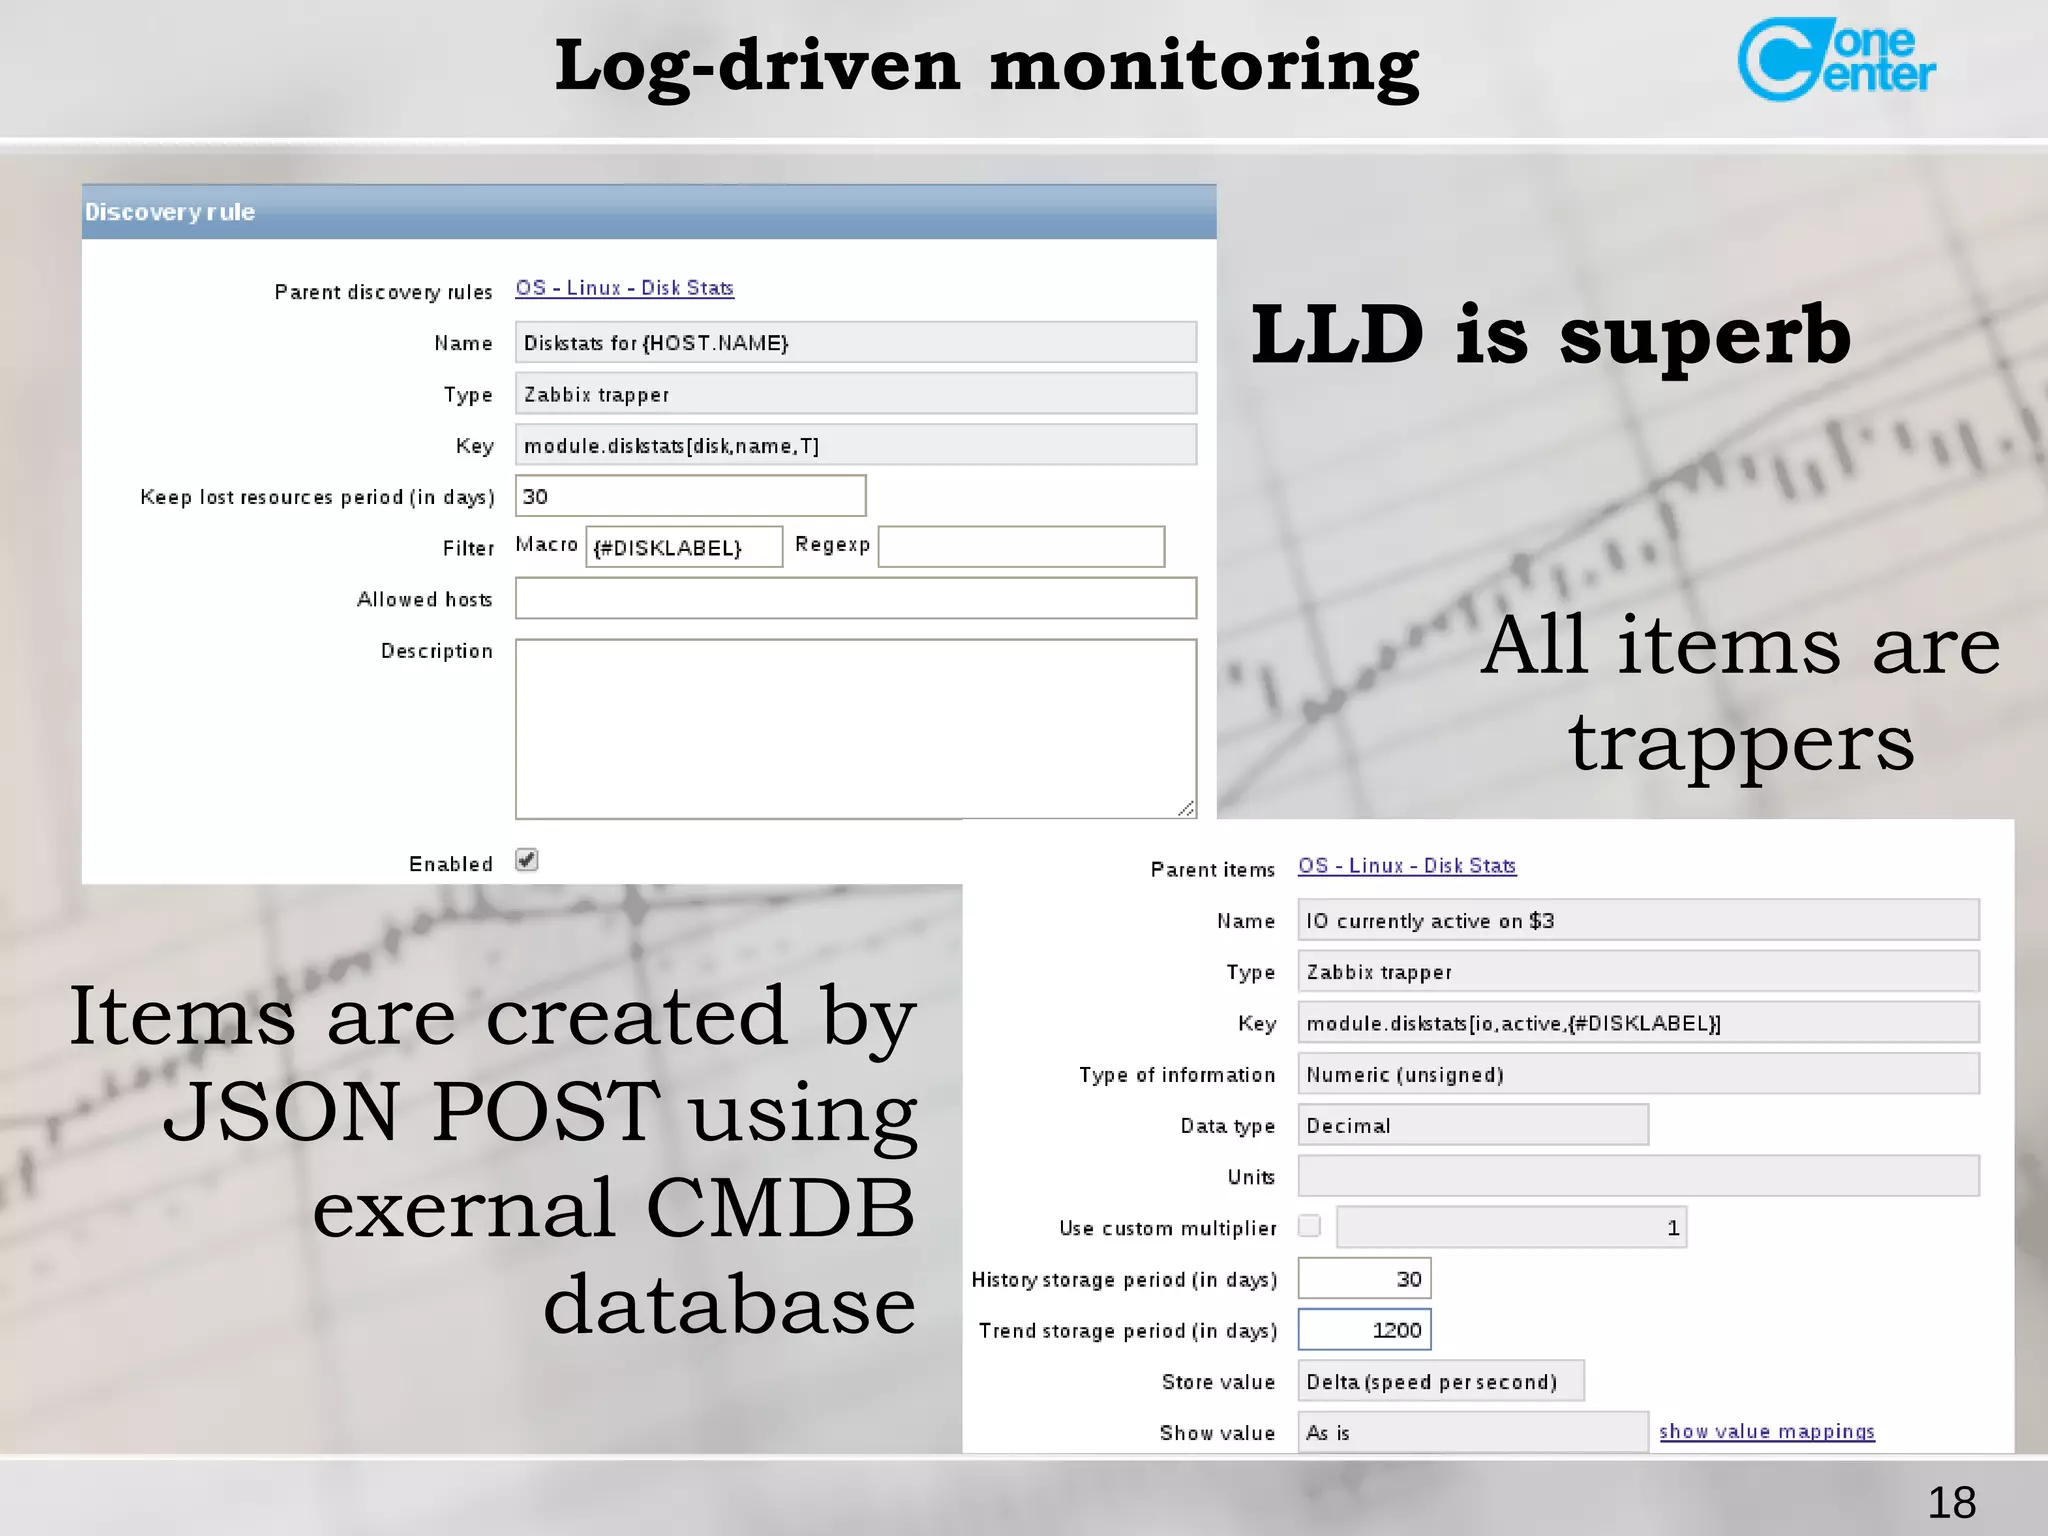
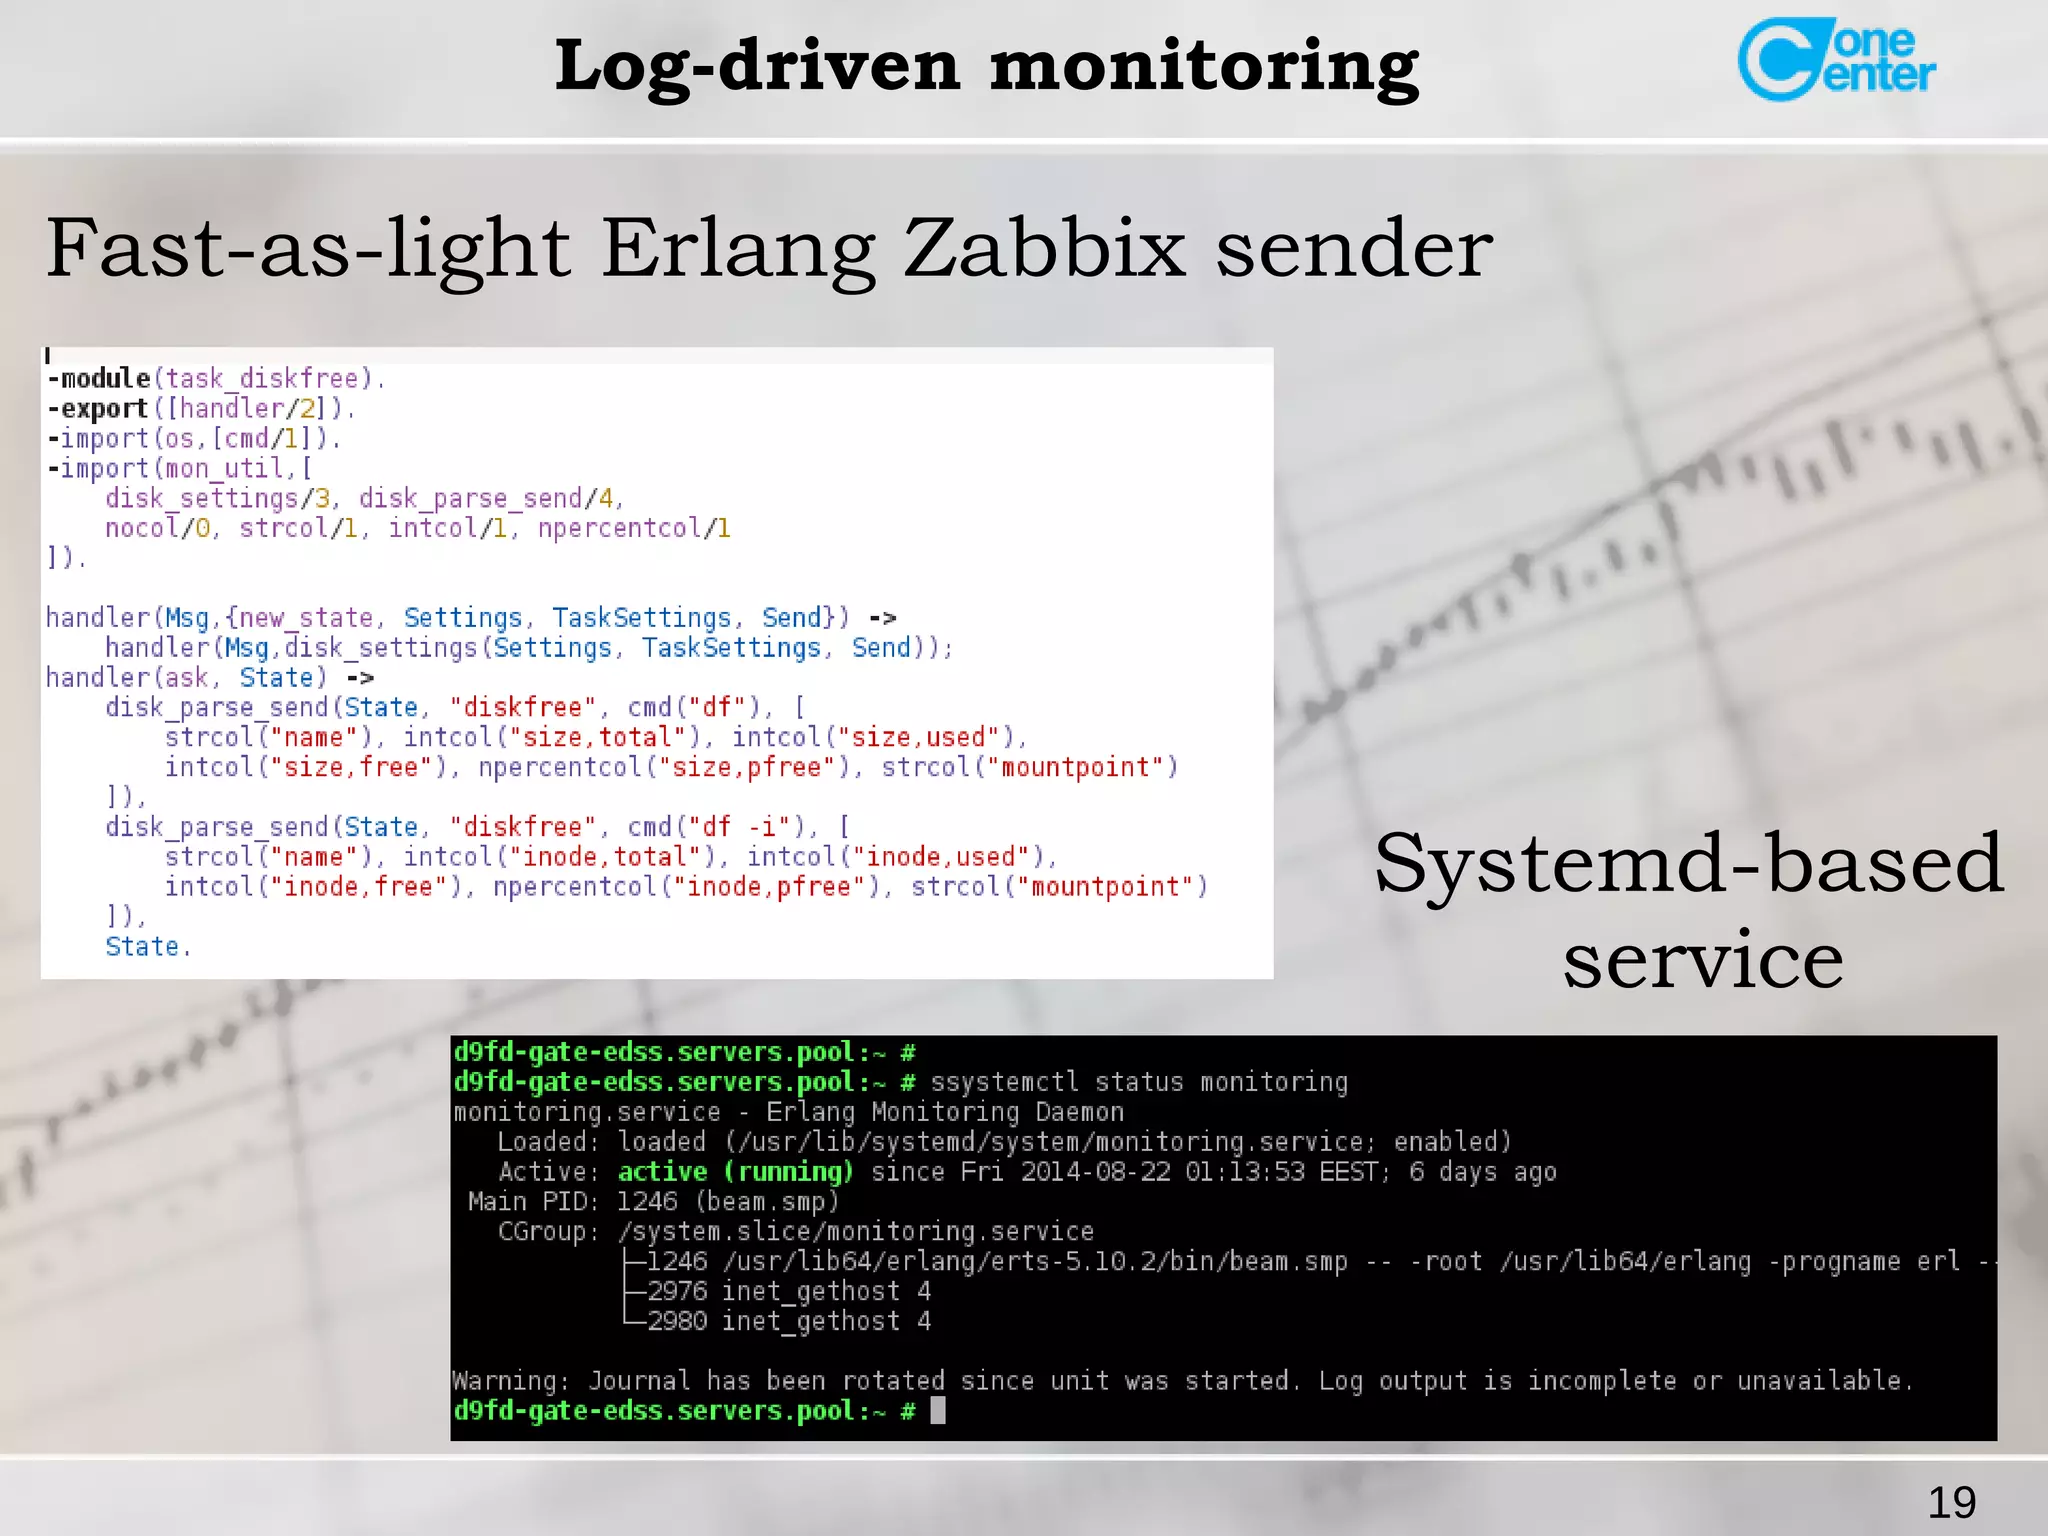
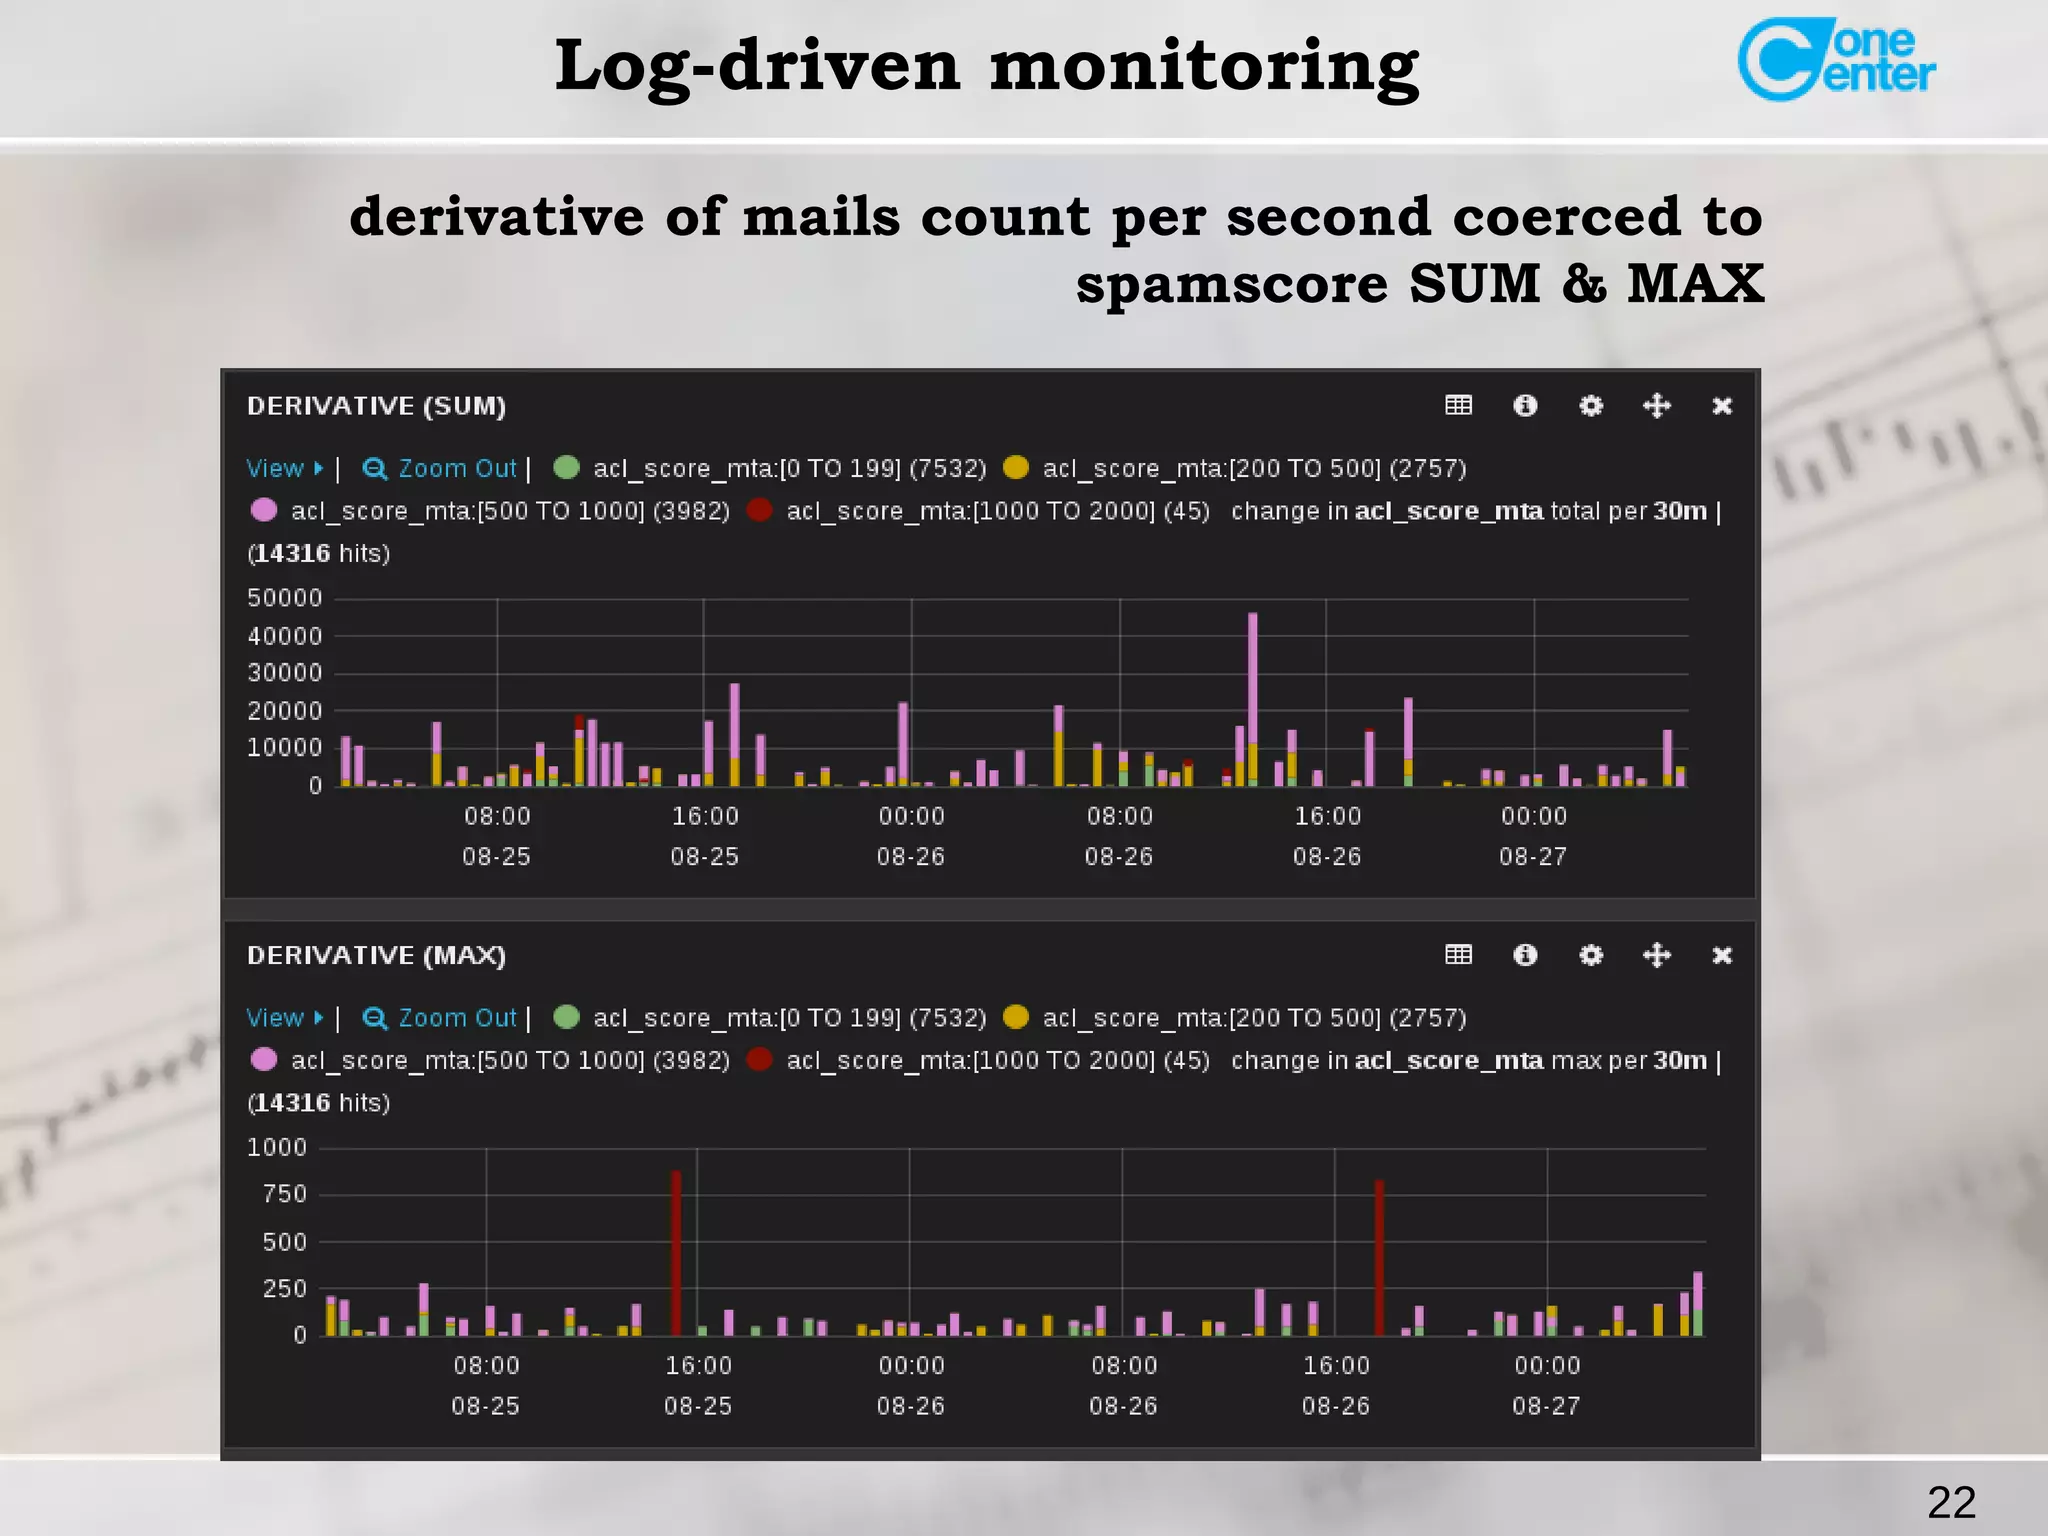
Log-driven monitoring
Log-driven monitoring -
a sum of techniques that provides
access to logs events fields from
high-level decision-maker
application using complex
expressions.
1. { haproxy_status=503},... { jmx_app1_status=500 }
2. "query_string" : {
"fields" : ["haproxy_status",”jmx_*_status”],
"query" : ">=500"
}
3. action → notify admins](https://image.slidesharecdn.com/istomineugene-zabbix2014-140915152828-phpapp01/75/Logitoring-log-driven-monitoring-and-the-Rocket-science-16-2048.jpg)

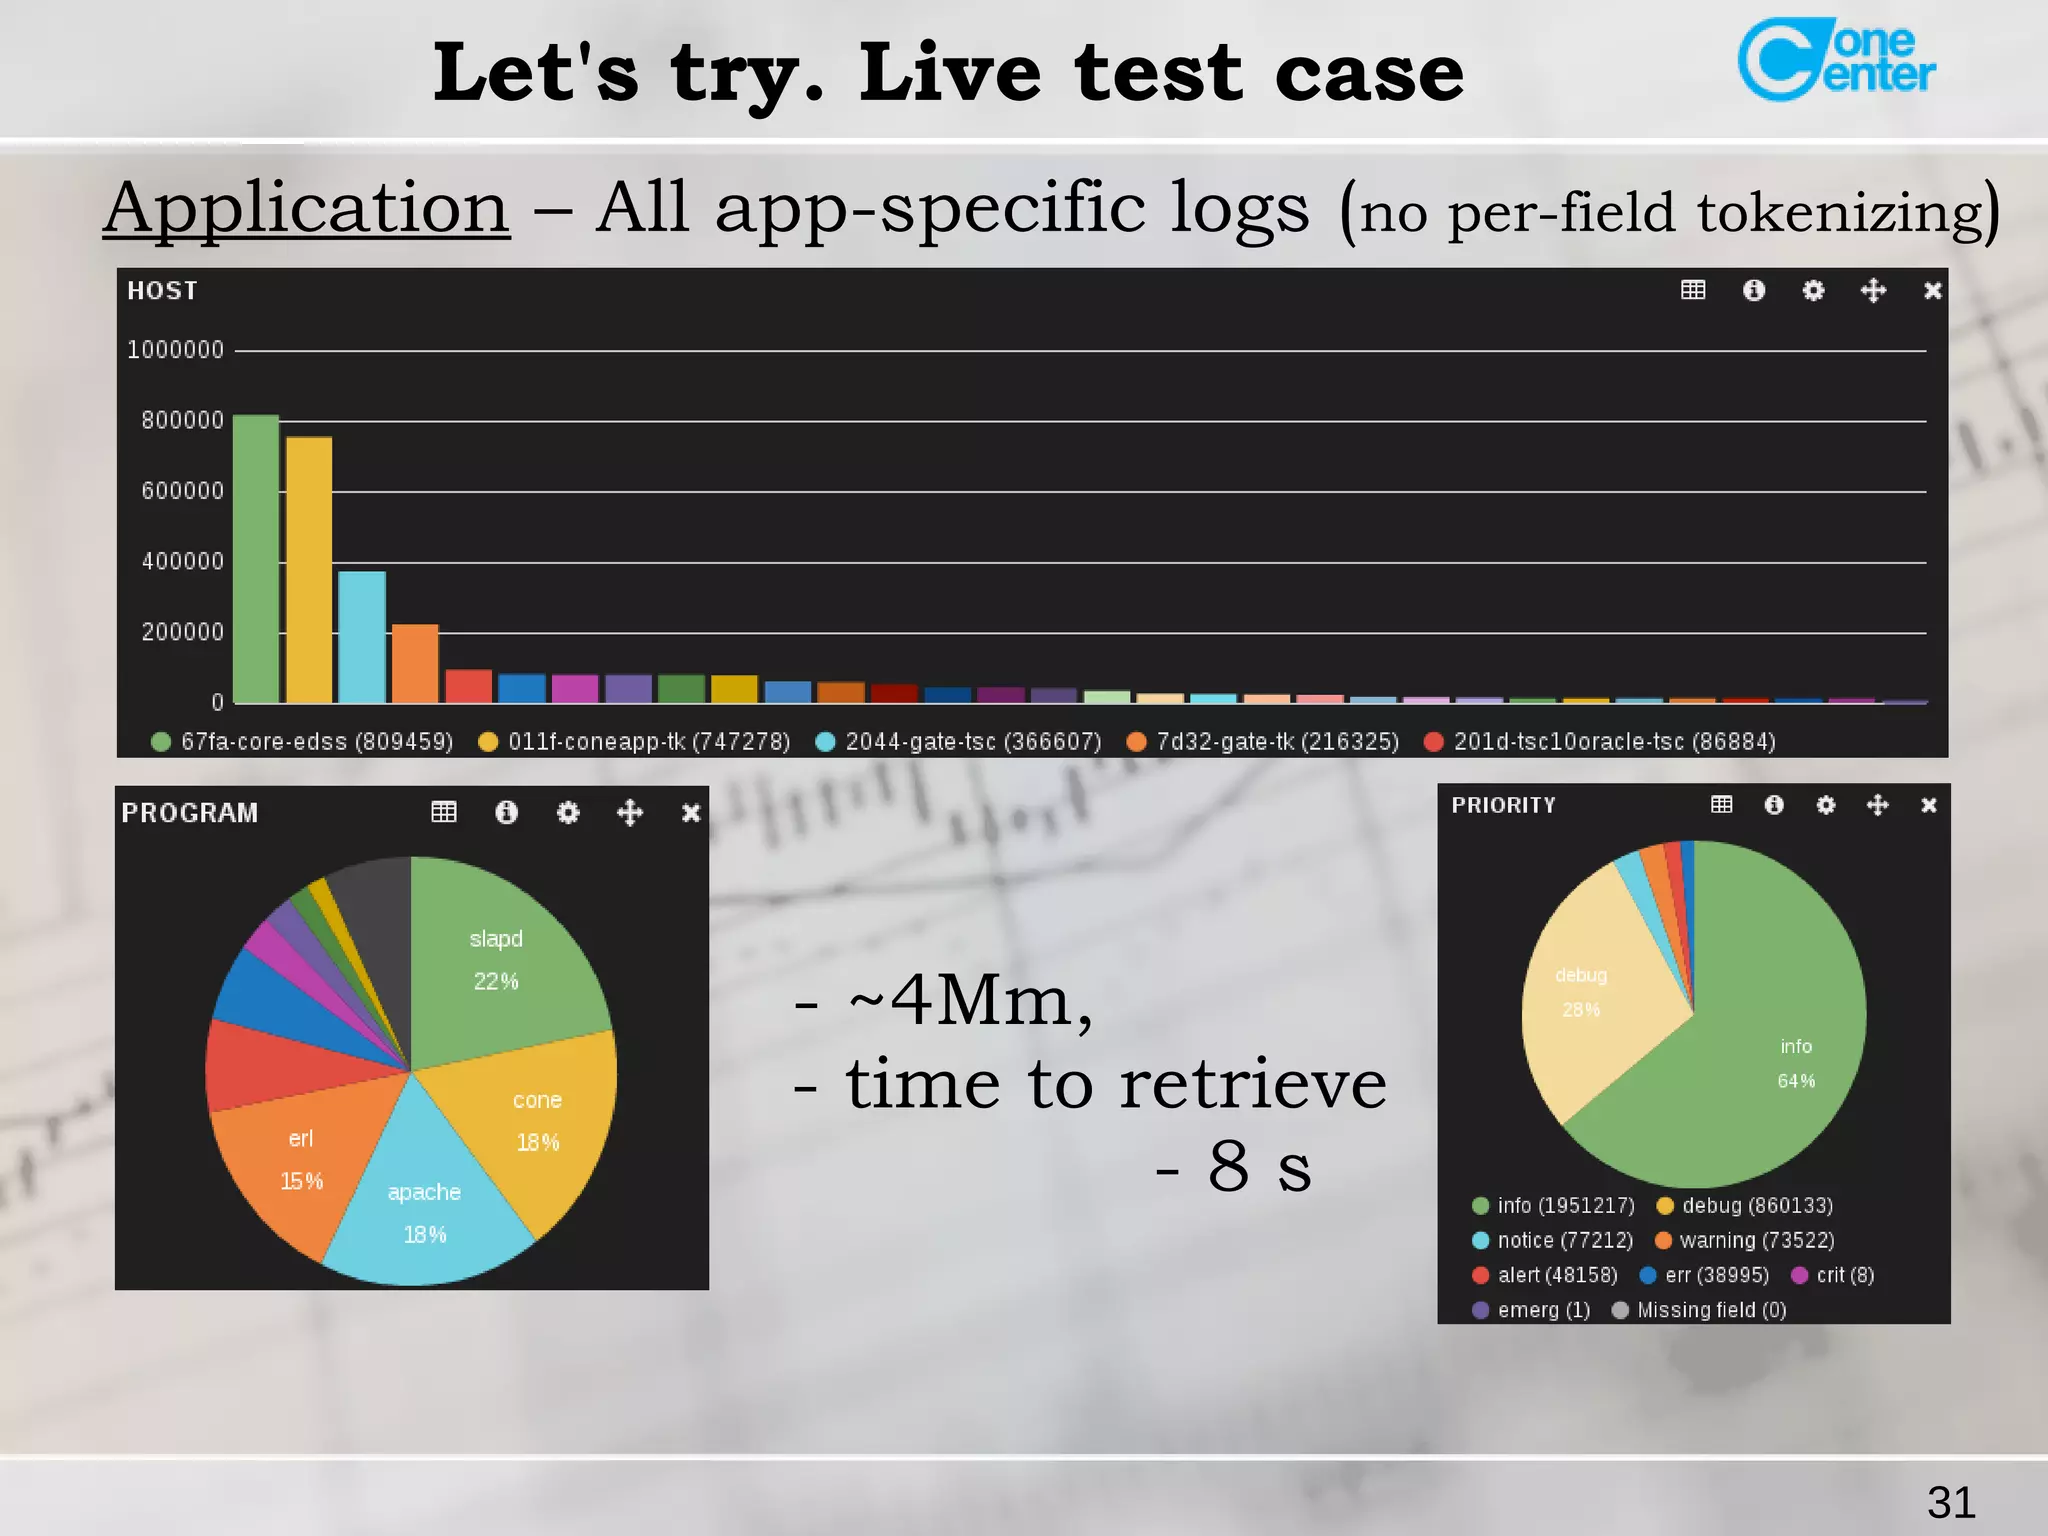


The document discusses the concept of log-driven monitoring, emphasizing its role in delivering, storing, and analyzing monitoring, logging, and trace data flows. It compares monitoring and logging methods, their respective metrics, and their use cases, while introducing the rsyslog event transport system. Additionally, it outlines specific live test cases related to email and traffic logging, showcasing performance metrics for various applications.


![Number_Guessing_Game_Dsbsbssbzboc[1].pptx](https://cdn.slidesharecdn.com/ss_thumbnails/numberguessinggamedoc1-251206215042-a076fc05-thumbnail.jpg?width=640&height=640&fit=bounds)


