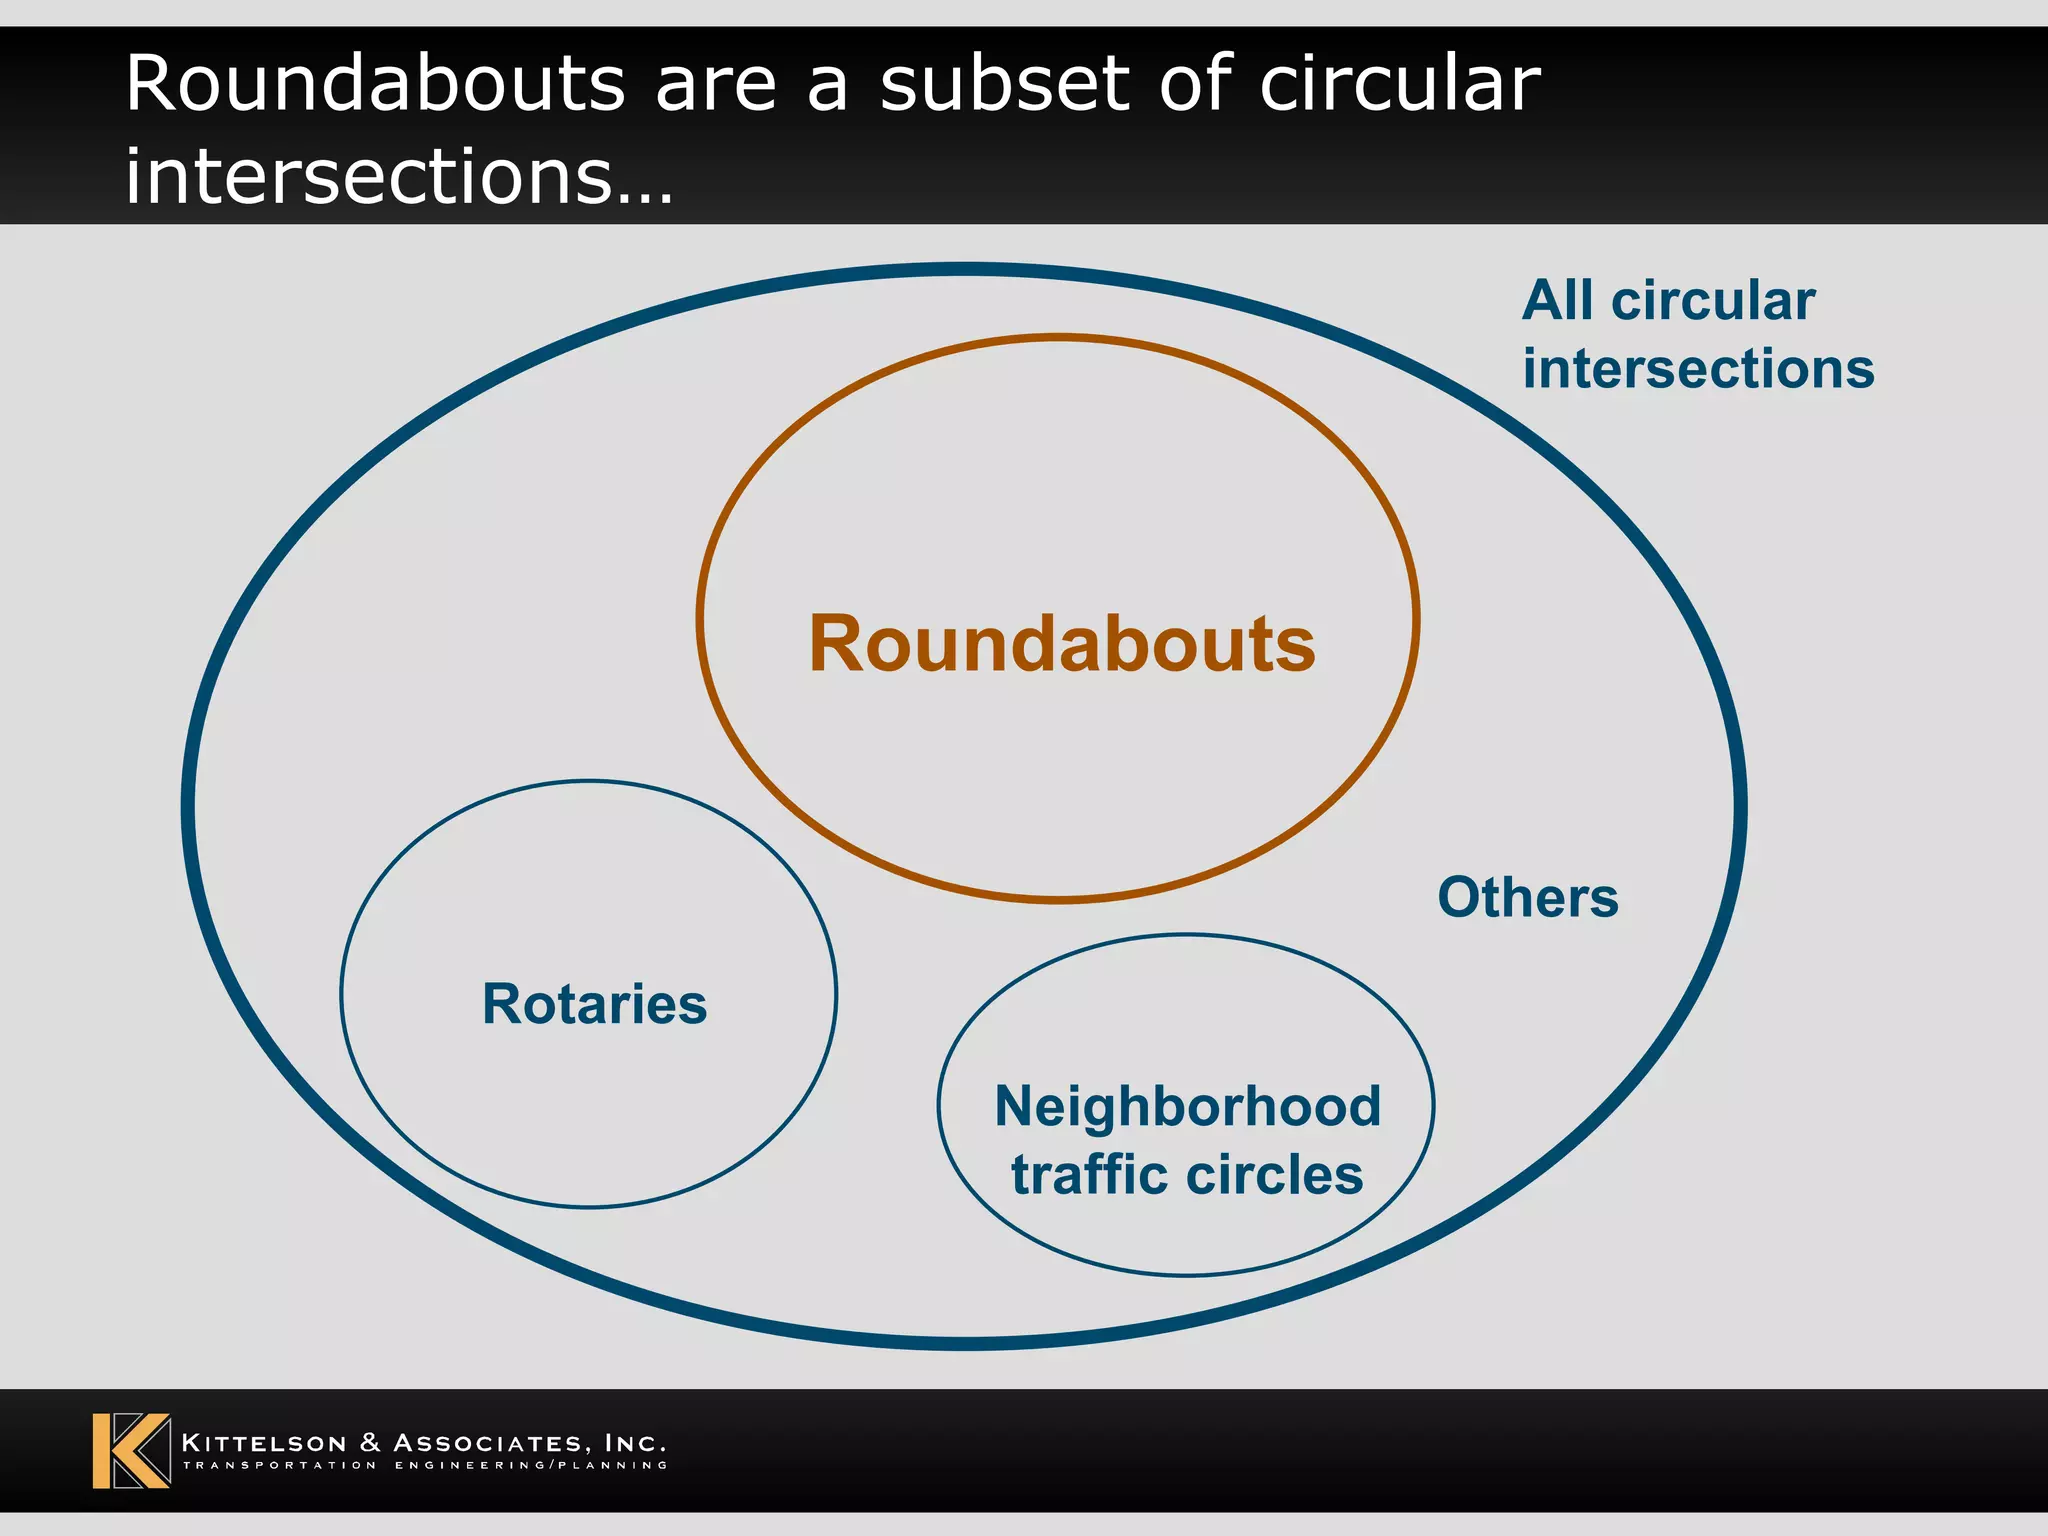
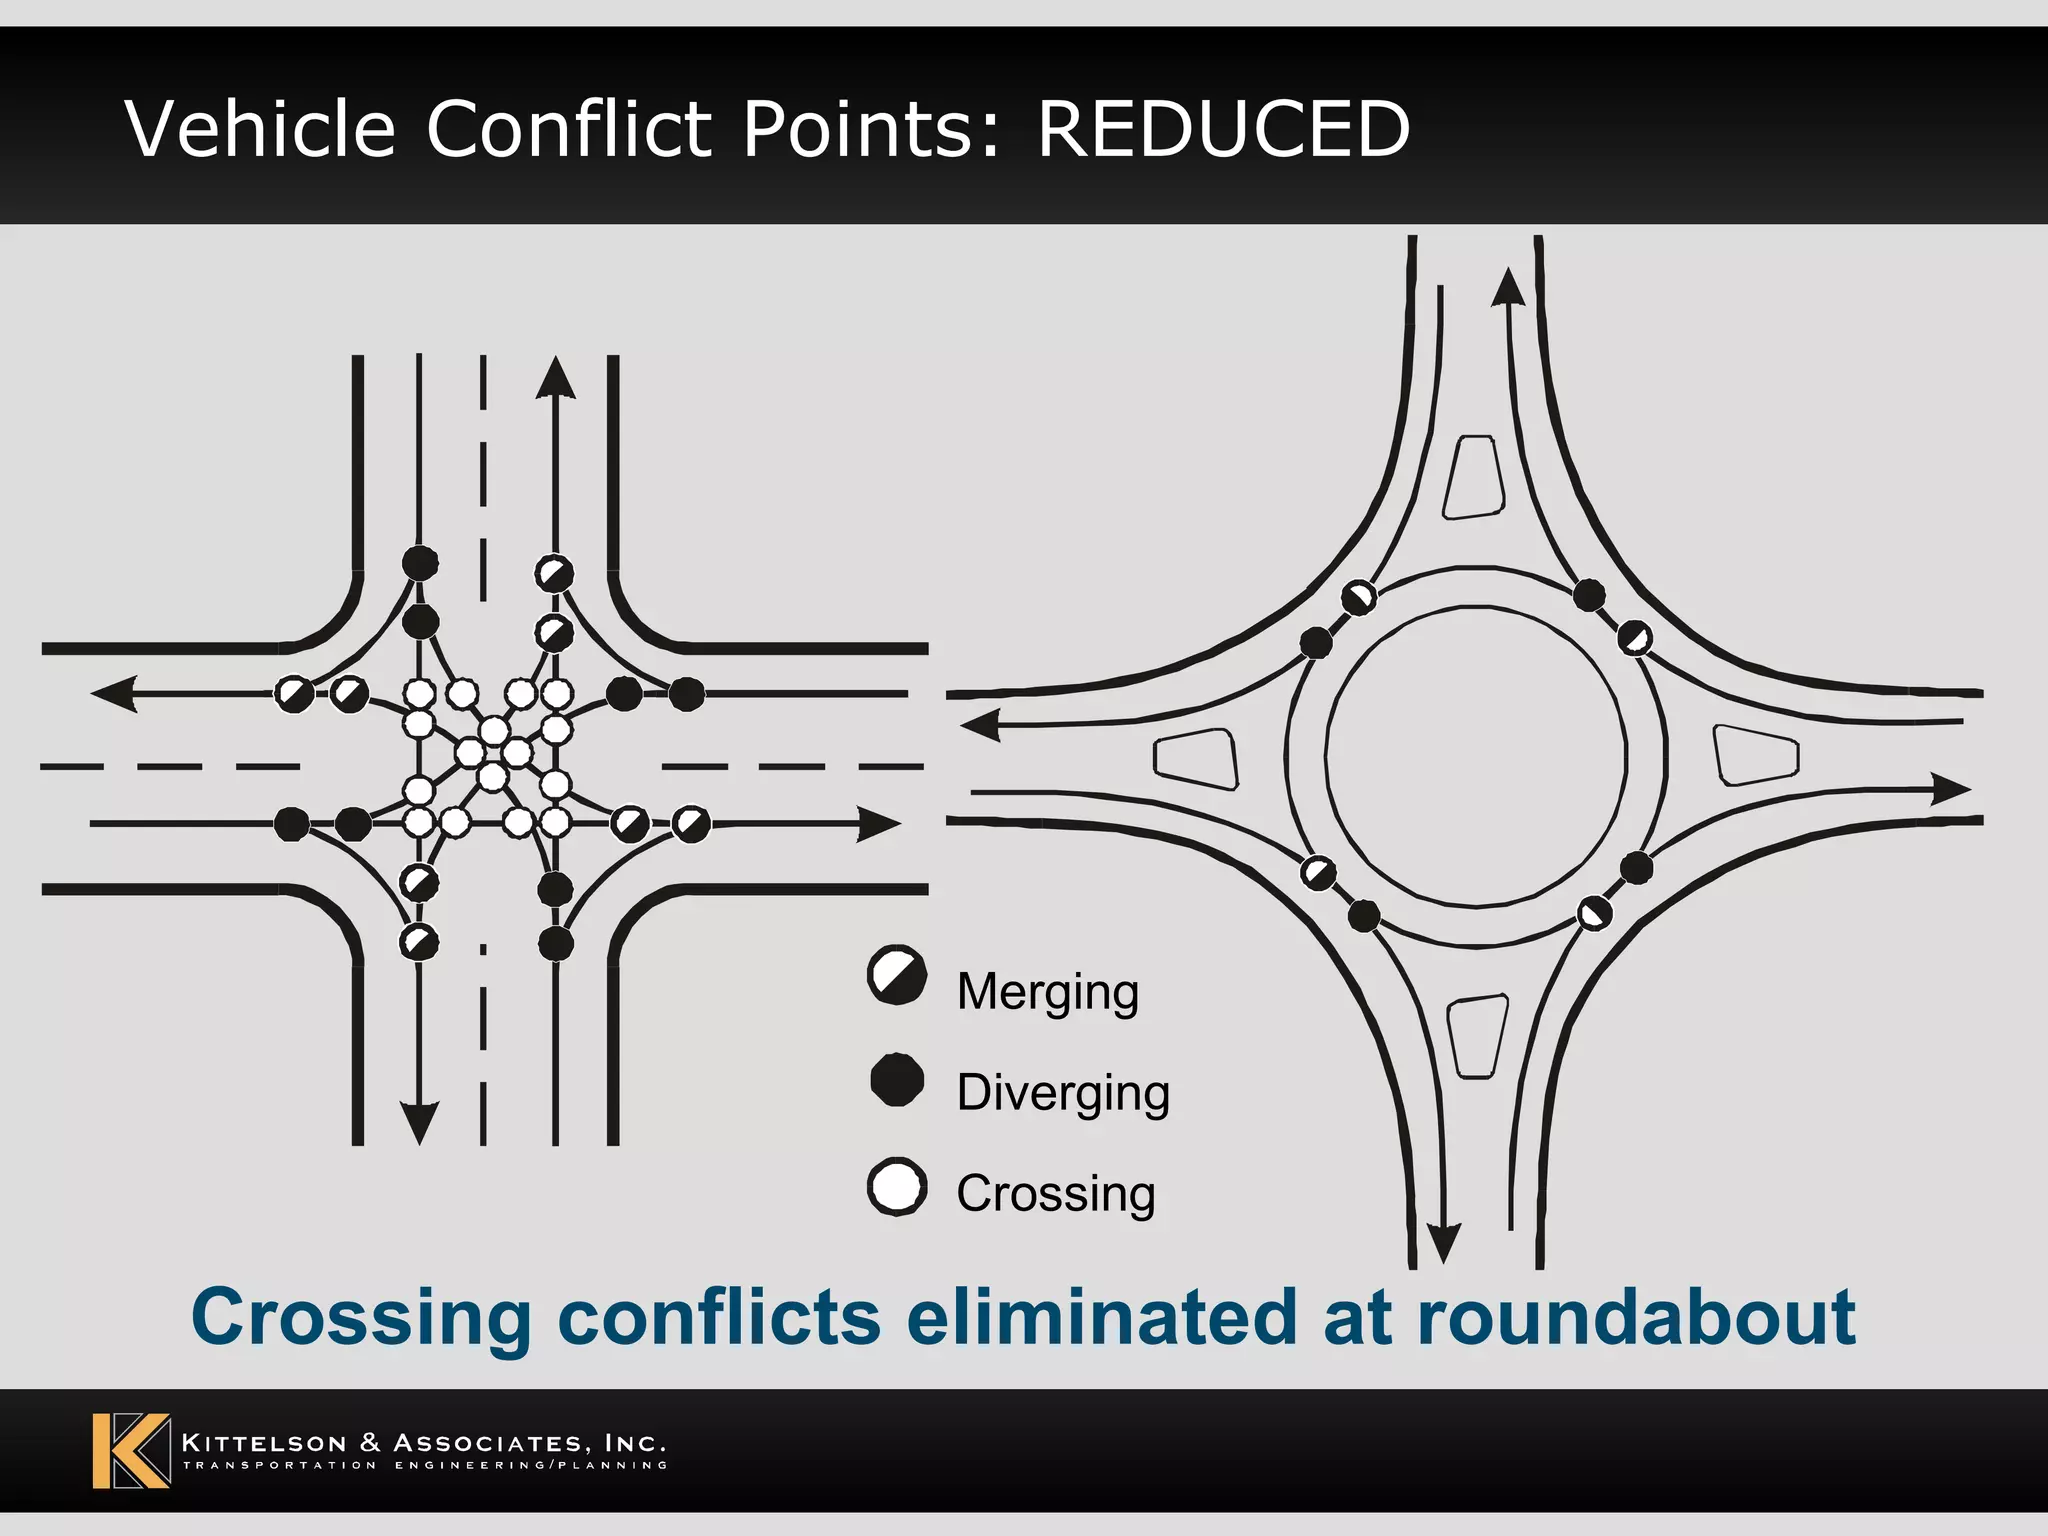
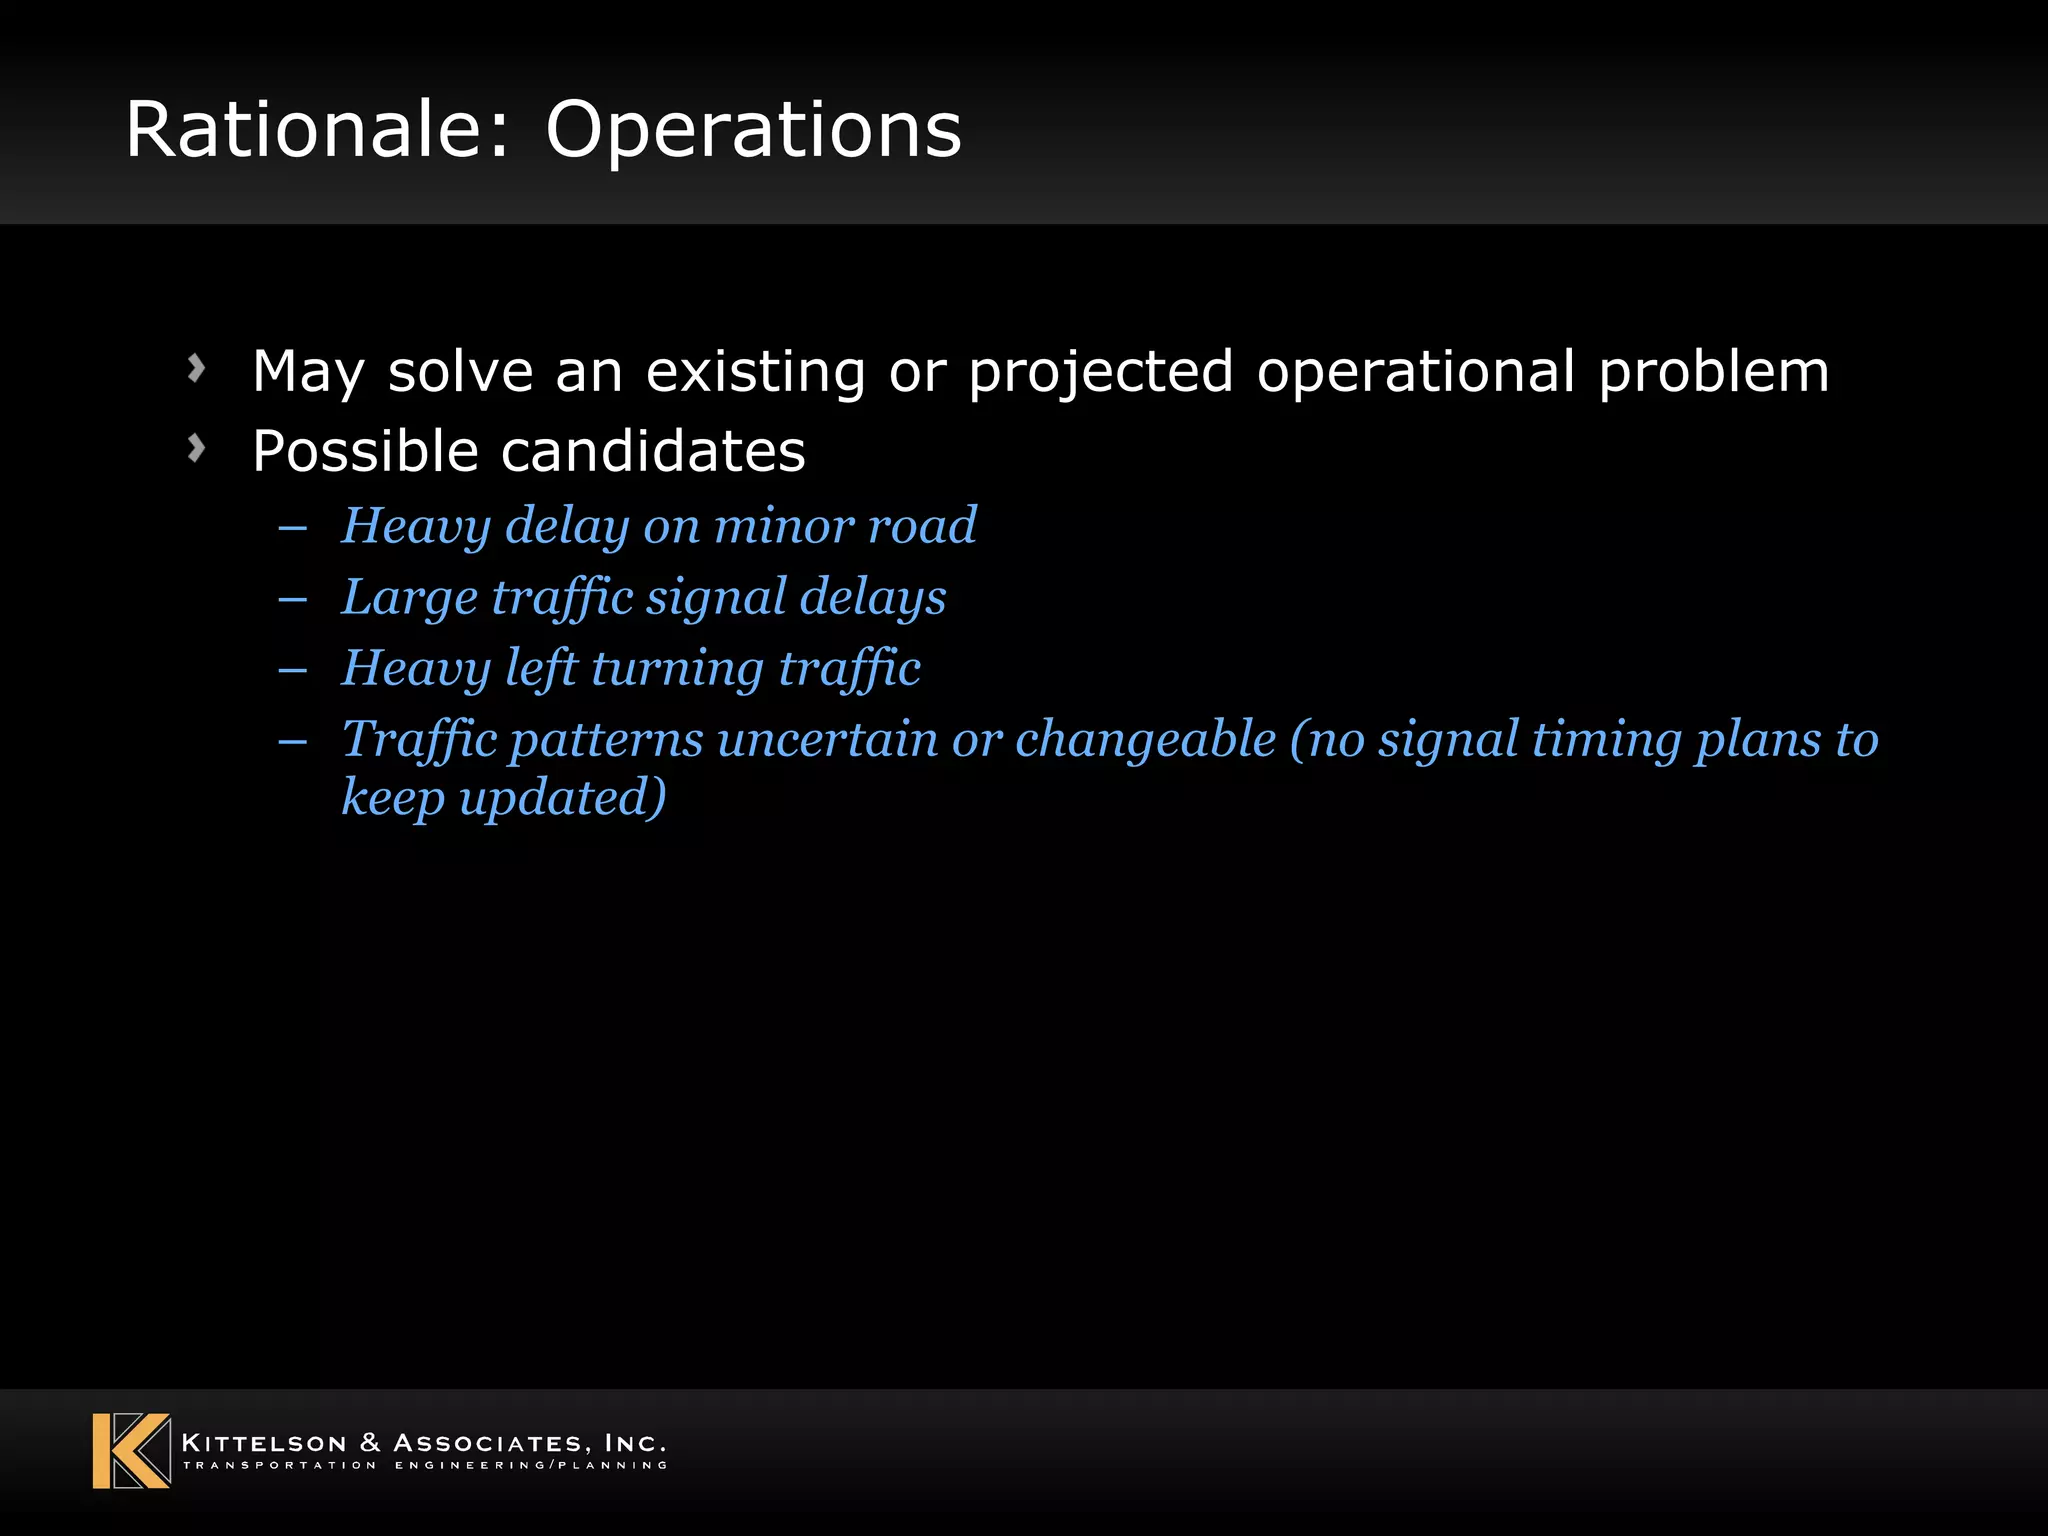
Modern Urban Roundabouts December 15, 2009
Roundabouts are a subset of circular intersections… Roundabouts Rotaries Neighborhood traffic circles All circular intersections Others
Rotary:  US 377/TX 183/Camp Bowie Pkwy, Fort Worth, TX Photo: City of Fort Worth, TX
Conversion of Rotary to Roundabout: Kingston, NY Photo: New York State DOT
Roundabouts versus Other Circular Intersections Key elements distinguish roundabouts: YIELD control on entry Priority to circulating vehicles Slow, consistent speeds Pedestrian access & crossing Parking Direction of circulation
Yield on entry Photos: Lee Rodegerdts Roundabout Traffic Circle Higher capacity Lower delay
Priority to Circulating Vehicles Photos: Lee Rodegerdts Roundabout Traffic Circle Prevents gridlock
Pedestrian Access Photo:  Oregon DOT Photos: Lee Rodegerdts Roundabout Traffic Circle
No Parking within Roundabout Photos: Lee Rodegerdts Parking within roundabout: Increases conflicts Reduces circulating capacity Roundabout Traffic Circle
Direction of Circulation Photo:  Ken Courage Photo: Lee Rodegerdts Roundabout Traffic Circle
Key Roundabout Features Exhibit 1-1, p. 6
Our recent history has been active… 1990 1995 2000 1905: Columbus Circle (NYC) 1990: First modern use in U.S. 1920s-1950s: Rotary era 2009-2010: Updated FHWA Rbt Guide, MUTCD, HCM 2005 2010 1990s: MD, FL, O&D Guides 2001-2007: Explosion of state guides and manuals 2000: FHWA Rbt Guide 2007: NCHRP Report 572
Number built each year is going up  exponentially
U.S. sites by state through 1992
U.S. sites by state through 1997
U.S. sites by state through 2002
U.S. sites by state through 2007
NCHRP Report 572 “Roundabouts in the United States” Most comprehensive study of U.S. roundabout performance to date Scope (NCHRP Project 3-65): Safety and operational models based on U.S. field data Updated design guidance based on model findings and current state-of-the-art practice and thinking Completed May 2006
NCHRP 3-65A: Update of Roundabout Guide FHWA Roundabout Guide has become a popular and standard reference Guide has become out of date with rapid increase in U.S.-based experience and research Update in 2010
Categories of Roundabouts
Mini-Roundabout
Mini-Roundabout Examples – U.S. Dimondale, MI Photo: Lee Rodegerdts Lutherville, MD Photo: Maryland SHA
Mini-Roundabout Examples - Europe Photo: Lee Rodegerdts Germany United Kingdom Photo: Werner Brilon
Urban Compact Roundabouts
Urban Compact Roundabout Examples West Boca Raton, FL Germany Photo: Lee Rodegerdts Photo: Werner Brilon
Urban Single-Lane Roundabouts
Urban Single-Lane Roundabout Examples Santa Barbara, CA Bend, OR Photo: Lee Rodegerdts Photo: Oregon DOT
Urban Double-Lane Roundabouts
Urban Double- and Multi-Lane Roundabout Examples Towson, MD Avon, CO
Rationale for Considering a Roundabout Safety Operations Land Use Geometry
Rationale:  Safety Roundabouts have a proven safety record for reducing motor vehicle crashes, particularly injury crashes Experience is due to basic contributing factors: Reduced vehicle speeds Reduced driver decisions Reduced conflict points Reduced conflict severity
U.S. Experience NCHRP Report 572 Results (May 2006) 82 44 Two-way stop (36) No significant change No significant change All-way stop (10) 78 48 Signalized (9) 76 35 All sites (55) % Reduction in  Injury Crashes % Reduction in  All Crashes Group Characteristic before Conversion (sample size)
Maryland’s Roundabout Accident Experience (March 2007 Study) Accident data at 15 state highway intersections converted to single-lane roundabouts between April 1993 and December 2003 86% reduction 0.16 1.13 Mean injury accident rate (acc./MEV) 68% reduction 0.61 1.91 Mean total accident rate (acc./MEV) 83% reduction 7.3 43.5 Total annual injury accidents 65% reduction 24.8 71.7 Total annual accidents % Change After Before
Maryland’s Roundabout Accident Experience (cont.) Overall Crash Reductions: 100% reduction in fatal accident rate 86% reduction in injury accident rate 40% reduction in property damage only accidents Benefit/cost analysis indicated return of $13 for every dollar spent.
Lower speed is safer for pedestrians Chance of pedestrian death increases with vehicle speed Source: United Kingdom
Number of driver decisions: REDUCED Entry into only one conflicting traffic stream Conflicting speeds fairly uniform Conflicts with pedestrians physically separated from conflicts with other vehicles
Vehicle Conflict Points: REDUCED Crossing conflicts eliminated at roundabout Merging Diverging Crossing
Severity of Vehicular Conflicts: REDUCED Severity related to relative velocities of conflicting streams Rear-end Sideswipe Angle Angle  Head-on Least severe Most severe
Rationale: Operations May solve an existing or projected operational problem Possible candidates Heavy delay on minor road Large traffic signal delays Heavy left turning traffic Traffic patterns uncertain or changeable (no signal timing plans to keep updated)
Roundabouts versus Signals: MUTCD Signal Warrant Threshold 0 2 4 6 8 10 12 14 16 18 20 600 700 800 900 1000 1100 1200 1300 1400 1500 Total Major Street Volume (veh/h) Average Delay (s/veh) Signal (10% left turns) Signal (50% left turns) Roundabout (10% left turns) Roundabout (50% left turns) Exhibit 3-7, p. 63 Based on MUTCD Warrant 3 (2000 ed.)/Warrant 11 (1988 ed.)
Rationale: Land Use Reasons other than safety or operations Possible candidates Community enhancement Gateway treatment Break between conflicting land uses Urban vs. rural Commercial vs. residential
Example of Land Use: Clearwater, FL Photo: City of Clearwater, FL Commercial w/ angle parking Residential
Rationale:  Geometry Unusual geometric configurations may lend themselves to a roundabout Possible candidates More than four legs “Y” configuration with high-speed movements Need for U-turns Freeway interchange ramps
Consideration of Users Design Vehicle Pedestrians Bicycles Emergency Vehicles
Design vehicle Photos: Lee Rodegerdts Truckee, California Portland, Oregon
Design for Appropriate Design Vehicle: Critical at Planning Stage Photos: Lee Rodegerdts May require use of truck apron Affects diameter and right-of-way requirements Good design Poor design
Accommodating Pedestrians Influence good driver behavior Influence good pedestrian behavior Photos: Lee Rodegerdts
Pedestrian Design Guidance Well defined walkway edges Separated walkways Detectable warnings Perpendicular crossings Contrasting crosswalk markings 3 2 1 4 5
Discourage travel to central island Use care in selecting central island treatments Consider different pavement texture for truck apron Photo: Scott Beaird Photo: Erin Ferguson
Improving Accessibility for All Pedestrians Key issues Guiding pedestrian navigation (wayfinding) Promoting vehicular yielding Providing indications that vehicle has yielded Providing equal access to public facilities Photo: Lee Rodegerdts
Accessibility for Visually Impaired Access Board proposing requiring some kind of signals for multilane entries and exits Michigan case settlement    hybrid pedestrian signals (HAWK signals) being installed Practice will continue to evolve
Pedestrian hybrid signal: Golden, CO Photo: Lee Rodegerdts
Bicycles Roundabouts slow vehicles to speeds compatible with bicycles Bicycle speeds:  10-15 mph Bicyclists have wide range of skills and comfort levels in mixed traffic Experienced cyclists (e.g., commuter or utility cyclists) Inexperienced cyclists (e.g., children or occasional recreation cyclists) Give bicyclists option of either being vehicle or pedestrian
Example Bicycle Treatments
Bicycle Treatments: Grand Junction, CO Source: City of Grand Junction, CO
Public Involvement: Overall Experience Typical experience (but not always): negative reaction before construction, positive reaction after construction Common misconception based on rotaries or neighborhood traffic circles
NCHRP Synthesis 264 (Jacquemart) Before Construction After Construction
Project Techniques:  Public meeting displays Model created by Missouri D.O.T. Photo: Missouri DOT
Project Techniques: Educating School Age Children (Overland Park, KS) Photo: Erin Ferguson
Project Techniques:  Brochures (Vail, CO) Exhibit 2-6(a), p. 42
Project Techniques:  Videos General information “ Modern Roundabouts” (Maryland SHA) “ A User’s Guide to Roundabouts” (Oregon DOT, 1999) “ Driving Modern Roundabouts” (Washington State DOT/City of Lacey/City of Olympia) Project-specific information “ The East Topeka Roundabouts” (Kansas DOT, 2000) “ I-70/Vail Road” (Ourston & Doctors) “ Nonconforming Traffic Circle Becomes Modern Roundabout” (Ourston & Doctors) Specialty information “ Snow at Roundabouts” (Ourston & Doctors)
Sample State Web Site: Maryland State Highway Administration
La Jolla Boulevard – Bird Rock Roundabouts
Case Study – Campus Drive/Daggett Avenue Year 2006 Conditions  v/c ratio = 0.77 LOS = F 5 years of safety data 13 crashes mostly angle crashes Year 2013 Conditions  Includes OIT Expansion v/c ratio > 1.0  (peak 15 mins) LOS = F Does not meet signal warrants Year 2013 Mitigated Conditions  Single-lane roundabout A A A A LOS 0.08 0.23 0.49 0.47 v/c W E S N
Case Study – Campus Drive/Daggett Avenue N Opportunities to improve ped/bike facilities Minimal ROW needs Reduction to one travel lane Roundabout? Example ped/bike improvements
Key Issues for Now and Future Continued education of public Roundabout is just another type of intersection Continued education of professionals Roundabouts should always be considered as a potential solution Continued involvement in standards/policy/guidance development Our profession and our communities benefit from us coming together and collectively improving our practice
Thank You! Photo courtesy of Harper Houf Peterson Righellis, Inc.

KAI - Modern Urban Roundabouts

  • 1.
    Modern Urban RoundaboutsDecember 15, 2009
  • 2.
    Roundabouts are asubset of circular intersections… Roundabouts Rotaries Neighborhood traffic circles All circular intersections Others
  • 3.
    Rotary: US377/TX 183/Camp Bowie Pkwy, Fort Worth, TX Photo: City of Fort Worth, TX
  • 4.
    Conversion of Rotaryto Roundabout: Kingston, NY Photo: New York State DOT
  • 5.
    Roundabouts versus OtherCircular Intersections Key elements distinguish roundabouts: YIELD control on entry Priority to circulating vehicles Slow, consistent speeds Pedestrian access & crossing Parking Direction of circulation
  • 6.
    Yield on entryPhotos: Lee Rodegerdts Roundabout Traffic Circle Higher capacity Lower delay
  • 7.
    Priority to CirculatingVehicles Photos: Lee Rodegerdts Roundabout Traffic Circle Prevents gridlock
  • 8.
    Pedestrian Access Photo: Oregon DOT Photos: Lee Rodegerdts Roundabout Traffic Circle
  • 9.
    No Parking withinRoundabout Photos: Lee Rodegerdts Parking within roundabout: Increases conflicts Reduces circulating capacity Roundabout Traffic Circle
  • 10.
    Direction of CirculationPhoto: Ken Courage Photo: Lee Rodegerdts Roundabout Traffic Circle
  • 11.
    Key Roundabout FeaturesExhibit 1-1, p. 6
  • 12.
    Our recent historyhas been active… 1990 1995 2000 1905: Columbus Circle (NYC) 1990: First modern use in U.S. 1920s-1950s: Rotary era 2009-2010: Updated FHWA Rbt Guide, MUTCD, HCM 2005 2010 1990s: MD, FL, O&D Guides 2001-2007: Explosion of state guides and manuals 2000: FHWA Rbt Guide 2007: NCHRP Report 572
  • 13.
    Number built eachyear is going up exponentially
  • 14.
    U.S. sites bystate through 1992
  • 15.
    U.S. sites bystate through 1997
  • 16.
    U.S. sites bystate through 2002
  • 17.
    U.S. sites bystate through 2007
  • 18.
    NCHRP Report 572“Roundabouts in the United States” Most comprehensive study of U.S. roundabout performance to date Scope (NCHRP Project 3-65): Safety and operational models based on U.S. field data Updated design guidance based on model findings and current state-of-the-art practice and thinking Completed May 2006
  • 19.
    NCHRP 3-65A: Updateof Roundabout Guide FHWA Roundabout Guide has become a popular and standard reference Guide has become out of date with rapid increase in U.S.-based experience and research Update in 2010
  • 20.
  • 21.
  • 22.
    Mini-Roundabout Examples –U.S. Dimondale, MI Photo: Lee Rodegerdts Lutherville, MD Photo: Maryland SHA
  • 23.
    Mini-Roundabout Examples -Europe Photo: Lee Rodegerdts Germany United Kingdom Photo: Werner Brilon
  • 24.
  • 25.
    Urban Compact RoundaboutExamples West Boca Raton, FL Germany Photo: Lee Rodegerdts Photo: Werner Brilon
  • 26.
  • 27.
    Urban Single-Lane RoundaboutExamples Santa Barbara, CA Bend, OR Photo: Lee Rodegerdts Photo: Oregon DOT
  • 28.
  • 29.
    Urban Double- andMulti-Lane Roundabout Examples Towson, MD Avon, CO
  • 30.
    Rationale for Consideringa Roundabout Safety Operations Land Use Geometry
  • 31.
    Rationale: SafetyRoundabouts have a proven safety record for reducing motor vehicle crashes, particularly injury crashes Experience is due to basic contributing factors: Reduced vehicle speeds Reduced driver decisions Reduced conflict points Reduced conflict severity
  • 32.
    U.S. Experience NCHRPReport 572 Results (May 2006) 82 44 Two-way stop (36) No significant change No significant change All-way stop (10) 78 48 Signalized (9) 76 35 All sites (55) % Reduction in Injury Crashes % Reduction in All Crashes Group Characteristic before Conversion (sample size)
  • 33.
    Maryland’s Roundabout AccidentExperience (March 2007 Study) Accident data at 15 state highway intersections converted to single-lane roundabouts between April 1993 and December 2003 86% reduction 0.16 1.13 Mean injury accident rate (acc./MEV) 68% reduction 0.61 1.91 Mean total accident rate (acc./MEV) 83% reduction 7.3 43.5 Total annual injury accidents 65% reduction 24.8 71.7 Total annual accidents % Change After Before
  • 34.
    Maryland’s Roundabout AccidentExperience (cont.) Overall Crash Reductions: 100% reduction in fatal accident rate 86% reduction in injury accident rate 40% reduction in property damage only accidents Benefit/cost analysis indicated return of $13 for every dollar spent.
  • 35.
    Lower speed issafer for pedestrians Chance of pedestrian death increases with vehicle speed Source: United Kingdom
  • 36.
    Number of driverdecisions: REDUCED Entry into only one conflicting traffic stream Conflicting speeds fairly uniform Conflicts with pedestrians physically separated from conflicts with other vehicles
  • 37.
    Vehicle Conflict Points:REDUCED Crossing conflicts eliminated at roundabout Merging Diverging Crossing
  • 38.
    Severity of VehicularConflicts: REDUCED Severity related to relative velocities of conflicting streams Rear-end Sideswipe Angle Angle Head-on Least severe Most severe
  • 39.
    Rationale: Operations Maysolve an existing or projected operational problem Possible candidates Heavy delay on minor road Large traffic signal delays Heavy left turning traffic Traffic patterns uncertain or changeable (no signal timing plans to keep updated)
  • 40.
    Roundabouts versus Signals:MUTCD Signal Warrant Threshold 0 2 4 6 8 10 12 14 16 18 20 600 700 800 900 1000 1100 1200 1300 1400 1500 Total Major Street Volume (veh/h) Average Delay (s/veh) Signal (10% left turns) Signal (50% left turns) Roundabout (10% left turns) Roundabout (50% left turns) Exhibit 3-7, p. 63 Based on MUTCD Warrant 3 (2000 ed.)/Warrant 11 (1988 ed.)
  • 41.
    Rationale: Land UseReasons other than safety or operations Possible candidates Community enhancement Gateway treatment Break between conflicting land uses Urban vs. rural Commercial vs. residential
  • 42.
    Example of LandUse: Clearwater, FL Photo: City of Clearwater, FL Commercial w/ angle parking Residential
  • 43.
    Rationale: GeometryUnusual geometric configurations may lend themselves to a roundabout Possible candidates More than four legs “Y” configuration with high-speed movements Need for U-turns Freeway interchange ramps
  • 44.
    Consideration of UsersDesign Vehicle Pedestrians Bicycles Emergency Vehicles
  • 45.
    Design vehicle Photos:Lee Rodegerdts Truckee, California Portland, Oregon
  • 46.
    Design for AppropriateDesign Vehicle: Critical at Planning Stage Photos: Lee Rodegerdts May require use of truck apron Affects diameter and right-of-way requirements Good design Poor design
  • 47.
    Accommodating Pedestrians Influencegood driver behavior Influence good pedestrian behavior Photos: Lee Rodegerdts
  • 48.
    Pedestrian Design GuidanceWell defined walkway edges Separated walkways Detectable warnings Perpendicular crossings Contrasting crosswalk markings 3 2 1 4 5
  • 49.
    Discourage travel tocentral island Use care in selecting central island treatments Consider different pavement texture for truck apron Photo: Scott Beaird Photo: Erin Ferguson
  • 50.
    Improving Accessibility forAll Pedestrians Key issues Guiding pedestrian navigation (wayfinding) Promoting vehicular yielding Providing indications that vehicle has yielded Providing equal access to public facilities Photo: Lee Rodegerdts
  • 51.
    Accessibility for VisuallyImpaired Access Board proposing requiring some kind of signals for multilane entries and exits Michigan case settlement  hybrid pedestrian signals (HAWK signals) being installed Practice will continue to evolve
  • 52.
    Pedestrian hybrid signal:Golden, CO Photo: Lee Rodegerdts
  • 53.
    Bicycles Roundabouts slowvehicles to speeds compatible with bicycles Bicycle speeds: 10-15 mph Bicyclists have wide range of skills and comfort levels in mixed traffic Experienced cyclists (e.g., commuter or utility cyclists) Inexperienced cyclists (e.g., children or occasional recreation cyclists) Give bicyclists option of either being vehicle or pedestrian
  • 54.
  • 55.
    Bicycle Treatments: GrandJunction, CO Source: City of Grand Junction, CO
  • 56.
    Public Involvement: OverallExperience Typical experience (but not always): negative reaction before construction, positive reaction after construction Common misconception based on rotaries or neighborhood traffic circles
  • 57.
    NCHRP Synthesis 264(Jacquemart) Before Construction After Construction
  • 58.
    Project Techniques: Public meeting displays Model created by Missouri D.O.T. Photo: Missouri DOT
  • 59.
    Project Techniques: EducatingSchool Age Children (Overland Park, KS) Photo: Erin Ferguson
  • 60.
    Project Techniques: Brochures (Vail, CO) Exhibit 2-6(a), p. 42
  • 61.
    Project Techniques: Videos General information “ Modern Roundabouts” (Maryland SHA) “ A User’s Guide to Roundabouts” (Oregon DOT, 1999) “ Driving Modern Roundabouts” (Washington State DOT/City of Lacey/City of Olympia) Project-specific information “ The East Topeka Roundabouts” (Kansas DOT, 2000) “ I-70/Vail Road” (Ourston & Doctors) “ Nonconforming Traffic Circle Becomes Modern Roundabout” (Ourston & Doctors) Specialty information “ Snow at Roundabouts” (Ourston & Doctors)
  • 62.
    Sample State WebSite: Maryland State Highway Administration
  • 63.
    La Jolla Boulevard– Bird Rock Roundabouts
  • 64.
    Case Study –Campus Drive/Daggett Avenue Year 2006 Conditions v/c ratio = 0.77 LOS = F 5 years of safety data 13 crashes mostly angle crashes Year 2013 Conditions Includes OIT Expansion v/c ratio > 1.0 (peak 15 mins) LOS = F Does not meet signal warrants Year 2013 Mitigated Conditions Single-lane roundabout A A A A LOS 0.08 0.23 0.49 0.47 v/c W E S N
  • 65.
    Case Study –Campus Drive/Daggett Avenue N Opportunities to improve ped/bike facilities Minimal ROW needs Reduction to one travel lane Roundabout? Example ped/bike improvements
  • 66.
    Key Issues forNow and Future Continued education of public Roundabout is just another type of intersection Continued education of professionals Roundabouts should always be considered as a potential solution Continued involvement in standards/policy/guidance development Our profession and our communities benefit from us coming together and collectively improving our practice
  • 67.
    Thank You! Photocourtesy of Harper Houf Peterson Righellis, Inc.

Editor's Notes