Download to read offline
![IOSR Journal of Mechanical and Civil Engineering (IOSR-JMCE)
e-ISSN: 2278-1684,p-ISSN: 2320-334X, Volume 12, Issue 2 Ver. VI (Mar - Apr. 2015), PP 59-65
www.iosrjournals.org
DOI: 10.9790/1684-12265965 www.iosrjournals.org 59 | Page
Parametric Optimization of Single Cylinder Diesel Engine for
Jatropha Biodiesel and Diesel Blend for Mechanical Efficiency
Using Taguchi Method
Dhruv V. Patel1
, Tushar M. Patel2
, Gaurav P Rathod3
1
ME Scholar, Mechanical Department, L.D.R.P.-I.T.R., Gandhinagar, India
2
Associate Professor, Mechanical Department, L.D.R.P.-I.T.R., Gandhinagar, India
3
Assistant Professor, Mechanical Department, L.D.R.P.-I.T.R., Gandhinagar, India
Abstract: An experimental study has been carried out for Jatropha biodiesel blended with diesel used in single
cylinder diesel engine. Jatropha biodiesel is obtained from Jatropha oil by tranesterification process. Blending
of Jatropha biodiesel with diesel in maximum possible proportion helps to reduce the consumption of diesel fuel.
In this study, the effects of parameters’ i.e. load, blend proportion and compression ratio are taken as variable
for optimization. As the experiment required simultaneously optimization of three parameters with three levels,
taguchi method of optimization is used in this experiment. The results of the taguchi experiment identifies that
50% blend ratio, compression ratio 16 and engine load 10kg are optimum parameter setting for highest
mechanical efficiency. Engine performance is mostly influenced by engine load and is least influenced by blend
ratio. Confirmation experiment was done using optimum combination showed that mechanical efficiency was
found by experiment is closer to the predicated value.
Keywords: Blend ratio, Compression ratio, Mechanical efficiency, Taguchi, Jatropha
I. Introduction
According to statistical review of world energy published by British Petroleum the increase of oil
reserves in world from 2012 to 2013 is 0.60% whereas oil consumption increases from 2012 to 2013 is 1.40%.
[1] Due to the increasing awareness of the depletion of fossil fuel resources and environmental issues, biodiesel
became more attractive in the recent years. Biodiesel production is a promising and important field of research
because the relevance it gains from the rising petroleum price and its environmental advantages. [2]
In present situation, there is much possibility of multifold increase in the research in biodiesel,
vegetable oils like soybean oil, rapeseeds oil, sunflower oil, methanol, ethanol and other alternate fuels.
Considering alternate fuels as a substitute of diesel, Researchers are continuously finding best
alternative solution, which gives the best performance and fuel characteristics. [3]
In such multivariate problem, use of non linear techniques like Design of Experiments (DoE), fuzzy
logic and neural network are suitable to explore the combined effects of input parameters. The optimum
operating parameters for a given system can be determined by using experimental techniques but it will be time
consuming and expensive when the number of parameters are in the order of 20, 30 etc., like in the case of IC
engines. In such situations mathematical modeling will be a very useful tool for optimizing the parameters. Such
a mathematical tool is Design of Experiment. Although few studies were reported using DoE in IC Engine
applications, the study on combined effects between input system parameters such as injection pressure, load,
blend proportion on the performance characteristics of CI engine was scarce and offered a scope for this study.
[4]
II. Jatropha Biodiesel
Jatropha biodiesel is obtained from Jatropha oil. It is reported that a dry seed of Jatropha curcas
contains about 55% of oil. Following are the steps to be followed to extract oil from seeds:
1. Shelling: This is to remove the seed coat.
2. Milling: The unshelled seeds were milled into dough using the corn mill machine.
3. Moisture content: If moisture is less than 12% w.b. add water or else remove water to achieve 12%
moisture content.
4. Rolling: Dough rolled into balls of about 1kg by weight.
5. Heating: Raise the temperature of the rolled dough to 75-8000
C by placing them in an oven.
6. Pressing: Rolled heated dough was pressed using the ram-press.
7. Filtration: The oil was collected and filtered. [5]](https://image.slidesharecdn.com/k012265965-160711050548/85/K012265965-1-320.jpg)
![Parametric optimization of single cylinder diesel engine for Jatropha biodiesel and diesel…
DOI: 10.9790/1684-12265965 www.iosrjournals.org 60 | Page
However, the maximum amount of oil that can be extracted from a given sample of the seed depends
on the method of extraction and thus the quality of the feedstock. Two main methods of extracting the oil have
been identified. They are the chemical extraction method using solvent extraction with n-hexane and the
mechanical extraction method using either a manual ram-press or an engine driven-expeller. [5] The process of
converting vegetable oil into biodiesel fuel is called Transesterification.
2.1 Transesterification Process
Table 1 Transesterification Process [5]
Vegetable Oil Alcohol Catalyst Glycerin Biodiesel
100 gm 12 gm 1 gm 11 gm 95 gm
It is the displacement of alcohol from an ester by another alcohol in a similar process to hydrolysis.
Vegetable oil i.e. the triglyceride can be easily trans-esterified in the presence of alkaline catalyst at atmospheric
pressure and at temperature of approximately 60 to 700C with an excess of methanol. If 100 gm of vegetable oil
is taken, 1 gm of the alkaline catalyst (Potassium Hydroxide), and 12 gm of methanol would be required. As a
first step, the alkaline catalyst is mixed with methanol and the mixture is stirred for half an hour for its
homogenization. This mixture is mixed with vegetable oil and the resultant mixture is made to pass through
reflux condensation at 650C. The mixture at the end is allowed to settle. The lower layer will be of glycerin and
it is drained off. The upper layer of bio-diesel (a methyl ester) is washed to remove entrained glycerin. The
excess methanol recycled by distillation. This reaction works well with high quality oil. If the oil contains 1%
Free Fatty Acid (FFA), then difficulty arises because of soap formation. If FFA content is more than2% the
reaction becomes unworkable. Methanol is inflammable and potassium hydroxide is caustic, hence proper and
safe handling of these chemicals is must. [5]
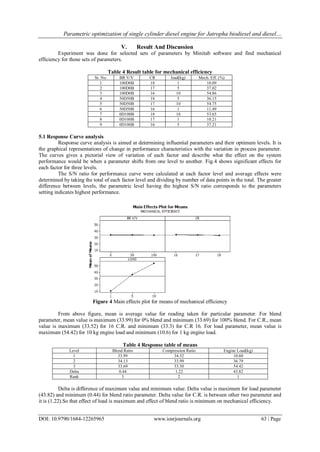
Figure 1 chemical process of Transesterification [6]
Table 2 Comparison of properties
Sr. No. PROPERTIES JATROPHA BIODIESEL DIESEL
1 Colour Golden Yellow Orange
2 Specific Gravity at 30 °C 0.886 0.84 to 0.88
3 Gross Calorific Value (MJ/kg) 41 42
4 Kinematic Viscosity, Cst @ 40°C 4.20 2.0
5 Cetane number 57-62 55
7 Boiling point ºC 286 248
8 Solidifying point ºC -10 -14
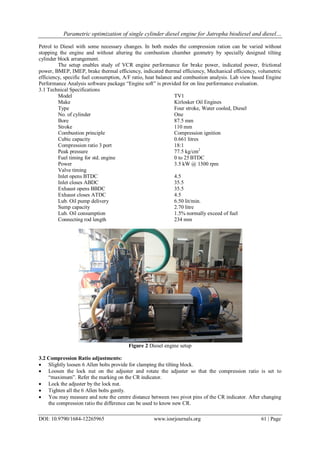
III. Experimental Setup
The setup consists of single cylinder, four stroke, multi-fuel, research engine connected to eddy type
dynamometer for loading. The operation mode of the engine can be changed from diesel to Petrol and from](https://image.slidesharecdn.com/k012265965-160711050548/85/K012265965-2-320.jpg)

![Parametric optimization of single cylinder diesel engine for Jatropha biodiesel and diesel…
DOI: 10.9790/1684-12265965 www.iosrjournals.org 65 | Page
VI. Conclusion
The feasibility of using taguchi method to optimize selected diesel engine parameter for highest
performance was investigated using single cylinder, 4-stroke diesel engine. The conclusions from this work are
summarized as follow:
1) The taguchi method was found to be an efficient technique for quantifying the effect of control parameter.
2) The highest performance at set 50% blend ratio, engine load 10kg, and compression ratio 16, which are
optimum parameter setting for highest mechanical efficiency.
3) Engine performance is mostly influenced by engine load and is least influenced by blend ratio.
4) Performance results obtained from the confirmation experiment using optimum combination showed
excellent agreement with the predicated result.
References
[1]. http://www.bp.com/en/global/corporate/about-bp/energy-economics/statistical-review-of-world-energy/2013-in-review.html. Last
retrieved on 3/29/2014.
[2]. Huang, Daming, Haining Zhou, and Lin Lin. "Biodiesel: an alternative to conventional fuel." Energy Procedia 16 (2012): 1874-
1885.
[3]. Ganapathy T., Murugesan K., Gakkhar R.P., “Performance optimization of Jatropha biodiesel engine model using Taguchi
approach.” Applied Energy 86 (2009) 2476–2486.
[4]. Pandian M, Sivapirakasam S.P, Udayakumar M, “Investigation on the effect of injection system parameters on performance and
emission characteristics of a twin cylinder compression ignition direct injection engine fuelled with pongamia biodiesel–diesel
blend using response surface methodology.”Applied Energy 88 (2011) 2663–2676.
[5]. Sohan Lal, Comparative study of non edible bio diesel fuel, Master of Engineering, Thapar University, Patiala, India, 2013.
[6]. Abdullah Ali A Abuhabaya, Investigation of engine performance and exhaust gas emissions by using bio-diesel in compression
ignition engine and optimisation of bio-diesel production from feedstock by using response surface methodology, Doctor of
Philosophy, University of Huddersfield, England, 2012.
Appendix
Nomenclatures
bsfc Brake specific fuel consumption
BR V/V Blend ratio by volume
100D0B 100% diesel 0% biodiesel
50D50B 50% diesel 50% biodiesel
0D100B 0% diesel 100% biodiesel](https://image.slidesharecdn.com/k012265965-160711050548/85/K012265965-7-320.jpg)

This document describes a study that used the Taguchi method to optimize the parameters of a single cylinder diesel engine running on blends of jatropha biodiesel and diesel. The parameters investigated were blend ratio, compression ratio, and engine load. Nine experiments were conducted based on an L9 orthogonal array with the parameters each at three levels. The mechanical efficiency was measured for each experiment. Response curve analysis showed that engine load had the greatest influence on mechanical efficiency, followed by compression ratio, with blend ratio having the least influence. The analysis predicted that a blend ratio of 50%, compression ratio of 16, and engine load of 10kg would provide the optimum setting for highest mechanical efficiency. A confirmation experiment was conducted to validate this prediction.


