
Download to read offline


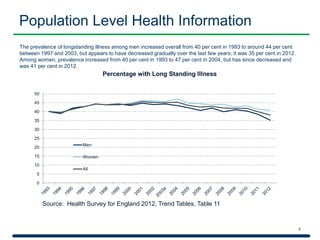
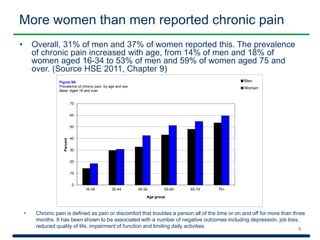
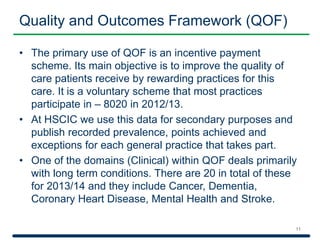
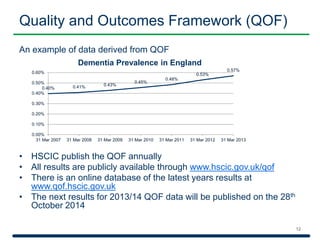
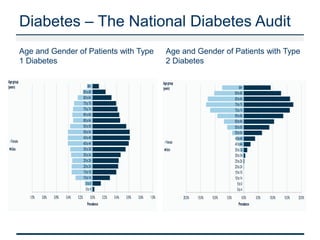
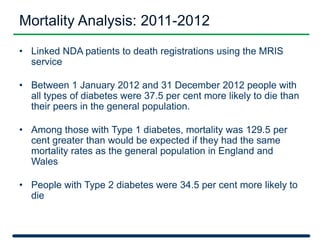
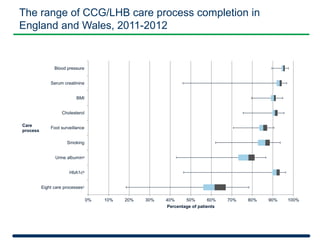
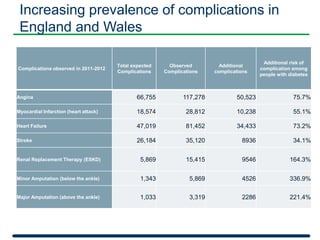
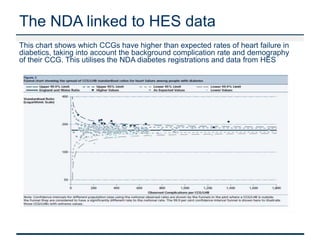
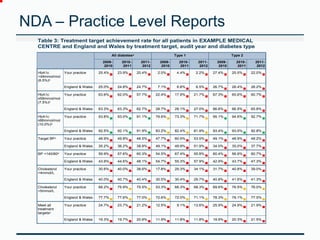
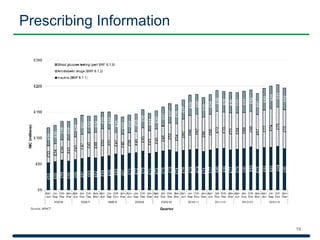
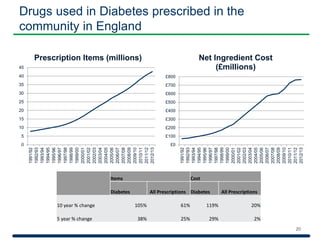
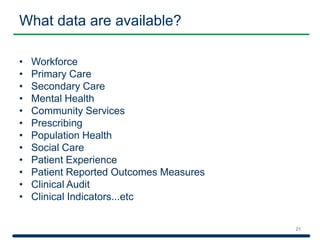

The document discusses the management of long-term health conditions in the UK, providing data on the prevalence of such conditions and their impact on individuals, including mental health effects and chronic pain statistics among different demographics. It highlights variations in feelings of support from health services, the quality of care through the Quality and Outcomes Framework (QOF), and statistics related to diabetes and its complications. Several resources and indicators are available for healthcare organizations to improve efficiency and care quality.


![CASE_PRESENTATION_ON_subdural_hematoma(SDH)[1 FINAL PPT]-1.pptx](https://cdn.slidesharecdn.com/ss_thumbnails/casepresentationonsubduralhematomasdh1finalppt-1-260129172522-d405d375-thumbnail.jpg?width=640&height=640&fit=bounds)


