
![3. Cost Effectiveness and NICE Decisions
– ―[NICE] should, generally, accept as cost effective those
interventions with an incremental cost-effectiveness
ratio of less than £20,000 per QALY and that there
should be increasingly strong reasons for accepting as
cost effective interventions with an incremental cost-
effectiveness ratio of over £30,000 per QALY.‖](https://image.slidesharecdn.com/niceandeq-5ddevlinsingapore2013-130326124245-phpapp02/75/Application-of-EQ-5D-in-Reimbursement-Decision-Making-The-Case-of-NICE-6-2048.jpg)
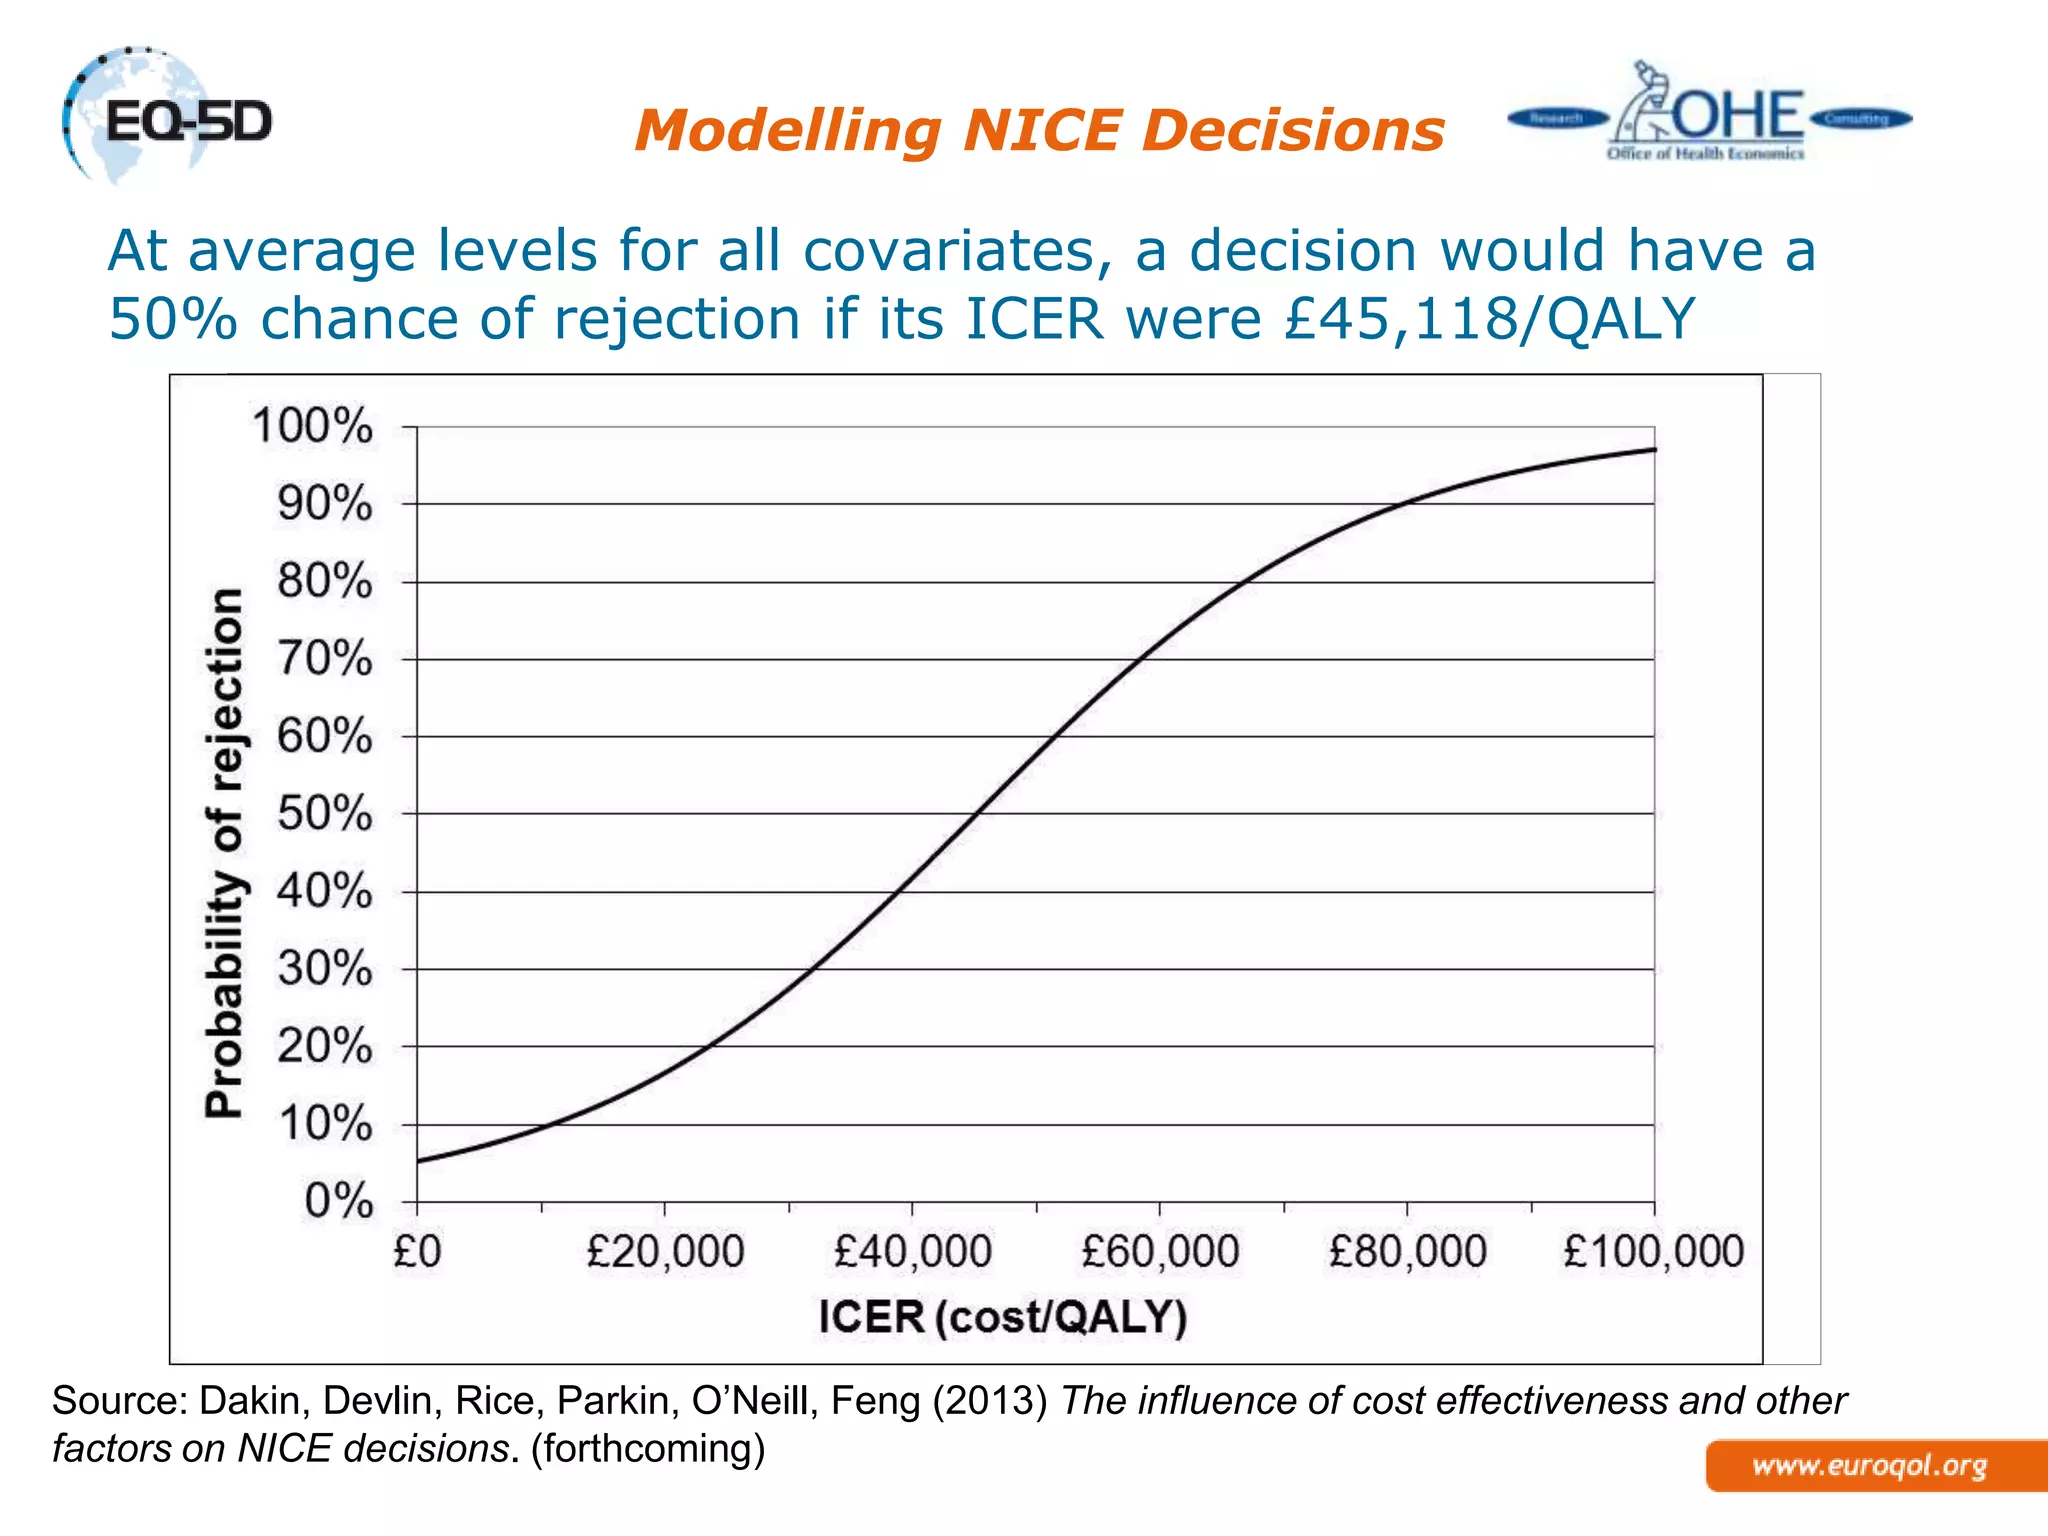
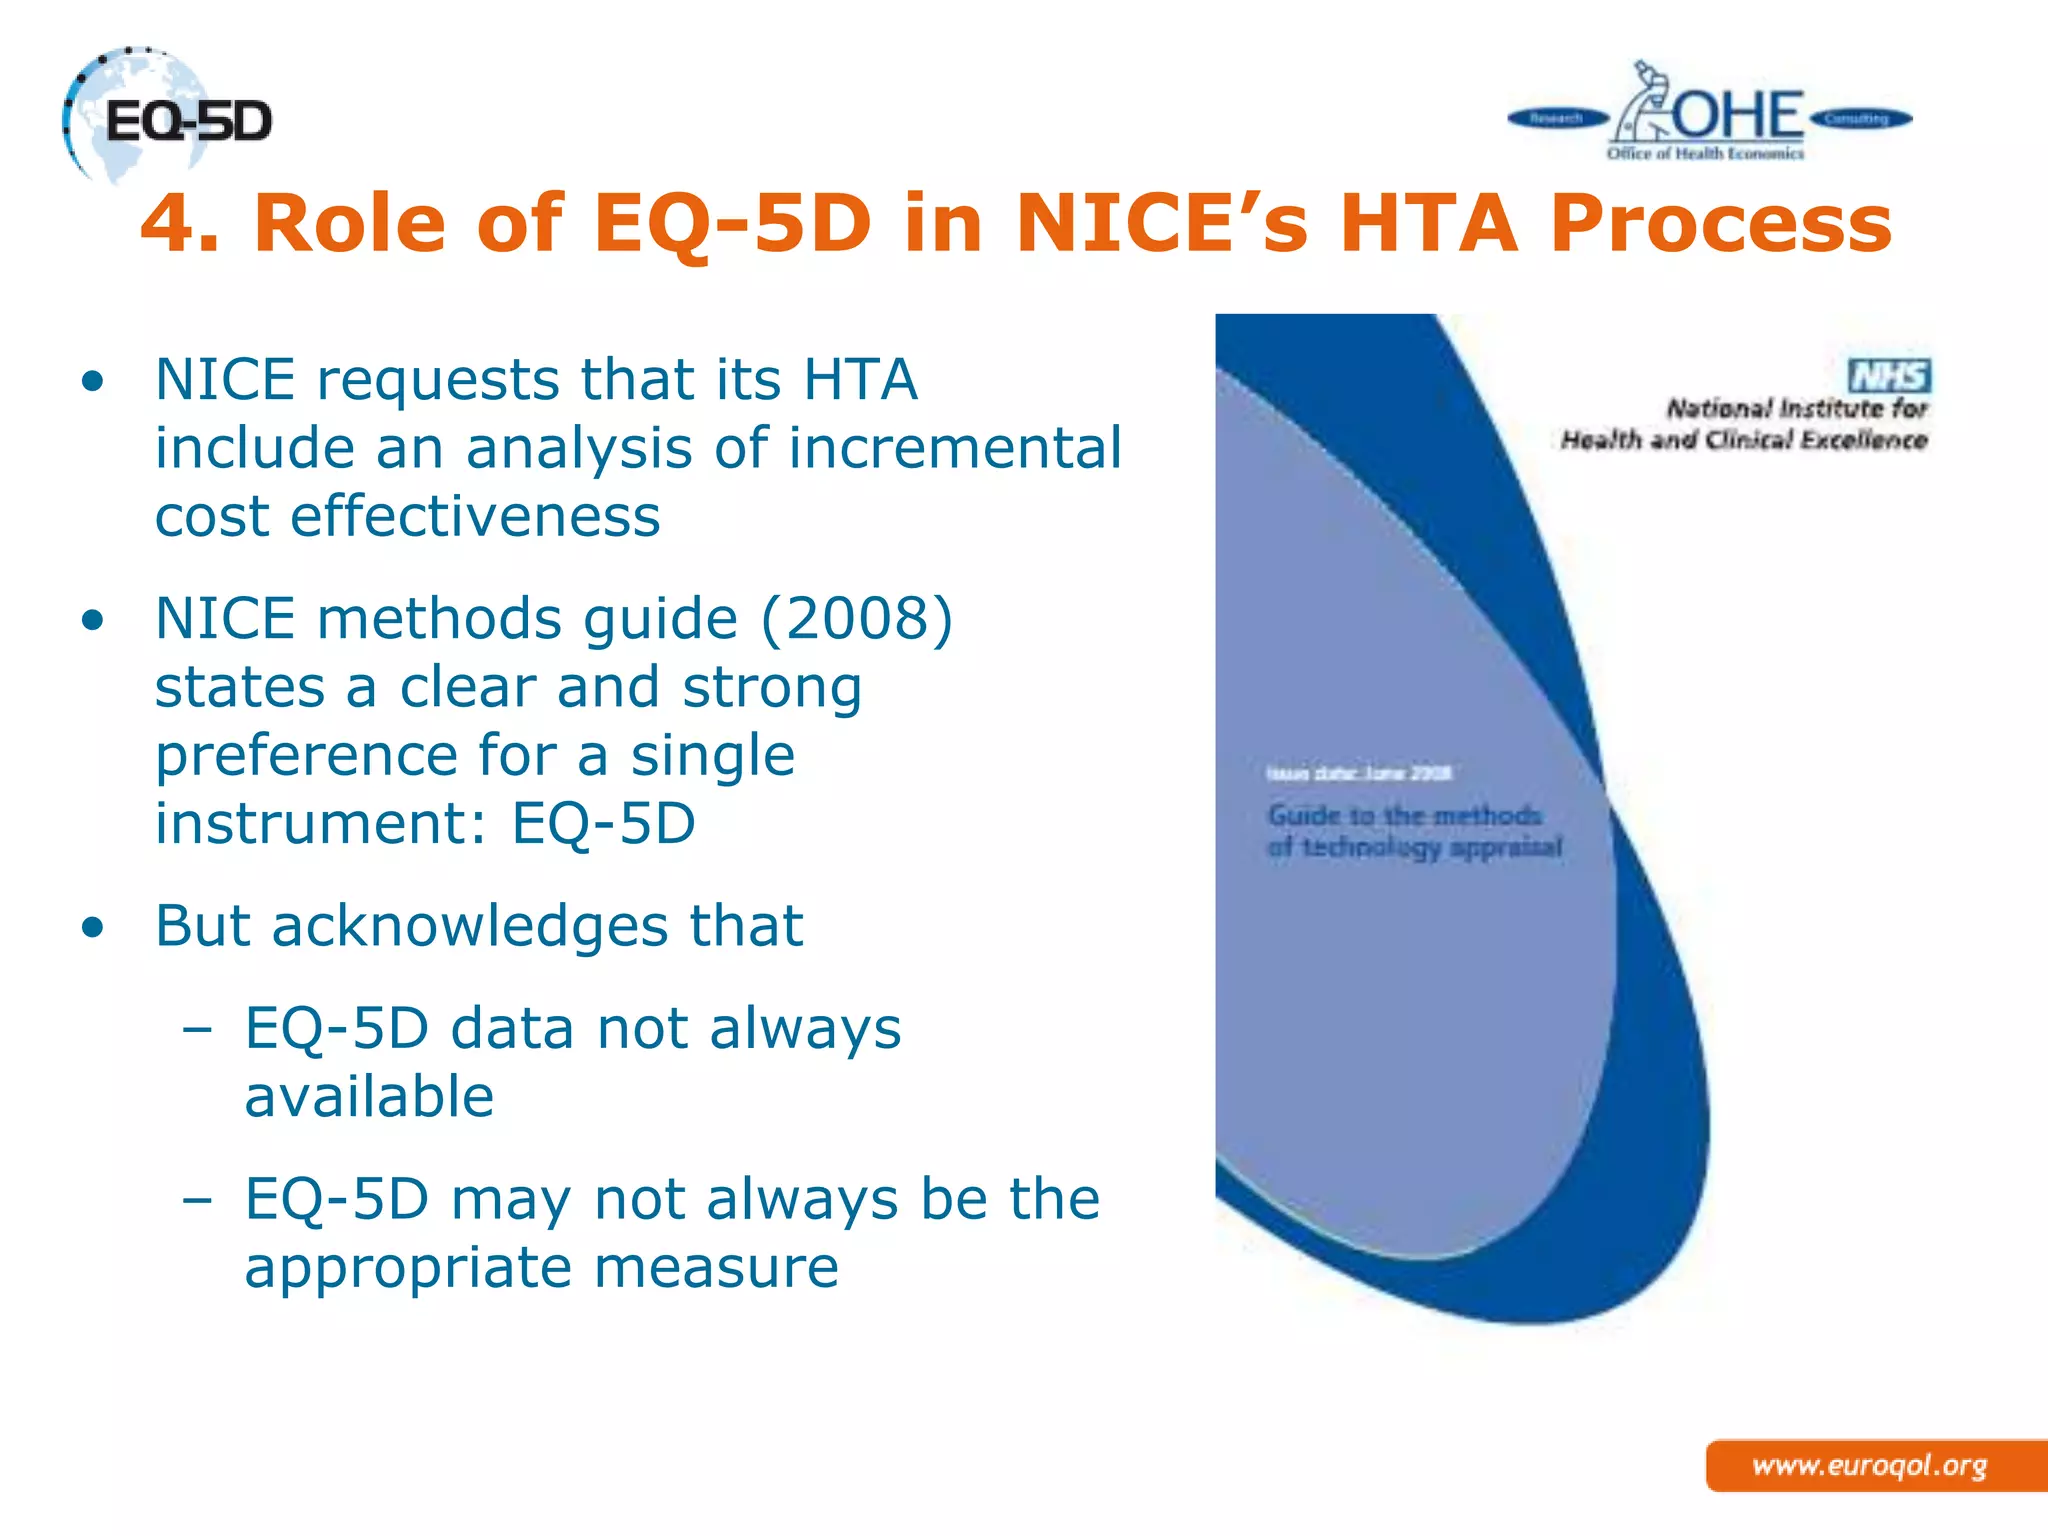
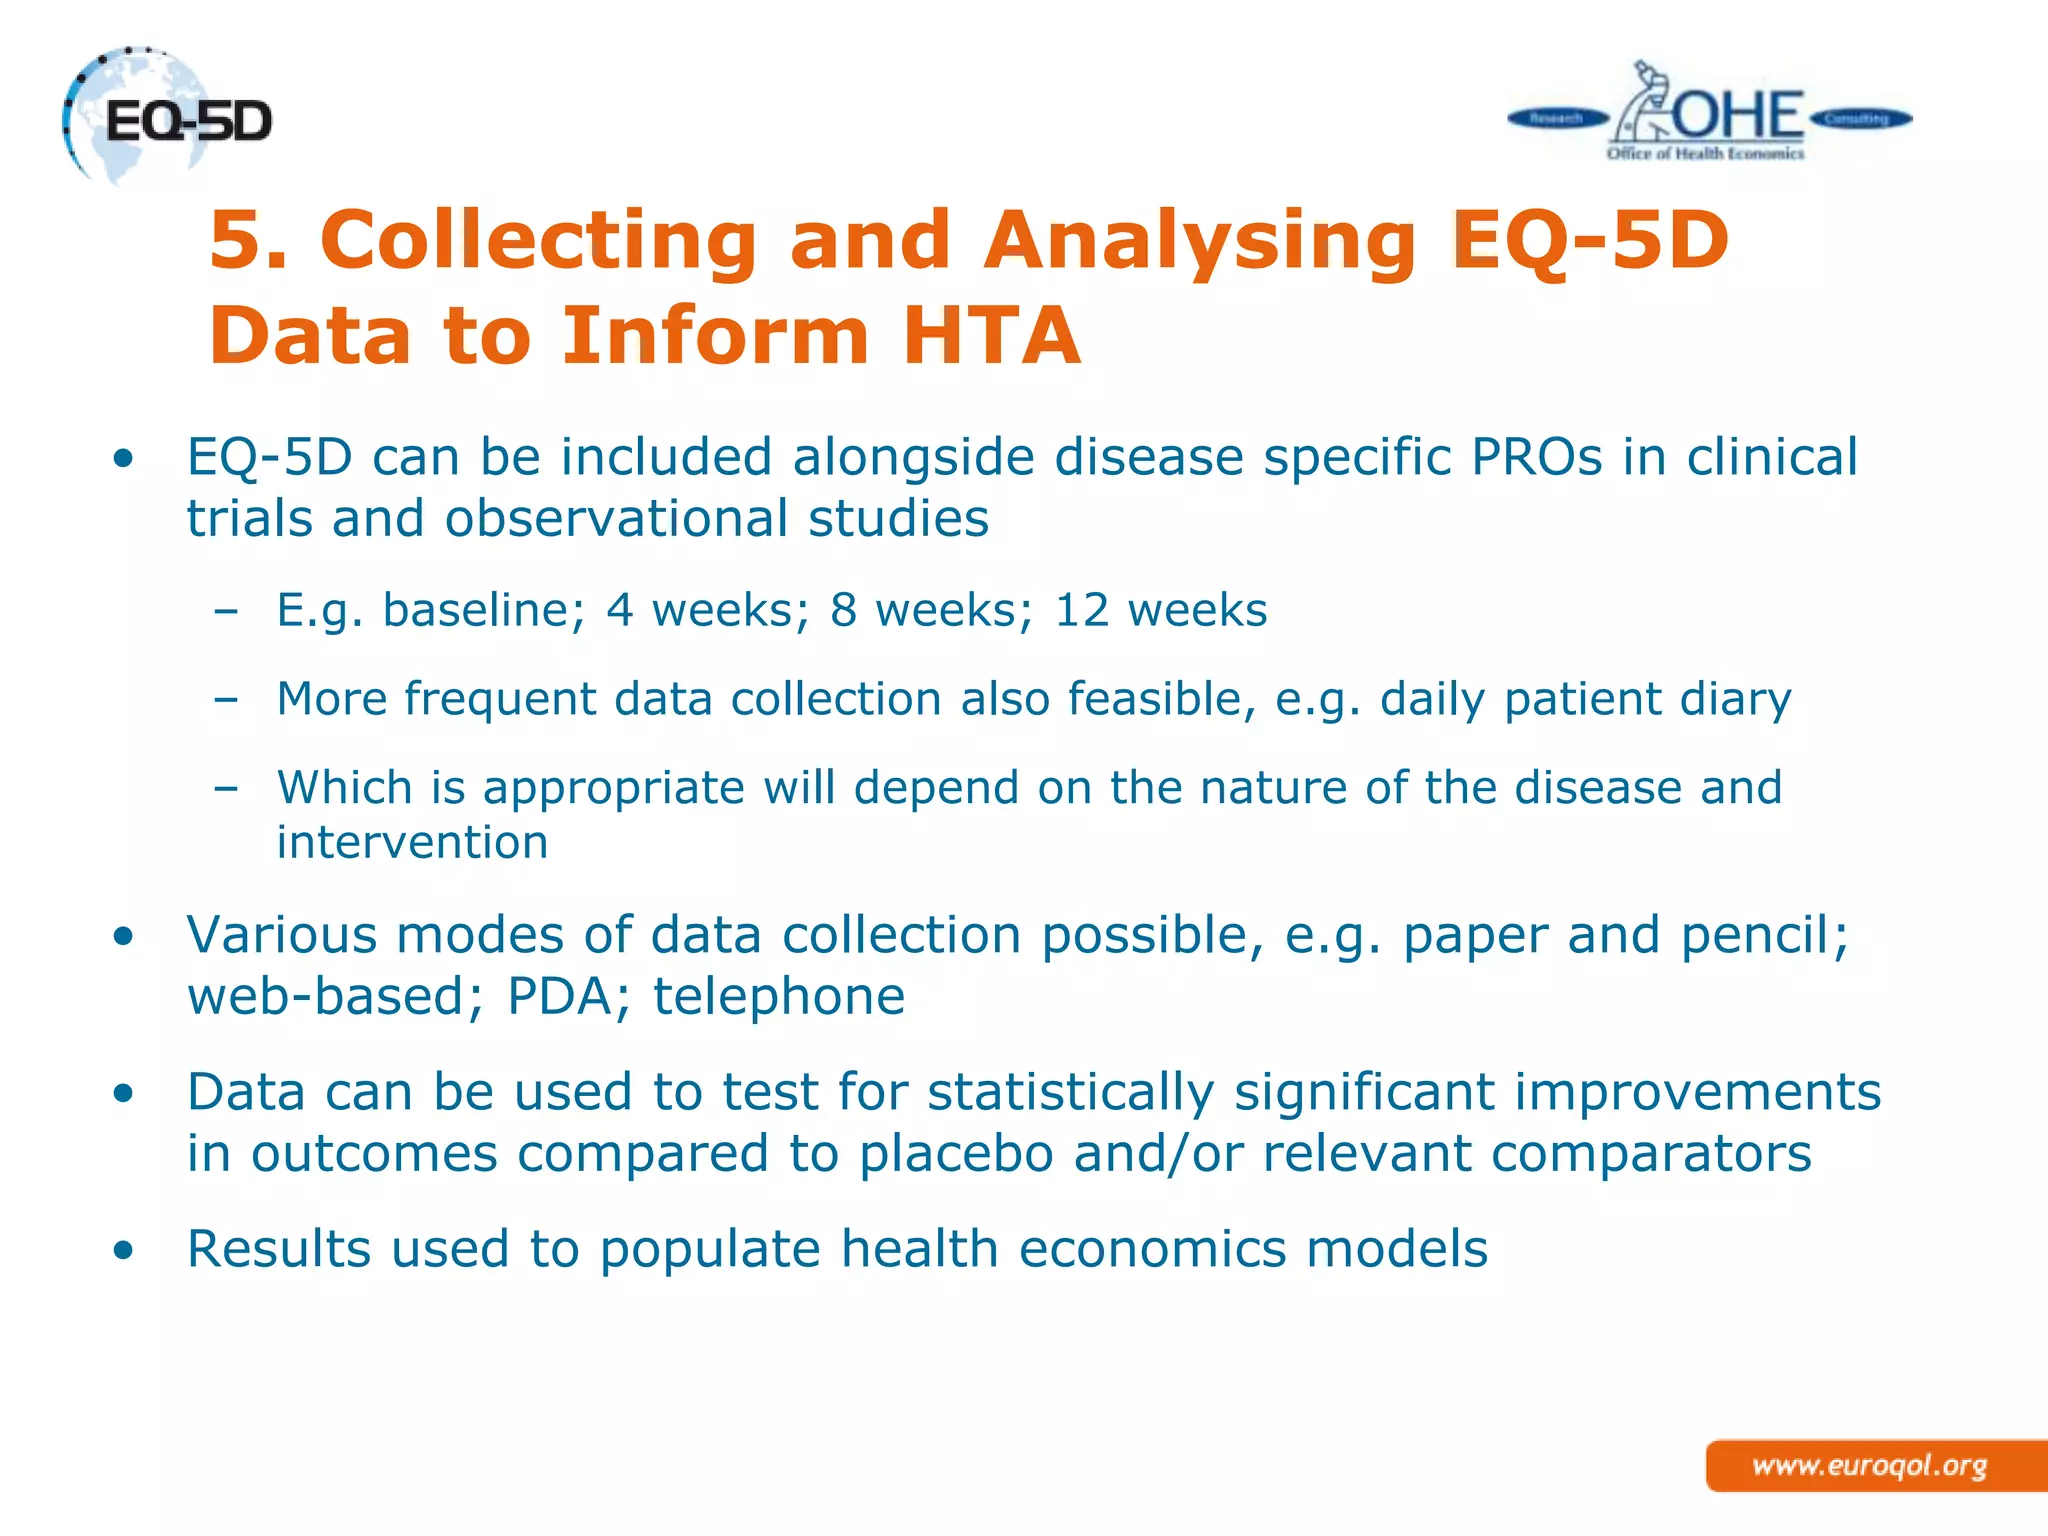
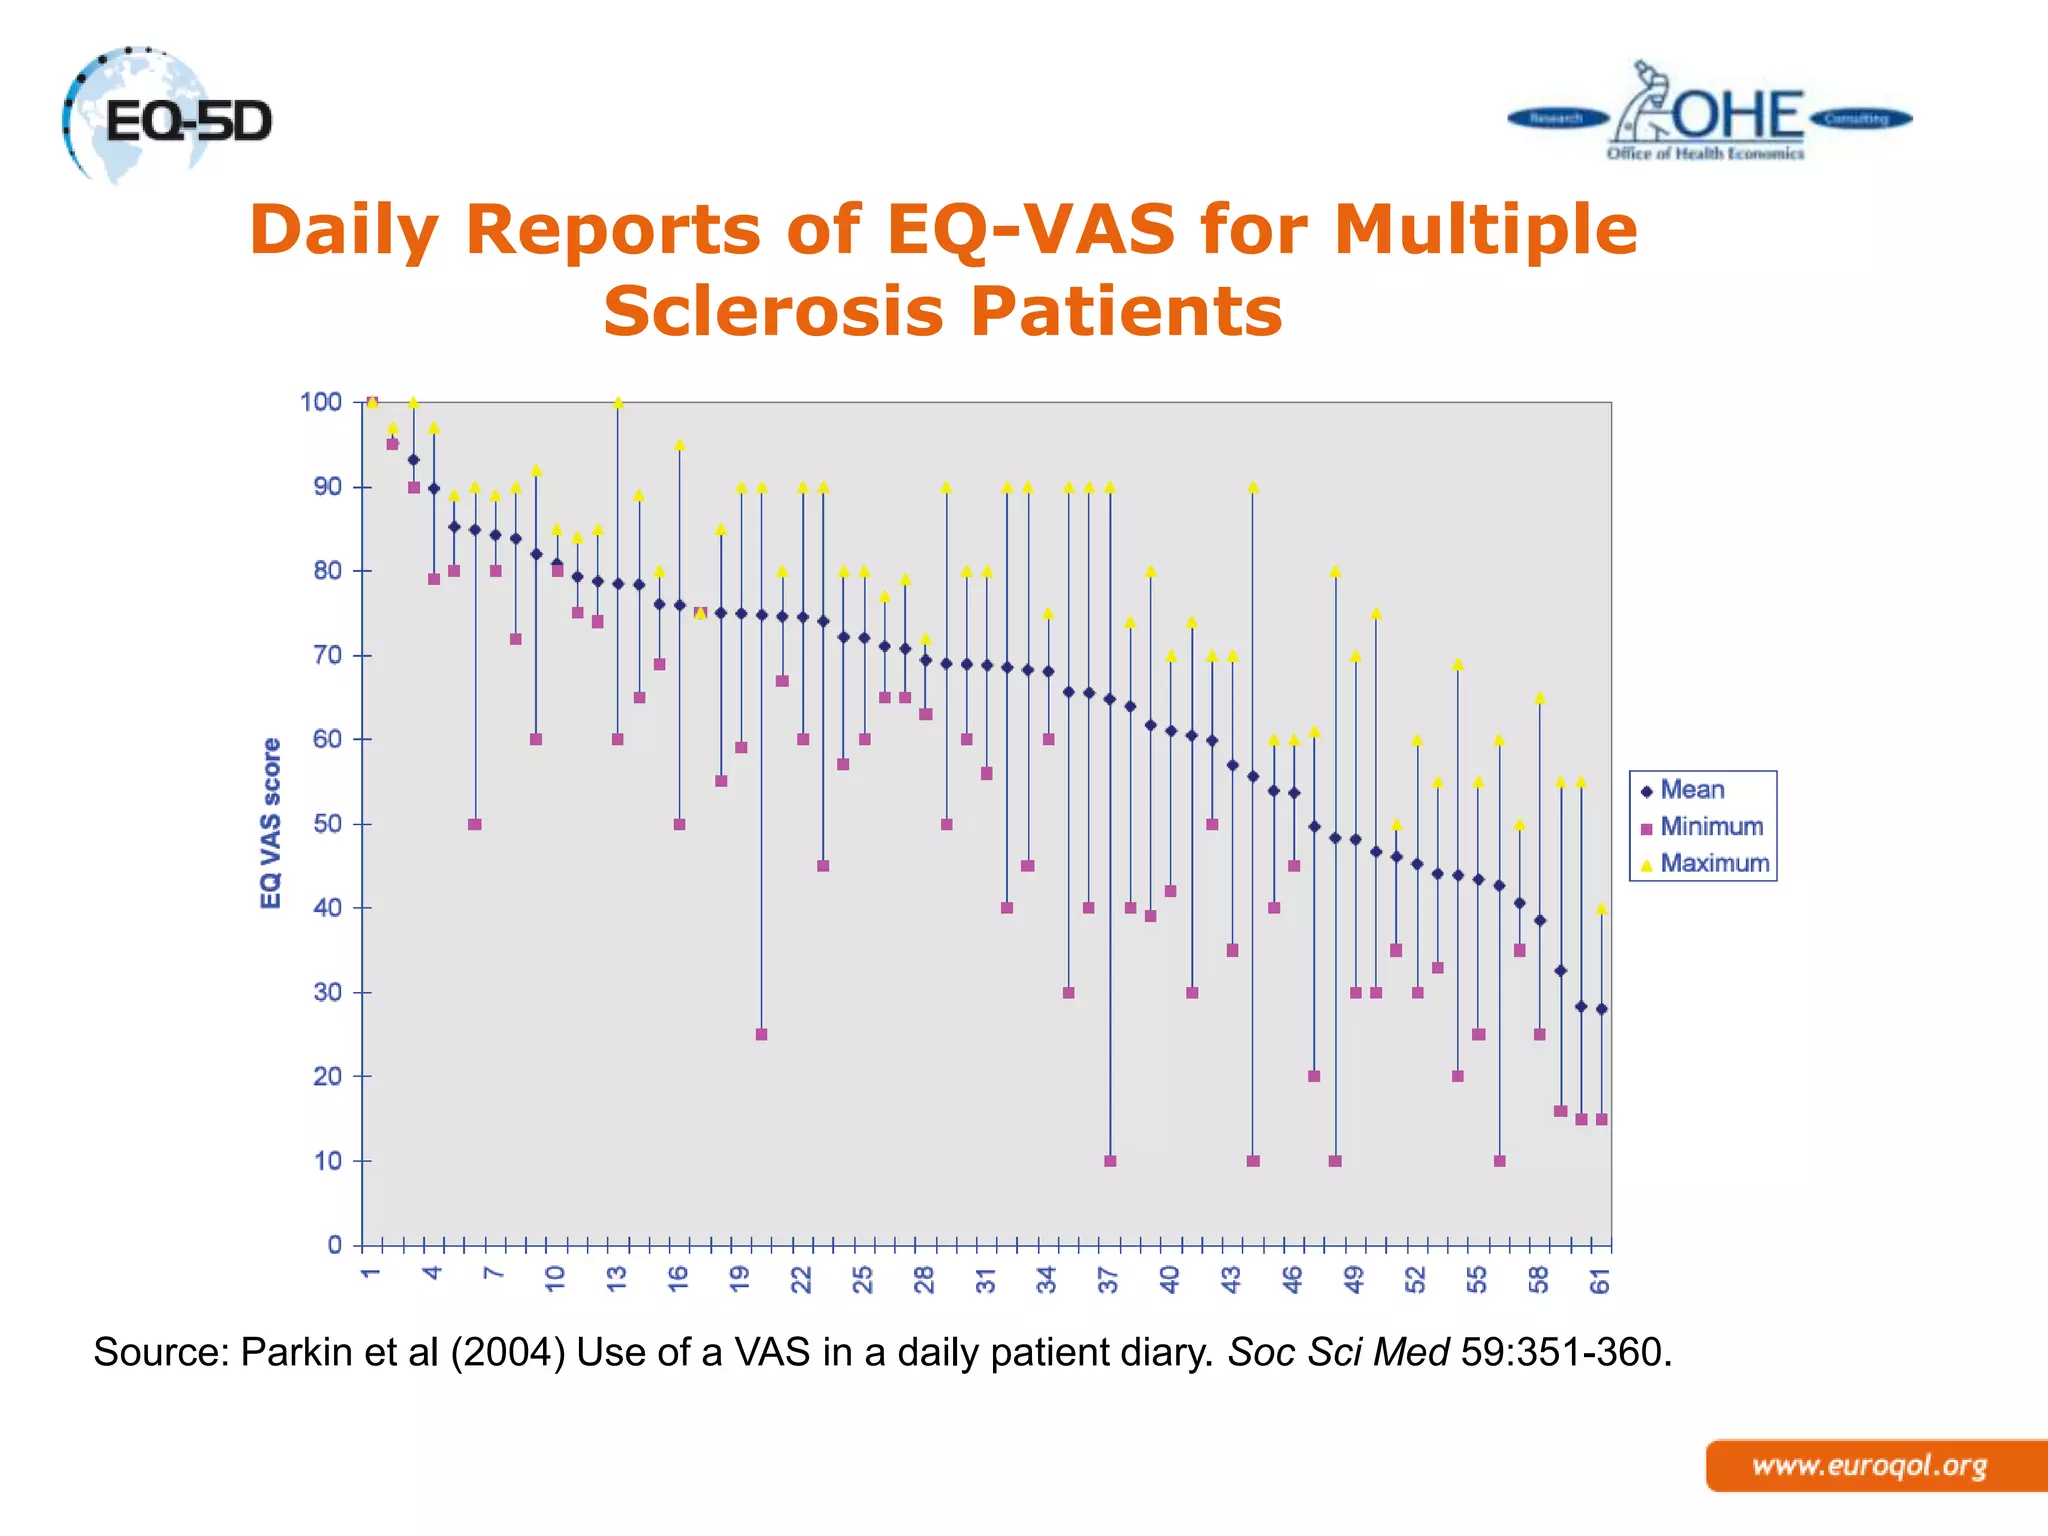


This document outlines how the National Institute for Health and Care Excellence (NICE) uses cost-effectiveness analysis to inform reimbursement decisions in the UK. It discusses NICE's process and how it generally accepts interventions with an incremental cost-effectiveness ratio of less than £20,000-30,000 per quality-adjusted life year (QALY). The document emphasizes the important role of the EQ-5D questionnaire in NICE's decisions by allowing comparison of health outcomes. It addresses issues like collecting EQ-5D data, mapping from other measures, and potential limitations of EQ-5D for certain conditions.


