JLL Columbus Office Employment Update February 2015
•
1 like•215 views

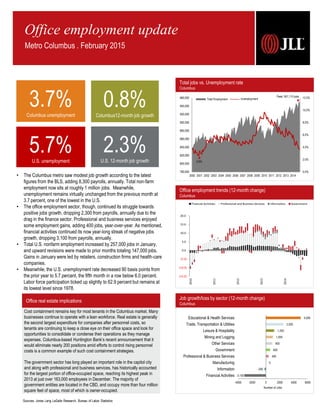
The Columbus metro saw modest job growth according to the latest figures from the BLS, adding 8,300 payrolls, annually. Meanwhile, unemployment remains virtually unchanged from the previous month at 3.7 percent, one of the lowest in the U.S.

Recommended
Recommended
More Related Content
What's hot
What's hot (17)
Viewers also liked
Viewers also liked (17)
Similar to JLL Columbus Office Employment Update February 2015
Similar to JLL Columbus Office Employment Update February 2015 (20)
More from Andrew Batson
More from Andrew Batson (20)
Recently uploaded
Recently uploaded (20)
JLL Columbus Office Employment Update February 2015
- 1. Office employment trends (12-month change) Columbus Total jobs vs. Unemployment rate Columbus Office employment update Metro Columbus . February 2015 Cost containment remains key for most tenants in the Columbus market. Many businesses continue to operate with a lean workforce. Real estate is generally the second largest expenditure for companies after personnel costs, so tenants are continuing to keep a close eye on their office space and look for opportunities to consolidate or condense their operations as they manage expenses. Columbus-based Huntington Bank’s recent announcement that it would eliminate nearly 200 positions amid efforts to control rising personnel costs is a common example of such cost containment strategies. The government sector has long played an important role in the capitol city and along with professional and business services, has historically accounted for the largest portion of office-occupied space, reaching its highest peak in 2013 at just over 163,000 employees in December. The majority of government entities are located in the CBD, and occupy more than four million square feet of space, most of which is owner-occupied. Office real estate implications Job growth/loss by sector (12-month change) Columbus -3,100 -200 0 400 600 900 1,000 1,200 2,500 5,000 -4000 -2000 0 2000 4000 6000 Financial Activities Information Manufacturing Professional & Business Services Government Other Services Mining and Logging Leisure & Hospitality Trade, Transportation & Utilities Educational & Health Services Number of Jobs 0.0% 2.0% 4.0% 6.0% 8.0% 10.0% 12.0% 780,000 800,000 820,000 840,000 860,000 880,000 900,000 920,000 940,000 960,000 2000 2001 2002 2003 2004 2005 2006 2007 2008 2009 2010 2011 2012 2013 2014 Peak: 951,110 jobs 2.6% Total Employment Unemployment Sources: Jones Lang LaSalle Research, Bureau of Labor Statistics 3.7%Columbus unemployment 0.8%Columbus12-month job growth 5.7%U.S. unemployment 2.3%U.S. 12-month job growth • The Columbus metro saw modest job growth according to the latest figures from the BLS, adding 8,300 payrolls, annually. Total non-farm employment now sits at roughly 1 million jobs. Meanwhile, unemployment remains virtually unchanged from the previous month at 3.7 percent, one of the lowest in the U.S. • The office employment sector, though, continued its struggle towards positive jobs growth, dropping 2,300 from payrolls, annually due to the drag in the finance sector. Professional and business services enjoyed some employment gains, adding 400 jobs, year-over-year. As mentioned, financial activities continued its now year-long streak of negative jobs growth, dropping 3,100 from payrolls, annually. • Total U.S. nonfarm employment increased by 257,000 jobs in January, and upward revisions were made to prior months totaling 147,000 jobs. Gains in January were led by retailers, construction firms and health-care companies. • Meanwhile, the U.S. unemployment rate decreased 90 basis points from the prior year to 5.7 percent, the fifth month in a row below 6.0 percent. Labor force participation ticked up slightly to 62.9 percent but remains at its lowest level since 1978. (15.0) (10.0) (5.0) 0.0 5.0 10.0 15.0 20.0 2010 2011 2012 2013 2014 Financial Activities Professional and Business Services Information Government
- 2. © 2015 Jones Lang LaSalle IP, Inc. All rights reserved. All information contained herein is from sources deemed reliable; however, no representation or warranty is made to the accuracy thereof. JLL Americas Research • Columbus Office Employment Update 2 December 2012 December 2013 December 2014 Total Non-farm Employment 979,400 3.1% 992,600 1.3% 1,000,900 0.8% Unemployment Rate 5.7% 5.9% 3.7% Columbus Supersectors December 2012 December 2013 December 2014 Mining, Logging and Construction 29,400 1.7% 32,100 9.2% 33,100 3.1% Manufacturing 67,300 2.7% 67,300 0.0% 67,300 0.0% Trade, Transportation, & Utilities 192,300 1.4% 195,400 1.6% 197,900 1.3% Information 17,700 4.7% 18,300 3.4% 18,100 -1.1% Financial Activities 74,400 3.9% 75,500 1.5% 72,400 -4.1% Professional & Business Services 165,300 5.3% 164,200 -0.7% 164,600 0.2% Educational & Health Services 137,900 2.4% 138,800 0.7% 143,800 3.6% Leisure & Hospitality 93,400 5.7% 97,500 4.4% 98,700 1.2% Other Services 37,700 6.8% 37,600 -0.3% 38,500 2.4% Government 164,000 1.4% 165,900 1.2% 166,500 0.4% News on the street Columbus businesses expanding, contracting, etc. Employment statistics Columbus Industry employment stratification Columbus First Merchants Corp. Ι Banks & Credit Unions: Expanding First Merchants Corp. (NASDAQ: FRME) , the operator of Commerce National Bank in Central Ohio, is expanding its area presence with an acquisition that continues a string of banking buyouts in the region. Muncie, Indiana-based First Merchants recently agreed to pay $14.5 million in cash for all outstanding shares of C Financial Corp., the parent of Dublin-based Cooper State Bank. The agreement follows four other Columbus-area acquisitions over the past year. Nationwide Mutual Insurance Co. Ι Property/Casualty Insurance Carriers: Consolidating Nationwide Mutual Insurance Co. will move 175 mortgage banking jobs from Des Moines, Iowa, to Central Ohio and fold the division into Nationwide Bank. The shift will take place by the end of 2016 and is part of Nationwide's efforts to streamline operations. The company has not decided where in Central Ohio the positions will be housed. Nationwide Bank, launched in 2006, is headquartered at the One Nationwide tower downtown. Status Solutions LLC Ι Consulting Services: Expanding Status Solutions LLC projects sales could increase by one-third next year as a growing list of new industries have begun to purchase its automated alert and self- service communications software packages. Status Solutions moved its executive offices into a 15,000-square-foot office at 999 County Line Road in Westerville, more than seven times the size of its original Westerville office and projects to add 30 new jobs over five years as well as a demonstration studio for its systems. Tim Hortons Ι Specialty Eateries: Contracting Tim Hortons is cutting jobs at its corporate headquarters in Canada as well as its U.S. headquarters in Dublin in the wake of its merger with Burger King. The statement didn't specify the number of cuts and company representatives declined to comment. The Oakville, Ontario-based coffee-and-doughnuts chain had about 120 workers in Dublin last year. According to officials, the cuts will allow the chain to be faster, more efficient and better positioned for continued success. Time Warner Cable Inc. Ι Wired Telecommunications Services: Expanding Time Warner Cable Inc. (NYSE: TWC) plans to add about 130 sales jobs in Central Ohio next year, following 200 additions in 2014. According to representatives, the growth in what it calls "inbound sales" – call center representatives who sell Internet, cable TV, phone and security services and provide customer services – is just one area where Time Warner is adding jobs. The cable and broadband provider has been growing its Ohio work force for the past few years. Wondersauce LLC Ι Advertising Agencies: Expanding New York-based digital creative agency Wondersauce LLC now has an office in Columbus and has landed fast-growing apparel merchant Homage LLC as its first client. The digital agency has 50 employees in New York and has hired six in Columbus with hopes of being at 12 workers by year-end. Its office will open in March and is located in the space above the Martini Modern Italian restaurant near the Short North. Cody Brooks Research Analyst tel +1 614 460 4444 Cody.Brooks@am.jll.com 65 E State Street, Suite 550 Columbus, OH 43215 www.jll.com/columbus Robert Kramp Senior Vice President – Americas Midwest & Great Lakes Research Director tel +1 312 228 2470 Robert.Kramp@am.jll.com 200 East Randolph Street, 47th Floor Chicago, IL 60601 www.us.joneslanglasalle.com/research Trade, transportation and Utilities, 197,900, 20% Government, 166,500, 17% Professional and Business Services, 164,600, 16% Educational and Health Services, 143,800, 14% Leisure and Hospitality, 98,700, 10% Financial Activities, 72,400, 7% Manufacturing, 67,300, 7% Other Services, 38,500, 4% Mining, Logging and construction, 33,100, 3% Information, 18,100, 2%