SlideShare a Scribd company logo
1 of 16
Download to read offline
February 2024 Monthly Snapshot
One-Year Change in One-Year Change in
Median Sales Price Single
Family
Median Sales Price
Condo/TIC/Coop
2
3
4
5
6
7
8
9
10
11
12
13
14
15
16
Monthly Indicators
+ 9.7% - 5.0% + 7.8%
One-Year Change in
U.S. existing-home sales grew 3.1% month-over-month to a seasonally
adjusted annual rate of 4.00 million, exceeding economists’ expectations and
marking the strongest sales pace since August 2023, according to the National
Association of REALTORS® (NAR). Falling interest rates late last year, coupled
with a recent uptick in inventory, helped existing-home sales to climb following
last month’s decline, with monthly gains reported in the Midwest, South, and
West regions.
New Listings were up 28.3 percent for single family homes and 18.2 percent for
Condo/TIC/Coop properties. Pending Sales increased 31.7 percent for single
family homes and 33.7 percent for Condo/TIC/Coop properties.
The Median Sales Price was up 9.7 percent to $1,580,000 for single family
homes but decreased 5.0 percent to $1,104,000 for Condo/TIC/Coop
properties. Months Supply of Inventory remained flat for single family units but
was up 12.9 percent for Condo/TIC/Coop units.
Total inventory heading into February stood at 1.01 million units, a 2% increase
from the previous month and a 3.1% increase from the same time last year, for
a 3 months’ supply at the current sales pace, according to NAR. Although
buyers may find additional options in their home search, inventory remains
below the 5-6 months’ supply of a balanced market, and demand is exceeding
supply. As a result, existing-home sales prices have continued to rise, climbing
5.1% year-over-year to $379,100.
Median Sales Price
All Property Types
Residential real estate activity in San Francisco County (Districts 1-10)
composed of single-family properties, townhomes and condominiums. Percent
changes are calculated using rounded figures.
Single Family Activity Overview
Months Supply of Inventory
For questions or more information, contact
communications@sfrealtors.com.
Current as of March 11, 2024. All data from the San Francisco Association of REALTORS® MLS. Report © 2024 ShowingTime Plus, LLC.
Condo/TIC/Coop Activity Overview
Inventory of Active Listings
% of Properties Sold Over List Price
% of List Price Received
Housing Affordability Ratio
All Properties Activity Overview
New Listings
Pending Sales
Sold Listings
Median Sales Price
Average Sales Price
Days on Market Until Sale
Activity by District
Single Family Activity Overview
Key metrics by report month and for year-to-date (YTD) starting from the first of the year.
Key Metrics Historical Sparkbars 2-2023 2-2024 Percent Change YTD 2023 YTD 2024 Percent Change
Current as of March 11, 2024. All data from the San Francisco Association of REALTORS® MLS. Report © 2024 ShowingTime Plus, LLC. | 2
Months Supply 1.5 1.5 0.0% -- -- --
Affordability Ratio 28 25 - 10.7%
% of List Price Received 103.7% 108.0% + 4.1% 103.5%
29
58.3% + 22.0%
+ 3.0%
25 - 13.8%
106.6%
% of Properties Sold Over List Price 51.5% 63.5% + 23.3% 47.8%
Active Listings 284 244 - 14.1% --
Avg. Sales Price $1,823,104 $2,041,045 + 12.0% $1,817,399
Days on Market 33 35 + 6.1% 41 44 + 7.3%
$2,122,826
-- --
Median Sales Price $1,440,000 $1,580,000 + 9.7% $1,400,000
Sold Listings 101 137 + 35.6% 201
New Listings 173 222 + 28.3% 341
Pending Sales 126 166 + 31.7% + 27.7%
213 272
+ 19.4%
407
228 + 13.4%
$1,577,500 + 12.7%
+ 16.8%
2-2021 2-2022 2-2023 2-2024
2-2021 2-2022 2-2023 2-2024
2-2021 2-2022 2-2023 2-2024
2-2021 2-2022 2-2023 2-2024
2-2021 2-2022 2-2023 2-2024
2-2021 2-2022 2-2023 2-2024
2-2021 2-2022 2-2023 2-2024
2-2021 2-2022 2-2023 2-2024
2-2021 2-2022 2-2023 2-2024
2-2021 2-2022 2-2023 2-2024
2-2021 2-2022 2-2023 2-2024
Condo/TIC/Coop Activity Overview
Key metrics by report month and for year-to-date (YTD) starting from the first of the year.
Key Metrics Historical Sparkbars 2-2023 2-2024 Percent Change YTD 2023 YTD 2024 Percent Change
Current as of March 11, 2024. All data from the San Francisco Association of REALTORS® MLS. Report © 2024 ShowingTime Plus, LLC. | 3
Months Supply 3.1 3.5 + 12.9% -- -- --
Affordability Ratio 40 40 0.0%
% of List Price Received 99.0% 100.6% + 1.6% 98.5%
43
28.7% + 18.1%
+ 0.6%
40 - 7.0%
99.1%
% of Properties Sold Over List Price 28.2% 34.8% + 23.4% 24.3%
Active Listings 726 659 - 9.2% --
Avg. Sales Price $1,296,409 $1,332,638 + 2.8% $1,282,814
Days on Market 59 52 - 11.9% 71
$1,100,000 + 3.3%
+ 7.2%
66 - 7.0%
$1,374,840
-- --
Sold Listings 142 179 + 26.1% 247 294 + 19.0%
Median Sales Price $1,162,500 $1,104,000 - 5.0% $1,065,000
+ 9.3%
Pending Sales 175 234 + 33.7% 298 401 + 34.6%
New Listings 313 370 + 18.2% 656 717
2-2021 2-2022 2-2023 2-2024
2-2021 2-2022 2-2023 2-2024
2-2021 2-2022 2-2023 2-2024
2-2021 2-2022 2-2023 2-2024
2-2021 2-2022 2-2023 2-2024
2-2021 2-2022 2-2023 2-2024
2-2021 2-2022 2-2023 2-2024
2-2021 2-2022 2-2023 2-2024
2-2021 2-2022 2-2023 2-2024
2-2021 2-2022 2-2023 2-2024
2-2021 2-2022 2-2023 2-2024
New Listings
New Listings
Single
Family
Year-Over-Year
Change
Condo/TIC/
Coop
Year-Over-Year
Change
Mar-2023 242 -29.2% 362 -41.1%
Apr-2023 238 -27.7% 327 -39.7%
May-2023 277 -8.0% 320 -38.0%
Jun-2023 217 -31.8% 314 -30.4%
Jul-2023 190 -21.5% 243 -36.6%
Aug-2023 252 +5.4% 290 -6.1%
Sep-2023 373 +1.6% 552 -3.8%
Oct-2023 246 +1.7% 308 -18.5%
Nov-2023 102 -32.9% 153 0.0%
Dec-2023 48 -33.3% 82 +5.1%
Jan-2024 185 +10.1% 347 +1.2%
Feb-2024 222 +28.3% 370 +18.2%
12-Month Avg 216 -12.0% 306 -21.2%
Historical New Listings by Month
Current as of March 11, 2024. All data from the San Francisco Association of REALTORS® MLS. Report © 2024 ShowingTime Plus, LLC. | 4
A count of the properties that have been newly listed on the market in a given month.
288
535
173
313
222
370
Single Family Condo/TIC/Coop
February
0
200
400
600
800
1-2005 1-2006 1-2007 1-2008 1-2009 1-2010 1-2011 1-2012 1-2013 1-2014 1-2015 1-2016 1-2017 1-2018 1-2019 1-2020 1-2021 1-2022 1-2023 1-2024
Single Family Condo/TIC/Coop
516
1,007
341
656
407
717
Single Family Condo/TIC/Coop
Year to Date
2022 2023 2024
+ 18.2%
- 41.5%
+ 28.3%
- 39.9% - 34.9%
+ 19.4%
- 33.9% + 9.3%
2022 2023 2024 2022 2023 2024 2022 2023 2024
+ 14.7% + 2.4% - 3.3%
+ 6.4%
Pending Sales
Pending Sales
Single
Family
Year-Over-Year
Change
Condo/TIC/
Coop
Year-Over-Year
Change
Mar-2023 168 -41.5% 244 -44.2%
Apr-2023 186 -30.9% 234 -31.8%
May-2023 209 -16.1% 211 -36.4%
Jun-2023 193 -2.0% 194 -25.4%
Jul-2023 131 -27.6% 157 -29.3%
Aug-2023 148 -18.2% 176 -24.1%
Sep-2023 174 -7.9% 163 -23.5%
Oct-2023 211 +8.2% 187 -15.4%
Nov-2023 153 -7.8% 151 -5.6%
Dec-2023 94 -19.0% 140 +14.8%
Jan-2024 106 +21.8% 167 +35.8%
Feb-2024 166 +31.7% 234 +33.7%
12-Month Avg 162 -13.6% 188 -20.5%
Historical Pending Sales by Month
A count of the properties on which offers have been accepted in a given month.
Current as of March 11, 2024. All data from the San Francisco Association of REALTORS® MLS. Report © 2024 ShowingTime Plus, LLC. | 5
214
287
126
175
166
234
Single Family Condo/TIC/Coop
February
0
100
200
300
400
500
600
1-2005 1-2006 1-2007 1-2008 1-2009 1-2010 1-2011 1-2012 1-2013 1-2014 1-2015 1-2016 1-2017 1-2018 1-2019 1-2020 1-2021 1-2022 1-2023 1-2024
Single Family Condo/TIC/Coop
359
538
213
298
272
401
Single Family Condo/TIC/Coop
Year to Date
2022 2023 2024
+ 33.7%
- 39.0%
+ 31.7%
- 41.1% - 44.6%
+ 27.7%
- 40.7% + 34.6%
2022 2023 2024 2022 2023 2024 2022 2023 2024
- 5.3% - 9.1% - 20.1%
- 24.7%
Sold Listings
Sold Listings
Single
Family
Year-Over-Year
Change
Condo/TIC/
Coop
Year-Over-Year
Change
Mar-2023 151 -41.2% 248 -37.1%
Apr-2023 174 -32.3% 217 -43.2%
May-2023 189 -33.0% 232 -37.0%
Jun-2023 205 -17.7% 208 -32.7%
Jul-2023 159 -12.6% 166 -29.4%
Aug-2023 151 -20.5% 160 -32.5%
Sep-2023 145 -19.4% 170 -19.0%
Oct-2023 201 +4.7% 190 -15.2%
Nov-2023 193 +3.8% 154 -25.6%
Dec-2023 121 -21.4% 164 +11.6%
Jan-2024 91 -9.0% 115 +9.5%
Feb-2024 137 +35.6% 179 +26.1%
12-Month Avg 160 -17.7% 184 -25.6%
Historical Sold Listings by Month
A count of the actual sales that closed in a given month.
Current as of March 11, 2024. All data from the San Francisco Association of REALTORS® MLS. Report © 2024 ShowingTime Plus, LLC. | 6
159
250
101
142
137
179
Single Family Condo/TIC/Coop
February
0
100
200
300
400
500
1-2005 1-2006 1-2007 1-2008 1-2009 1-2010 1-2011 1-2012 1-2013 1-2014 1-2015 1-2016 1-2017 1-2018 1-2019 1-2020 1-2021 1-2022 1-2023 1-2024
Single Family Condo/TIC/Coop
289
436
201
247
228
294
Single Family Condo/TIC/Coop
Year to Date
2022 2023 2024
+ 26.1%
- 43.2%
+ 35.6%
- 36.5% - 43.3%
+ 13.4%
- 30.4% + 19.0%
2022 2023 2024 2022 2023 2024 2022 2023 2024
- 2.5% - 10.8% - 20.4%
- 10.1%
Median Sales Price
Median Sales Price
Single
Family
Year-Over-Year
Change
Condo/TIC/
Coop
Year-Over-Year
Change
Mar-2023 $1,695,000 -15.3% $1,060,000 -12.2%
Apr-2023 $1,560,500 -23.9% $1,175,000 -14.2%
May-2023 $1,650,000 -17.8% $1,062,500 -12.6%
Jun-2023 $1,600,000 -14.9% $1,117,500 -9.9%
Jul-2023 $1,450,000 -13.0% $1,135,000 -5.2%
Aug-2023 $1,575,000 -1.9% $1,084,193 +8.4%
Sep-2023 $1,580,000 -4.2% $1,050,000 -9.5%
Oct-2023 $1,650,000 -1.2% $1,155,000 -3.8%
Nov-2023 $1,527,000 +1.8% $1,115,053 -0.9%
Dec-2023 $1,450,000 -5.7% $995,000 +4.7%
Jan-2024 $1,575,000 +15.2% $1,075,000 +7.5%
Feb-2024 $1,580,000 +9.7% $1,104,000 -5.0%
12-Month Avg* $1,575,000 -10.0% $1,100,000 -8.1%
Historical Median Sales Price by Month
Point at which half of the sales sold for more and half sold for less, not accounting for seller concessions, in a given month.
* Median Sales Price for all properties from March 2023 through February 2024. This is not the
average of the individual figures above.
Current as of March 11, 2024. All data from the San Francisco Association of REALTORS® MLS. Report © 2024 ShowingTime Plus, LLC. | 7
$1,930,000
$1,227,500
$1,440,000
$1,162,500
$1,580,000
$1,104,000
Single Family Condo/TIC/Coop
February
$500,000
$750,000
$1,000,000
$1,250,000
$1,500,000
$1,750,000
$2,000,000
$2,250,000
1-2005 1-2006 1-2007 1-2008 1-2009 1-2010 1-2011 1-2012 1-2013 1-2014 1-2015 1-2016 1-2017 1-2018 1-2019 1-2020 1-2021 1-2022 1-2023 1-2024
Single Family Condo/TIC/Coop
$1,820,000
$1,176,500
$1,400,000
$1,065,000
$1,577,500
$1,100,000
Single Family Condo/TIC/Coop
Year to Date
2022 2023 2024
- 5.0%
- 5.3%
+ 9.7%
- 25.4% - 9.5%
+ 12.7%
- 23.1% + 3.3%
2022 2023 2024 2022 2023 2024 2022 2023 2024
+ 17.0% + 13.8% + 3.7%
+ 2.6%
Average Sales Price
Average Sales
Price
Single
Family
Year-Over-Year
Change
Condo/TIC/
Coop
Year-Over-Year
Change
Mar-2023 $2,272,702 -10.3% $1,207,124 -14.5%
Apr-2023 $2,209,070 -12.0% $1,370,225 -7.1%
May-2023 $2,141,045 -11.2% $1,171,111 -16.5%
Jun-2023 $2,009,398 -14.7% $1,296,055 -5.1%
Jul-2023 $1,835,021 -10.9% $1,213,203 -17.3%
Aug-2023 $2,141,891 +10.0% $1,211,778 +3.1%
Sep-2023 $2,012,607 +7.0% $1,342,704 -0.0%
Oct-2023 $2,312,677 +4.6% $1,265,490 -10.8%
Nov-2023 $2,014,207 +6.3% $1,241,516 -10.9%
Dec-2023 $1,973,556 +5.5% $1,166,449 +6.2%
Jan-2024 $2,245,947 +24.0% $1,440,162 +13.9%
Feb-2024 $2,041,045 +12.0% $1,332,638 +2.8%
12-Month Avg* $2,100,969 -3.6% $1,265,840 -7.4%
Historical Average Sales Price by Month
Average sales price for all closed sales, not accounting for seller concessions, in a given month.
* Avg. Sales Price for all properties from March 2023 through February 2024. This is not the
average of the individual figures above.
Current as of March 11, 2024. All data from the San Francisco Association of REALTORS® MLS. Report © 2024 ShowingTime Plus, LLC. | 8
$2,417,245
$1,398,389
$1,823,104
$1,296,409
$2,041,045
$1,332,638
Single Family Condo/TIC/Coop
February
$500,000
$1,000,000
$1,500,000
$2,000,000
$2,500,000
$3,000,000
1-2005 1-2006 1-2007 1-2008 1-2009 1-2010 1-2011 1-2012 1-2013 1-2014 1-2015 1-2016 1-2017 1-2018 1-2019 1-2020 1-2021 1-2022 1-2023 1-2024
Single Family Condo/TIC/Coop
$2,216,852
$1,361,221
$1,817,399
$1,282,814
$2,122,826
$1,374,840
Single Family Condo/TIC/Coop
Year to Date
2022 2023 2024
+ 2.8%
- 7.3%
+ 12.0%
- 24.6% - 5.8%
+ 16.8%
- 18.0% + 7.2%
2022 2023 2024 2022 2023 2024 2022 2023 2024
+ 7.1% + 5.4% + 6.4%
+ 4.0%
Days on Market Until Sale
Days on Market
Until Sale
Single
Family
Year-Over-Year
Change
Condo/TIC/
Coop
Year-Over-Year
Change
Mar-2023 32 +100.0% 58 +70.6%
Apr-2023 31 +93.8% 56 +75.0%
May-2023 28 +33.3% 52 +40.5%
Jun-2023 26 +52.9% 50 +28.2%
Jul-2023 26 +23.8% 54 +10.2%
Aug-2023 36 +38.5% 57 +14.0%
Sep-2023 30 +7.1% 54 -6.9%
Oct-2023 23 -17.9% 47 +9.3%
Nov-2023 31 -11.4% 57 +11.8%
Dec-2023 40 +5.3% 77 +4.1%
Jan-2024 58 +16.0% 87 0.0%
Feb-2024 35 +6.1% 52 -11.9%
12-Month Avg* 31 +26.5% 57 +25.3%
Historical Days on Market Until Sale by Month
Average number of days between when a property is listed and when an offer is accepted in a given month.
* Days on Market for all properties from March 2023 through February 2024. This is not the
average of the individual figures above.
Current as of March 11, 2024. All data from the San Francisco Association of REALTORS® MLS. Report © 2024 ShowingTime Plus, LLC. | 9
22
36
33
59
35
52
Single Family Condo/TIC/Coop
February
0
20
40
60
80
100
120
1-2005 1-2006 1-2007 1-2008 1-2009 1-2010 1-2011 1-2012 1-2013 1-2014 1-2015 1-2016 1-2017 1-2018 1-2019 1-2020 1-2021 1-2022 1-2023 1-2024
Single Family Condo/TIC/Coop
31
50
41
71
44
66
Single Family Condo/TIC/Coop
Year to Date
2022 2023 2024
- 11.9%
+ 63.9%
+ 6.1%
+ 50.0% + 42.0%
+ 7.3%
+ 32.3% - 7.0%
2022 2023 2024 2022 2023 2024 2022 2023 2024
- 35.3% - 16.2% - 28.6%
- 45.5%
Inventory of Active Listings
Inventory of Active
Listings
Single
Family
Year-Over-Year
Change
Condo/TIC/
Coop
Year-Over-Year
Change
Mar-2023 319 +1.3% 774 -26.1%
Apr-2023 342 +1.8% 789 -29.0%
May-2023 356 +7.6% 807 -28.0%
Jun-2023 323 -13.9% 793 -28.1%
Jul-2023 314 -14.4% 765 -25.1%
Aug-2023 343 -2.6% 702 -21.7%
Sep-2023 483 -0.4% 979 -11.4%
Oct-2023 454 -4.2% 978 -10.8%
Nov-2023 339 -9.6% 813 -6.8%
Dec-2023 176 -18.5% 482 -7.8%
Jan-2024 215 -17.3% 584 -10.7%
Feb-2024 244 -14.1% 659 -9.2%
12-Month Avg* 326 -6.3% 760 -19.1%
Historical Inventory of Active Listings by Month
The number of properties available for sale in active status at the end of a given month.
* Active Listings for all properties from March 2023 through February 2024. This is not the
average of the individual figures above.
Current as of March 11, 2024. All data from the San Francisco Association of REALTORS® MLS. Report © 2024 ShowingTime Plus, LLC. | 10
299
992
284
726
244
659
Single Family Condo/TIC/Coop
February
0
500
1,000
1,500
2,000
2,500
1-2005 1-2006 1-2007 1-2008 1-2009 1-2010 1-2011 1-2012 1-2013 1-2014 1-2015 1-2016 1-2017 1-2018 1-2019 1-2020 1-2021 1-2022 1-2023 1-2024
Single Family Condo/TIC/Coop
2022 2023 2024
- 9.2%
- 26.8%
- 14.1%
- 5.0%
2022 2023 2024
- 21.5% - 19.8%
% of Properties Sold Over List Price
% of Properties
Sold Over List Price
Single
Family
Year-Over-Year
Change
Condo/TIC/
Coop
Year-Over-Year
Change
Mar-2023 62.3% -27.9% 36.3% -37.5%
Apr-2023 62.1% -30.0% 32.7% -47.9%
May-2023 63.0% -27.5% 40.9% -26.0%
Jun-2023 69.8% -19.1% 37.5% -34.6%
Jul-2023 66.7% -15.1% 30.7% -22.5%
Aug-2023 64.2% -14.7% 31.3% -15.6%
Sep-2023 69.0% +2.7% 31.2% +0.6%
Oct-2023 67.7% +5.6% 34.2% -8.8%
Nov-2023 62.2% +8.2% 33.1% +8.9%
Dec-2023 54.5% +11.9% 22.1% +41.7%
Jan-2024 50.5% +14.8% 19.1% +0.5%
Feb-2024 63.5% +23.3% 34.8% +23.4%
12-Month Avg 63.7% -13.5% 32.9% -26.5%
Historical % of Properties Sold Over List Price by Month
Percentage found when dividing the number of properties sold by properties sold over its original list price, not accounting for seller
concessions.
* % of Properties Sold Over List Price for all properties from March 2023 through February 2024.
This is not the average of the individual figures above.
Current as of March 11, 2024. All data from the San Francisco Association of REALTORS® MLS. Report © 2024 ShowingTime Plus, LLC. | 11
86.8%
58.4%
51.5%
28.2%
63.5%
34.8%
Single Family Condo/TIC/Coop
February
0.0%
20.0%
40.0%
60.0%
80.0%
100.0%
1-2005 1-2006 1-2007 1-2008 1-2009 1-2010 1-2011 1-2012 1-2013 1-2014 1-2015 1-2016 1-2017 1-2018 1-2019 1-2020 1-2021 1-2022 1-2023 1-2024
Single Family Condo/TIC/Coop
81.7%
50.0%
47.8%
24.3%
58.3%
28.7%
Single Family Condo/TIC/Coop
Year to Date
2022 2023 2024
+ 23.4%
- 51.7%
+ 23.3%
- 40.7% - 51.4%
+ 22.0%
- 41.5% + 18.1%
2022 2023 2024 2022 2023 2024 2022 2023 2024
+ 27.5% + 29.7% + 74.8%
+ 65.4%
% of List Price Received
% of List Price
Received
Single
Family
Year-Over-Year
Change
Condo/TIC/
Coop
Year-Over-Year
Change
Mar-2023 107.9% -11.5% 100.4% -5.6%
Apr-2023 107.1% -13.0% 99.9% -6.8%
May-2023 108.2% -9.5% 100.1% -5.5%
Jun-2023 108.6% -7.0% 100.6% -4.5%
Jul-2023 108.3% -2.4% 99.6% -1.9%
Aug-2023 107.2% -1.0% 99.5% -1.2%
Sep-2023 107.6% -0.8% 99.0% -1.6%
Oct-2023 107.9% +0.7% 99.7% -0.7%
Nov-2023 106.0% +1.0% 100.1% +0.9%
Dec-2023 104.3% +1.4% 99.0% +0.9%
Jan-2024 104.6% +1.4% 96.7% -1.2%
Feb-2024 108.0% +4.1% 100.6% +1.6%
12-Month Avg* 107.3% -4.9% 99.7% -3.2%
Historical % of List Price Received by Month
Percentage found when dividing a property’s sales price by its most recent list price, then taking the average for all properties sold in a given
month, not accounting for seller concessions.
* % of List Price Received for all properties from March 2023 through February 2024. This is not
the average of the individual figures above.
Current as of March 11, 2024. All data from the San Francisco Association of REALTORS® MLS. Report © 2024 ShowingTime Plus, LLC. | 12
121.2%
106.1%
103.7%
99.0%
108.0%
100.6%
Single Family Condo/TIC/Coop
February
119.5%
103.9%
103.5%
98.5%
106.6%
99.1%
Single Family Condo/TIC/Coop
Year to Date
90.0%
100.0%
110.0%
120.0%
130.0%
1-2005 1-2006 1-2007 1-2008 1-2009 1-2010 1-2011 1-2012 1-2013 1-2014 1-2015 1-2016 1-2017 1-2018 1-2019 1-2020 1-2021 1-2022 1-2023 1-2024
Single Family Condo/TIC/Coop
2022 2023 2024
+ 1.6%
- 6.7%
+ 4.1%
- 14.4%
2022 2023 2024
+ 10.5% + 5.4%
2022 2023 2024
+ 0.6%
- 5.2%
+ 3.0%
- 13.4%
2022 2023 2024
+ 11.2% + 4.2%
Housing Affordability Ratio
Housing
Affordability Ratio
Single
Family
Year-Over-Year
Change
Condo/TIC/
Coop
Year-Over-Year
Change
Mar-2023 25 +4.2% 44 -2.2%
Apr-2023 26 +23.8% 40 +8.1%
May-2023 25 +13.6% 43 +2.4%
Jun-2023 25 +8.7% 41 +2.5%
Jul-2023 27 0.0% 39 -9.3%
Aug-2023 24 -14.3% 40 -21.6%
Sep-2023 24 0.0% 41 +5.1%
Oct-2023 22 -4.3% 35 -5.4%
Nov-2023 25 -7.4% 38 -5.0%
Dec-2023 28 +3.7% 46 -6.1%
Jan-2024 26 -16.1% 42 -12.5%
Feb-2024 25 -10.7% 40 0.0%
12-Month Avg* 25 -1.9% 41 -5.5%
Historical Housing Affordability Ratio by Month
This index measures housing affordability for the region. For example, an index of 120 means the median household income is 120% of what is
necessary to qualify for the median-priced home under prevailing interest rates. A higher number means greater affordability.
* Affordability Ratio for all properties from March 2023 through February 2024. This is not the
average of the individual figures above.
Current as of March 11, 2024. All data from the San Francisco Association of REALTORS® MLS. Report © 2024 ShowingTime Plus, LLC. | 13
27
49
28
40
25
40
Single Family Condo/TIC/Coop
February
20
40
60
80
100
1-2005 1-2006 1-2007 1-2008 1-2009 1-2010 1-2011 1-2012 1-2013 1-2014 1-2015 1-2016 1-2017 1-2018 1-2019 1-2020 1-2021 1-2022 1-2023 1-2024
Single Family Condo/TIC/Coop
2022 2023 2024
0.0%
- 18.4%
- 10.7%
+ 3.7%
2022 2023 2024
- 18.2% - 7.5%
28
51
29
43
25
40
Single Family Condo/TIC/Coop
Year to Date
2022 2023 2024
- 7.0%
- 15.7%
- 13.8%
+ 3.6%
2022 2023 2024
- 17.6% - 8.9%
Months Supply of Inventory
Months Supply of
Inventory
Single
Family
Year-Over-Year
Change
Condo/TIC/
Coop
Year-Over-Year
Change
Mar-2023 1.8 +38.5% 3.5 +20.7%
Apr-2023 2.0 +42.9% 3.7 +15.6%
May-2023 2.1 +50.0% 4.0 +21.2%
Jun-2023 1.9 +18.8% 4.0 +17.6%
Jul-2023 1.9 +18.8% 4.0 +25.0%
Aug-2023 2.2 +37.5% 3.8 +31.0%
Sep-2023 3.1 +34.8% 5.4 +45.9%
Oct-2023 2.8 +21.7% 5.5 +41.0%
Nov-2023 2.1 +10.5% 4.6 +39.4%
Dec-2023 1.1 0.0% 2.7 +35.0%
Jan-2024 1.4 +7.7% 3.2 +18.5%
Feb-2024 1.5 0.0% 3.5 +12.9%
12-Month Avg* 2.0 +25.8% 4.0 +27.3%
Historical Months Supply of Inventory by Month
The inventory of homes for sale at the end of a given month, divided by the average monthly pending sales from the last 12 months.
* Months Supply for all properties from March 2023 through February 2024. This is not the
average of the individual figures above.
Current as of March 11, 2024. All data from the San Francisco Association of REALTORS® MLS. Report © 2024 ShowingTime Plus, LLC. | 14
1.2
2.7
1.5
3.1
1.5
3.5
Single Family Condo/TIC/Coop
February
0.0
2.0
4.0
6.0
8.0
10.0
12.0
1-2005 1-2006 1-2007 1-2008 1-2009 1-2010 1-2011 1-2012 1-2013 1-2014 1-2015 1-2016 1-2017 1-2018 1-2019 1-2020 1-2021 1-2022 1-2023 1-2024
Single Family Condo/TIC/Coop
2022 2023 2024
+ 12.9%
+ 14.8%
0.0%
+ 25.0%
2022 2023 2024
- 29.4% - 42.6%
All Properties Activity Overview
Key metrics by report month and for year-to-date (YTD) starting from the first of the year.
Key Metrics Historical Sparkbars 2-2023 2-2024 Percent Change YTD 2023 YTD 2024 Percent Change
Current as of March 11, 2024. All data from the San Francisco Association of REALTORS® MLS. Report © 2024 ShowingTime Plus, LLC. | 15
Months Supply 2.4 2.6 + 8.3% -- -- --
Affordability Ratio 31 27 - 12.9%
% of List Price Received 101.0% 103.8% + 2.8% 100.7%
31
42.0% + 20.0%
+ 1.7%
26 - 16.1%
102.4%
% of Properties Sold Over List Price 38.1% 47.8% + 25.5% 35.0%
Active Listings 1,037 922 - 11.1% --
Avg. Sales Price $1,512,802 $1,637,826 + 8.3% $1,518,153
Days on Market 49 44 - 10.2% 58
$1,333,000 + 6.6%
+ 11.6%
56 - 3.4%
$1,694,865
-- --
Sold Listings 244 319 + 30.7% 451 530 + 17.5%
Median Sales Price $1,263,500 $1,362,500 + 7.8% $1,250,000
+ 12.2%
Pending Sales 304 407 + 33.9% 516 684 + 32.6%
New Listings 496 600 + 21.0% 1,013 1,137
2-2021 2-2022 2-2023 2-2024
2-2021 2-2022 2-2023 2-2024
2-2021 2-2022 2-2023 2-2024
2-2021 2-2022 2-2023 2-2024
2-2021 2-2022 2-2023 2-2024
2-2021 2-2022 2-2023 2-2024
2-2021 2-2022 2-2023 2-2024
2-2021 2-2022 2-2023 2-2024
2-2021 2-2022 2-2023 2-2024
2-2021 2-2022 2-2023 2-2024
2-2021 2-2022 2-2023 2-2024
Activity by District
SF District 1: Northwest (Sea Cliff, Lake, Jordan Park / Laurel Heights, Outer Richmond, Central Richmond, Inner Richmond, Lone Mountain)
SF District 2: Central West (Outer Sunset, Central Sunset, Inner Sunset, Outer Parkside, Parkside, Inner Parkside, Golden Gate Heights)
SF District 3: Southwest (Pine Lake Park, Lake Shore, Merced Manor, Stonestown, Lakeside, Merced Heights, Ingleside, Ingleside Heights, Oceanview)
SF District 4: Twin Peaks W (Forest Hill (& Ext), W Portal, St Francis Wd, Balboa Terr, Mt Dav Manor, Ingleside Terr, Monterey Hts, Wstwd Pk & H'lnds, Shrwd Fst, Miraloma Pk, Dmnd Hts, Mdtwn Terr)
SF District 5: Central (Haight Ashbury, Cole Vly / Prnssus Hts, Clarndn Hts, Corona Hts, Twin Pks, Glen Pk, Noe Vly, Eureka Vly / Dolores Hts, Mission Dolores, Duboce Trngl, Buena Vista / Ashbury Hts)
SF District 6: Central North (Lower Pacific Heights, Anza Vista, Western Addition, North Panhandle, Alamo Square, Hayes Valley)
SF District 7: North (Marina, Cow Hollow, Presidio Heights, Pacific Heights)
SF District 8: Northeast (North Waterfront, North Beach, Russian Hill, Telegraph Hill, Nob Hill, Financial District / Barbary Coast, Downtown, Van Ness / Civic Center, Tenderloin)
SF District 9: Central East (Yerba Buena, South Beach, South of Market, Mission Bay, Inner Mission, Potrero Hill, Central Waterfront / Dogpatch, Bernal Heights)
SF District 10: Southeast (Outer Mission, Mission Terr, Excelsior, Portola, Bayview, Silver Terr, Hunters Pt, Candlestick Pt, Bayview Hts, Little Hollywood, Visitation Vly, Crocker Amazon)
2-2023 2-2024 + / – 2-2023 2-2024 + / – 2-2023 2-2024 + / – 2-2023 2-2024 + / – 2-2023 2-2024 + / –
Single Family
1 SF District 1 24 14 -41.7% 2 10 +400.0% $3,925,000 $1,550,000 -60.5% 40 19 -52.5% 1.5 0.9 -40.0%
2 SF District 2 33 35 +6.1% 16 25 +56.3% $1,627,000 $1,370,000 -15.8% 23 31 +34.8% 0.9 1.1 +22.2%
3 SF District 3 20 17 -15.0% 9 9 0.0% $1,205,000 $1,160,000 -3.7% 25 23 -8.0% 1.6 1.4 -12.5%
4 SF District 4 29 20 -31.0% 14 15 +7.1% $1,495,000 $1,850,200 +23.8% 34 37 +8.8% 1.2 0.9 -25.0%
5 SF District 5 29 39 +34.5% 18 24 +33.3% $2,715,361 $2,413,000 -11.1% 30 33 +10.0% 1.0 1.9 +90.0%
6 SF District 6 6 6 0.0% 1 3 +200.0% $1,350,000 $1,900,000 +40.7% 20 48 +140.0% 2.2 2.0 -9.1%
7 SF District 7 33 30 -9.1% 2 10 +400.0% $7,097,500 $4,100,000 -42.2% 35 33 -5.7% 4.7 3.3 -29.8%
8 SF District 8 9 9 0.0% 0 4 -- $0 $2,761,500 -- 0 15 -- 2.9 4.5 +55.2%
9 SF District 9 32 24 -25.0% 15 16 +6.7% $1,650,000 $1,527,250 -7.4% 45 31 -31.1% 1.7 1.5 -11.8%
10 SF District 10 69 50 -27.5% 24 21 -12.5% $972,500 $1,068,000 +9.8% 38 59 +55.3% 1.8 1.6 -11.1%
Condo/TIC/Coop
1 SF District 1 25 17 -32.0% 9 1 -88.9% $1,395,000 $800,000 -42.7% 54 148 +174.1% 1.9 1.8 -5.3%
2 SF District 2 16 10 -37.5% 7 3 -57.1% $1,050,000 $749,000 -28.7% 65 31 -52.3% 4.6 3.2 -30.4%
3 SF District 3 5 3 -40.0% 3 1 -66.7% $768,800 $1,000,000 +30.1% 22 13 -40.9% 1.7 1.4 -17.6%
4 SF District 4 12 4 -66.7% 2 4 +100.0% $945,000 $919,000 -2.8% 9 16 +77.8% 3.3 1.0 -69.7%
5 SF District 5 86 53 -38.4% 21 36 +71.4% $1,245,000 $1,357,500 +9.0% 47 24 -48.9% 2.0 1.6 -20.0%
6 SF District 6 56 44 -21.4% 16 12 -25.0% $1,335,000 $962,500 -27.9% 34 23 -32.4% 2.1 2.4 +14.3%
7 SF District 7 60 55 -8.3% 15 21 +40.0% $1,600,000 $1,720,000 +7.5% 24 19 -20.8% 2.4 2.8 +16.7%
8 SF District 8 156 172 +10.3% 24 33 +37.5% $920,000 $965,000 +4.9% 86 75 -12.8% 4.0 4.8 +20.0%
9 SF District 9 287 272 -5.2% 42 60 +42.9% $1,012,500 $1,125,000 +11.1% 79 73 -7.6% 3.9 4.7 +20.5%
10 SF District 10 23 29 +26.1% 3 8 +166.7% $900,000 $599,000 -33.4% 47 54 +14.9% 4.2 6.2 +47.6%
Key metrics by report month for the districts of San Francisco.
Current as of March 11, 2024. All data from the San Francisco Association of REALTORS® MLS. Report © 2024 ShowingTime Plus, LLC. | 16
Active Listings Sold Listings Median Sales Price Days on Market Months Supply

More Related Content

Similar to San Francisco Market Update -February 2024

Similar to San Francisco Market Update -February 2024 (20)

October 2023 Report: San Francisco Real Estate Market Insights
October 2023 Report: San Francisco Real Estate Market InsightsOctober 2023 Report: San Francisco Real Estate Market Insights
October 2023 Report: San Francisco Real Estate Market Insights
 
San Francisco June 2023 Market Report.pdf
San Francisco June 2023 Market Report.pdfSan Francisco June 2023 Market Report.pdf
San Francisco June 2023 Market Report.pdf
 
San Francisco Market Report March 2022
San Francisco Market Report March 2022San Francisco Market Report March 2022
San Francisco Market Report March 2022
 
San Francisco Market Report March 2021
San Francisco Market Report March 2021San Francisco Market Report March 2021
San Francisco Market Report March 2021
 
San Francisco Market Report February 2022
San Francisco Market Report February 2022San Francisco Market Report February 2022
San Francisco Market Report February 2022
 
San Francisco Market Report December 2022.pdf
San Francisco Market Report December 2022.pdfSan Francisco Market Report December 2022.pdf
San Francisco Market Report December 2022.pdf
 
San Francisco Market Report January 2022
San Francisco Market Report January 2022San Francisco Market Report January 2022
San Francisco Market Report January 2022
 
San Francisco Market Report July 2023.pdf
San Francisco Market Report July 2023.pdfSan Francisco Market Report July 2023.pdf
San Francisco Market Report July 2023.pdf
 
San Francisco Market Report April 2022.pdf
San Francisco Market Report April 2022.pdfSan Francisco Market Report April 2022.pdf
San Francisco Market Report April 2022.pdf
 
San Francisco Market Report September 2021
San Francisco Market Report September 2021San Francisco Market Report September 2021
San Francisco Market Report September 2021
 
San Francisco Market Report August 2021
San Francisco Market Report August 2021San Francisco Market Report August 2021
San Francisco Market Report August 2021
 
San Francisco Market Report February 2021
San Francisco Market Report February 2021San Francisco Market Report February 2021
San Francisco Market Report February 2021
 
San Francisco Market Report May 2021
San Francisco Market Report May 2021San Francisco Market Report May 2021
San Francisco Market Report May 2021
 
San Francisco Market Report June 2021
San Francisco Market Report June 2021San Francisco Market Report June 2021
San Francisco Market Report June 2021
 
San Francisco Market Report October 2022.pdf
San Francisco Market Report October 2022.pdfSan Francisco Market Report October 2022.pdf
San Francisco Market Report October 2022.pdf
 
San Francisco market focus report December 2019
San Francisco market focus report December 2019San Francisco market focus report December 2019
San Francisco market focus report December 2019
 
San Francisco Market Report October 2021
San Francisco Market Report October 2021San Francisco Market Report October 2021
San Francisco Market Report October 2021
 
San Francisco Market Report December 2020
San Francisco Market Report December 2020San Francisco Market Report December 2020
San Francisco Market Report December 2020
 
San Francisco Market Focus Report Jan 2020
San Francisco Market Focus Report Jan 2020San Francisco Market Focus Report Jan 2020
San Francisco Market Focus Report Jan 2020
 
San Francisco Market Report December 2021
San Francisco Market Report December 2021San Francisco Market Report December 2021
San Francisco Market Report December 2021
 

More from Ronny Budiutama (10)

2023 Annual San Francisco Housing Market
2023 Annual San Francisco Housing Market2023 Annual San Francisco Housing Market
2023 Annual San Francisco Housing Market
 
CA Weekly MLS Market Data Report - August 2023
CA Weekly MLS Market Data Report - August 2023CA Weekly MLS Market Data Report - August 2023
CA Weekly MLS Market Data Report - August 2023
 
Annual Report on the San Francisco County Housing Market.pdf
Annual Report on the San Francisco County Housing Market.pdfAnnual Report on the San Francisco County Housing Market.pdf
Annual Report on the San Francisco County Housing Market.pdf
 
San Francisco Market Report November 2022.pdf
San Francisco Market Report November 2022.pdfSan Francisco Market Report November 2022.pdf
San Francisco Market Report November 2022.pdf
 
San Francisco Market Report September 2022.pdf
San Francisco Market Report September 2022.pdfSan Francisco Market Report September 2022.pdf
San Francisco Market Report September 2022.pdf
 
San Francisco Market Report August 2022.pdf
San Francisco Market Report August 2022.pdfSan Francisco Market Report August 2022.pdf
San Francisco Market Report August 2022.pdf
 
San Francisco Market Report July 2022.pdf
San Francisco Market Report July 2022.pdfSan Francisco Market Report July 2022.pdf
San Francisco Market Report July 2022.pdf
 
San Francisco Market Report June 2022.pdf
San Francisco Market Report June 2022.pdfSan Francisco Market Report June 2022.pdf
San Francisco Market Report June 2022.pdf
 
San Francisco Market Report May 2022.
San Francisco Market Report May 2022.San Francisco Market Report May 2022.
San Francisco Market Report May 2022.
 
San Francisco Market Report November 2021
San Francisco Market Report November 2021San Francisco Market Report November 2021
San Francisco Market Report November 2021
 

Recently uploaded

FGM Gloria Tuzla Istanbul - Listing Turkey
FGM Gloria Tuzla Istanbul - Listing TurkeyFGM Gloria Tuzla Istanbul - Listing Turkey
FGM Gloria Tuzla Istanbul - Listing Turkey
Listing Turkey
 

Recently uploaded (20)

Exploring Vernacular Architecture with Pune's Renowned Architects.pdf
Exploring Vernacular Architecture with Pune's Renowned Architects.pdfExploring Vernacular Architecture with Pune's Renowned Architects.pdf
Exploring Vernacular Architecture with Pune's Renowned Architects.pdf
 
indiafirstgreenfieldsmartcitydholeraPPT.pptx
indiafirstgreenfieldsmartcitydholeraPPT.pptxindiafirstgreenfieldsmartcitydholeraPPT.pptx
indiafirstgreenfieldsmartcitydholeraPPT.pptx
 
CBMSQUARE PVT LIMITED shd2idh2ih2hsk1js1j
CBMSQUARE PVT LIMITED shd2idh2ih2hsk1js1jCBMSQUARE PVT LIMITED shd2idh2ih2hsk1js1j
CBMSQUARE PVT LIMITED shd2idh2ih2hsk1js1j
 
Diego Marynberg: Mastering the Real Estate and Finance Landscape
Diego Marynberg: Mastering the Real Estate and Finance LandscapeDiego Marynberg: Mastering the Real Estate and Finance Landscape
Diego Marynberg: Mastering the Real Estate and Finance Landscape
 
Shapoorji Pallonji Helius Pune Brochure.pdf
Shapoorji Pallonji Helius Pune Brochure.pdfShapoorji Pallonji Helius Pune Brochure.pdf
Shapoorji Pallonji Helius Pune Brochure.pdf
 
Mahindra Kanakpura Road Bangalore.pdf.pdf
Mahindra Kanakpura Road Bangalore.pdf.pdfMahindra Kanakpura Road Bangalore.pdf.pdf
Mahindra Kanakpura Road Bangalore.pdf.pdf
 
Aishwaryam Codename Fashion At Tathawade, Pune - PDF.pdf
Aishwaryam Codename Fashion At Tathawade, Pune - PDF.pdfAishwaryam Codename Fashion At Tathawade, Pune - PDF.pdf
Aishwaryam Codename Fashion At Tathawade, Pune - PDF.pdf
 
Majestique-The-Crown-7-Loves-Chowk-Pune-Brochure
Majestique-The-Crown-7-Loves-Chowk-Pune-BrochureMajestique-The-Crown-7-Loves-Chowk-Pune-Brochure
Majestique-The-Crown-7-Loves-Chowk-Pune-Brochure
 
Are You Thinking About Selling Your House Soon? | KM Realty Group LLC
Are You Thinking About Selling Your House Soon?  | KM Realty Group LLCAre You Thinking About Selling Your House Soon?  | KM Realty Group LLC
Are You Thinking About Selling Your House Soon? | KM Realty Group LLC
 
Understanding the Dholera Price Trend An In-depth Analysis.pdf
Understanding the Dholera Price Trend An In-depth Analysis.pdfUnderstanding the Dholera Price Trend An In-depth Analysis.pdf
Understanding the Dholera Price Trend An In-depth Analysis.pdf
 
FGM Gloria Tuzla Istanbul - Listing Turkey
FGM Gloria Tuzla Istanbul - Listing TurkeyFGM Gloria Tuzla Istanbul - Listing Turkey
FGM Gloria Tuzla Istanbul - Listing Turkey
 
Experion Sector 99Noida E-Brochure.pdf.pdf
Experion Sector 99Noida E-Brochure.pdf.pdfExperion Sector 99Noida E-Brochure.pdf.pdf
Experion Sector 99Noida E-Brochure.pdf.pdf
 
Improvise, Adapt, Overcome - Sales Meeting, May '24
Improvise, Adapt, Overcome - Sales Meeting, May '24Improvise, Adapt, Overcome - Sales Meeting, May '24
Improvise, Adapt, Overcome - Sales Meeting, May '24
 
Purva Kensho Hills Sarjapur Bangalore.pdf.pdf
Purva Kensho Hills Sarjapur Bangalore.pdf.pdfPurva Kensho Hills Sarjapur Bangalore.pdf.pdf
Purva Kensho Hills Sarjapur Bangalore.pdf.pdf
 
Edenic Parth Kiona Hinjewadi, Pune - PDF.pdf
Edenic Parth Kiona Hinjewadi, Pune - PDF.pdfEdenic Parth Kiona Hinjewadi, Pune - PDF.pdf
Edenic Parth Kiona Hinjewadi, Pune - PDF.pdf
 
Godrej Shettigere - Embrace Tranquil Luxury in North Bangalore's Premier Vill...
Godrej Shettigere - Embrace Tranquil Luxury in North Bangalore's Premier Vill...Godrej Shettigere - Embrace Tranquil Luxury in North Bangalore's Premier Vill...
Godrej Shettigere - Embrace Tranquil Luxury in North Bangalore's Premier Vill...
 
Chennai top 10 builders | best builders in chennai
Chennai top 10 builders | best builders in chennaiChennai top 10 builders | best builders in chennai
Chennai top 10 builders | best builders in chennai
 
SVN Live 5.20.24 Weekly Property Broadcast
SVN Live 5.20.24 Weekly Property BroadcastSVN Live 5.20.24 Weekly Property Broadcast
SVN Live 5.20.24 Weekly Property Broadcast
 
Uk Property Rental Market Guide by region 2024
Uk Property Rental Market Guide by region 2024Uk Property Rental Market Guide by region 2024
Uk Property Rental Market Guide by region 2024
 
Investing-In-Commercial-Real-Estate-2024
Investing-In-Commercial-Real-Estate-2024Investing-In-Commercial-Real-Estate-2024
Investing-In-Commercial-Real-Estate-2024
 

San Francisco Market Update -February 2024

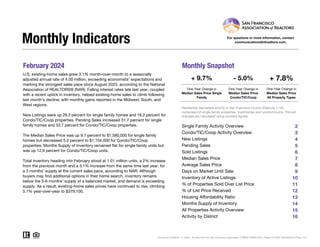
  • 1. February 2024 Monthly Snapshot One-Year Change in One-Year Change in Median Sales Price Single Family Median Sales Price Condo/TIC/Coop 2 3 4 5 6 7 8 9 10 11 12 13 14 15 16 Monthly Indicators + 9.7% - 5.0% + 7.8% One-Year Change in U.S. existing-home sales grew 3.1% month-over-month to a seasonally adjusted annual rate of 4.00 million, exceeding economists’ expectations and marking the strongest sales pace since August 2023, according to the National Association of REALTORS® (NAR). Falling interest rates late last year, coupled with a recent uptick in inventory, helped existing-home sales to climb following last month’s decline, with monthly gains reported in the Midwest, South, and West regions. New Listings were up 28.3 percent for single family homes and 18.2 percent for Condo/TIC/Coop properties. Pending Sales increased 31.7 percent for single family homes and 33.7 percent for Condo/TIC/Coop properties. The Median Sales Price was up 9.7 percent to $1,580,000 for single family homes but decreased 5.0 percent to $1,104,000 for Condo/TIC/Coop properties. Months Supply of Inventory remained flat for single family units but was up 12.9 percent for Condo/TIC/Coop units. Total inventory heading into February stood at 1.01 million units, a 2% increase from the previous month and a 3.1% increase from the same time last year, for a 3 months’ supply at the current sales pace, according to NAR. Although buyers may find additional options in their home search, inventory remains below the 5-6 months’ supply of a balanced market, and demand is exceeding supply. As a result, existing-home sales prices have continued to rise, climbing 5.1% year-over-year to $379,100. Median Sales Price All Property Types Residential real estate activity in San Francisco County (Districts 1-10) composed of single-family properties, townhomes and condominiums. Percent changes are calculated using rounded figures. Single Family Activity Overview Months Supply of Inventory For questions or more information, contact communications@sfrealtors.com. Current as of March 11, 2024. All data from the San Francisco Association of REALTORS® MLS. Report © 2024 ShowingTime Plus, LLC. Condo/TIC/Coop Activity Overview Inventory of Active Listings % of Properties Sold Over List Price % of List Price Received Housing Affordability Ratio All Properties Activity Overview New Listings Pending Sales Sold Listings Median Sales Price Average Sales Price Days on Market Until Sale Activity by District
  • 2. Single Family Activity Overview Key metrics by report month and for year-to-date (YTD) starting from the first of the year. Key Metrics Historical Sparkbars 2-2023 2-2024 Percent Change YTD 2023 YTD 2024 Percent Change Current as of March 11, 2024. All data from the San Francisco Association of REALTORS® MLS. Report © 2024 ShowingTime Plus, LLC. | 2 Months Supply 1.5 1.5 0.0% -- -- -- Affordability Ratio 28 25 - 10.7% % of List Price Received 103.7% 108.0% + 4.1% 103.5% 29 58.3% + 22.0% + 3.0% 25 - 13.8% 106.6% % of Properties Sold Over List Price 51.5% 63.5% + 23.3% 47.8% Active Listings 284 244 - 14.1% -- Avg. Sales Price $1,823,104 $2,041,045 + 12.0% $1,817,399 Days on Market 33 35 + 6.1% 41 44 + 7.3% $2,122,826 -- -- Median Sales Price $1,440,000 $1,580,000 + 9.7% $1,400,000 Sold Listings 101 137 + 35.6% 201 New Listings 173 222 + 28.3% 341 Pending Sales 126 166 + 31.7% + 27.7% 213 272 + 19.4% 407 228 + 13.4% $1,577,500 + 12.7% + 16.8% 2-2021 2-2022 2-2023 2-2024 2-2021 2-2022 2-2023 2-2024 2-2021 2-2022 2-2023 2-2024 2-2021 2-2022 2-2023 2-2024 2-2021 2-2022 2-2023 2-2024 2-2021 2-2022 2-2023 2-2024 2-2021 2-2022 2-2023 2-2024 2-2021 2-2022 2-2023 2-2024 2-2021 2-2022 2-2023 2-2024 2-2021 2-2022 2-2023 2-2024 2-2021 2-2022 2-2023 2-2024
  • 3. Condo/TIC/Coop Activity Overview Key metrics by report month and for year-to-date (YTD) starting from the first of the year. Key Metrics Historical Sparkbars 2-2023 2-2024 Percent Change YTD 2023 YTD 2024 Percent Change Current as of March 11, 2024. All data from the San Francisco Association of REALTORS® MLS. Report © 2024 ShowingTime Plus, LLC. | 3 Months Supply 3.1 3.5 + 12.9% -- -- -- Affordability Ratio 40 40 0.0% % of List Price Received 99.0% 100.6% + 1.6% 98.5% 43 28.7% + 18.1% + 0.6% 40 - 7.0% 99.1% % of Properties Sold Over List Price 28.2% 34.8% + 23.4% 24.3% Active Listings 726 659 - 9.2% -- Avg. Sales Price $1,296,409 $1,332,638 + 2.8% $1,282,814 Days on Market 59 52 - 11.9% 71 $1,100,000 + 3.3% + 7.2% 66 - 7.0% $1,374,840 -- -- Sold Listings 142 179 + 26.1% 247 294 + 19.0% Median Sales Price $1,162,500 $1,104,000 - 5.0% $1,065,000 + 9.3% Pending Sales 175 234 + 33.7% 298 401 + 34.6% New Listings 313 370 + 18.2% 656 717 2-2021 2-2022 2-2023 2-2024 2-2021 2-2022 2-2023 2-2024 2-2021 2-2022 2-2023 2-2024 2-2021 2-2022 2-2023 2-2024 2-2021 2-2022 2-2023 2-2024 2-2021 2-2022 2-2023 2-2024 2-2021 2-2022 2-2023 2-2024 2-2021 2-2022 2-2023 2-2024 2-2021 2-2022 2-2023 2-2024 2-2021 2-2022 2-2023 2-2024 2-2021 2-2022 2-2023 2-2024
  • 4. New Listings New Listings Single Family Year-Over-Year Change Condo/TIC/ Coop Year-Over-Year Change Mar-2023 242 -29.2% 362 -41.1% Apr-2023 238 -27.7% 327 -39.7% May-2023 277 -8.0% 320 -38.0% Jun-2023 217 -31.8% 314 -30.4% Jul-2023 190 -21.5% 243 -36.6% Aug-2023 252 +5.4% 290 -6.1% Sep-2023 373 +1.6% 552 -3.8% Oct-2023 246 +1.7% 308 -18.5% Nov-2023 102 -32.9% 153 0.0% Dec-2023 48 -33.3% 82 +5.1% Jan-2024 185 +10.1% 347 +1.2% Feb-2024 222 +28.3% 370 +18.2% 12-Month Avg 216 -12.0% 306 -21.2% Historical New Listings by Month Current as of March 11, 2024. All data from the San Francisco Association of REALTORS® MLS. Report © 2024 ShowingTime Plus, LLC. | 4 A count of the properties that have been newly listed on the market in a given month. 288 535 173 313 222 370 Single Family Condo/TIC/Coop February 0 200 400 600 800 1-2005 1-2006 1-2007 1-2008 1-2009 1-2010 1-2011 1-2012 1-2013 1-2014 1-2015 1-2016 1-2017 1-2018 1-2019 1-2020 1-2021 1-2022 1-2023 1-2024 Single Family Condo/TIC/Coop 516 1,007 341 656 407 717 Single Family Condo/TIC/Coop Year to Date 2022 2023 2024 + 18.2% - 41.5% + 28.3% - 39.9% - 34.9% + 19.4% - 33.9% + 9.3% 2022 2023 2024 2022 2023 2024 2022 2023 2024 + 14.7% + 2.4% - 3.3% + 6.4%
  • 5. Pending Sales Pending Sales Single Family Year-Over-Year Change Condo/TIC/ Coop Year-Over-Year Change Mar-2023 168 -41.5% 244 -44.2% Apr-2023 186 -30.9% 234 -31.8% May-2023 209 -16.1% 211 -36.4% Jun-2023 193 -2.0% 194 -25.4% Jul-2023 131 -27.6% 157 -29.3% Aug-2023 148 -18.2% 176 -24.1% Sep-2023 174 -7.9% 163 -23.5% Oct-2023 211 +8.2% 187 -15.4% Nov-2023 153 -7.8% 151 -5.6% Dec-2023 94 -19.0% 140 +14.8% Jan-2024 106 +21.8% 167 +35.8% Feb-2024 166 +31.7% 234 +33.7% 12-Month Avg 162 -13.6% 188 -20.5% Historical Pending Sales by Month A count of the properties on which offers have been accepted in a given month. Current as of March 11, 2024. All data from the San Francisco Association of REALTORS® MLS. Report © 2024 ShowingTime Plus, LLC. | 5 214 287 126 175 166 234 Single Family Condo/TIC/Coop February 0 100 200 300 400 500 600 1-2005 1-2006 1-2007 1-2008 1-2009 1-2010 1-2011 1-2012 1-2013 1-2014 1-2015 1-2016 1-2017 1-2018 1-2019 1-2020 1-2021 1-2022 1-2023 1-2024 Single Family Condo/TIC/Coop 359 538 213 298 272 401 Single Family Condo/TIC/Coop Year to Date 2022 2023 2024 + 33.7% - 39.0% + 31.7% - 41.1% - 44.6% + 27.7% - 40.7% + 34.6% 2022 2023 2024 2022 2023 2024 2022 2023 2024 - 5.3% - 9.1% - 20.1% - 24.7%
  • 6. Sold Listings Sold Listings Single Family Year-Over-Year Change Condo/TIC/ Coop Year-Over-Year Change Mar-2023 151 -41.2% 248 -37.1% Apr-2023 174 -32.3% 217 -43.2% May-2023 189 -33.0% 232 -37.0% Jun-2023 205 -17.7% 208 -32.7% Jul-2023 159 -12.6% 166 -29.4% Aug-2023 151 -20.5% 160 -32.5% Sep-2023 145 -19.4% 170 -19.0% Oct-2023 201 +4.7% 190 -15.2% Nov-2023 193 +3.8% 154 -25.6% Dec-2023 121 -21.4% 164 +11.6% Jan-2024 91 -9.0% 115 +9.5% Feb-2024 137 +35.6% 179 +26.1% 12-Month Avg 160 -17.7% 184 -25.6% Historical Sold Listings by Month A count of the actual sales that closed in a given month. Current as of March 11, 2024. All data from the San Francisco Association of REALTORS® MLS. Report © 2024 ShowingTime Plus, LLC. | 6 159 250 101 142 137 179 Single Family Condo/TIC/Coop February 0 100 200 300 400 500 1-2005 1-2006 1-2007 1-2008 1-2009 1-2010 1-2011 1-2012 1-2013 1-2014 1-2015 1-2016 1-2017 1-2018 1-2019 1-2020 1-2021 1-2022 1-2023 1-2024 Single Family Condo/TIC/Coop 289 436 201 247 228 294 Single Family Condo/TIC/Coop Year to Date 2022 2023 2024 + 26.1% - 43.2% + 35.6% - 36.5% - 43.3% + 13.4% - 30.4% + 19.0% 2022 2023 2024 2022 2023 2024 2022 2023 2024 - 2.5% - 10.8% - 20.4% - 10.1%
  • 7. Median Sales Price Median Sales Price Single Family Year-Over-Year Change Condo/TIC/ Coop Year-Over-Year Change Mar-2023 $1,695,000 -15.3% $1,060,000 -12.2% Apr-2023 $1,560,500 -23.9% $1,175,000 -14.2% May-2023 $1,650,000 -17.8% $1,062,500 -12.6% Jun-2023 $1,600,000 -14.9% $1,117,500 -9.9% Jul-2023 $1,450,000 -13.0% $1,135,000 -5.2% Aug-2023 $1,575,000 -1.9% $1,084,193 +8.4% Sep-2023 $1,580,000 -4.2% $1,050,000 -9.5% Oct-2023 $1,650,000 -1.2% $1,155,000 -3.8% Nov-2023 $1,527,000 +1.8% $1,115,053 -0.9% Dec-2023 $1,450,000 -5.7% $995,000 +4.7% Jan-2024 $1,575,000 +15.2% $1,075,000 +7.5% Feb-2024 $1,580,000 +9.7% $1,104,000 -5.0% 12-Month Avg* $1,575,000 -10.0% $1,100,000 -8.1% Historical Median Sales Price by Month Point at which half of the sales sold for more and half sold for less, not accounting for seller concessions, in a given month. * Median Sales Price for all properties from March 2023 through February 2024. This is not the average of the individual figures above. Current as of March 11, 2024. All data from the San Francisco Association of REALTORS® MLS. Report © 2024 ShowingTime Plus, LLC. | 7 $1,930,000 $1,227,500 $1,440,000 $1,162,500 $1,580,000 $1,104,000 Single Family Condo/TIC/Coop February $500,000 $750,000 $1,000,000 $1,250,000 $1,500,000 $1,750,000 $2,000,000 $2,250,000 1-2005 1-2006 1-2007 1-2008 1-2009 1-2010 1-2011 1-2012 1-2013 1-2014 1-2015 1-2016 1-2017 1-2018 1-2019 1-2020 1-2021 1-2022 1-2023 1-2024 Single Family Condo/TIC/Coop $1,820,000 $1,176,500 $1,400,000 $1,065,000 $1,577,500 $1,100,000 Single Family Condo/TIC/Coop Year to Date 2022 2023 2024 - 5.0% - 5.3% + 9.7% - 25.4% - 9.5% + 12.7% - 23.1% + 3.3% 2022 2023 2024 2022 2023 2024 2022 2023 2024 + 17.0% + 13.8% + 3.7% + 2.6%
  • 8. Average Sales Price Average Sales Price Single Family Year-Over-Year Change Condo/TIC/ Coop Year-Over-Year Change Mar-2023 $2,272,702 -10.3% $1,207,124 -14.5% Apr-2023 $2,209,070 -12.0% $1,370,225 -7.1% May-2023 $2,141,045 -11.2% $1,171,111 -16.5% Jun-2023 $2,009,398 -14.7% $1,296,055 -5.1% Jul-2023 $1,835,021 -10.9% $1,213,203 -17.3% Aug-2023 $2,141,891 +10.0% $1,211,778 +3.1% Sep-2023 $2,012,607 +7.0% $1,342,704 -0.0% Oct-2023 $2,312,677 +4.6% $1,265,490 -10.8% Nov-2023 $2,014,207 +6.3% $1,241,516 -10.9% Dec-2023 $1,973,556 +5.5% $1,166,449 +6.2% Jan-2024 $2,245,947 +24.0% $1,440,162 +13.9% Feb-2024 $2,041,045 +12.0% $1,332,638 +2.8% 12-Month Avg* $2,100,969 -3.6% $1,265,840 -7.4% Historical Average Sales Price by Month Average sales price for all closed sales, not accounting for seller concessions, in a given month. * Avg. Sales Price for all properties from March 2023 through February 2024. This is not the average of the individual figures above. Current as of March 11, 2024. All data from the San Francisco Association of REALTORS® MLS. Report © 2024 ShowingTime Plus, LLC. | 8 $2,417,245 $1,398,389 $1,823,104 $1,296,409 $2,041,045 $1,332,638 Single Family Condo/TIC/Coop February $500,000 $1,000,000 $1,500,000 $2,000,000 $2,500,000 $3,000,000 1-2005 1-2006 1-2007 1-2008 1-2009 1-2010 1-2011 1-2012 1-2013 1-2014 1-2015 1-2016 1-2017 1-2018 1-2019 1-2020 1-2021 1-2022 1-2023 1-2024 Single Family Condo/TIC/Coop $2,216,852 $1,361,221 $1,817,399 $1,282,814 $2,122,826 $1,374,840 Single Family Condo/TIC/Coop Year to Date 2022 2023 2024 + 2.8% - 7.3% + 12.0% - 24.6% - 5.8% + 16.8% - 18.0% + 7.2% 2022 2023 2024 2022 2023 2024 2022 2023 2024 + 7.1% + 5.4% + 6.4% + 4.0%
  • 9. Days on Market Until Sale Days on Market Until Sale Single Family Year-Over-Year Change Condo/TIC/ Coop Year-Over-Year Change Mar-2023 32 +100.0% 58 +70.6% Apr-2023 31 +93.8% 56 +75.0% May-2023 28 +33.3% 52 +40.5% Jun-2023 26 +52.9% 50 +28.2% Jul-2023 26 +23.8% 54 +10.2% Aug-2023 36 +38.5% 57 +14.0% Sep-2023 30 +7.1% 54 -6.9% Oct-2023 23 -17.9% 47 +9.3% Nov-2023 31 -11.4% 57 +11.8% Dec-2023 40 +5.3% 77 +4.1% Jan-2024 58 +16.0% 87 0.0% Feb-2024 35 +6.1% 52 -11.9% 12-Month Avg* 31 +26.5% 57 +25.3% Historical Days on Market Until Sale by Month Average number of days between when a property is listed and when an offer is accepted in a given month. * Days on Market for all properties from March 2023 through February 2024. This is not the average of the individual figures above. Current as of March 11, 2024. All data from the San Francisco Association of REALTORS® MLS. Report © 2024 ShowingTime Plus, LLC. | 9 22 36 33 59 35 52 Single Family Condo/TIC/Coop February 0 20 40 60 80 100 120 1-2005 1-2006 1-2007 1-2008 1-2009 1-2010 1-2011 1-2012 1-2013 1-2014 1-2015 1-2016 1-2017 1-2018 1-2019 1-2020 1-2021 1-2022 1-2023 1-2024 Single Family Condo/TIC/Coop 31 50 41 71 44 66 Single Family Condo/TIC/Coop Year to Date 2022 2023 2024 - 11.9% + 63.9% + 6.1% + 50.0% + 42.0% + 7.3% + 32.3% - 7.0% 2022 2023 2024 2022 2023 2024 2022 2023 2024 - 35.3% - 16.2% - 28.6% - 45.5%
  • 10. Inventory of Active Listings Inventory of Active Listings Single Family Year-Over-Year Change Condo/TIC/ Coop Year-Over-Year Change Mar-2023 319 +1.3% 774 -26.1% Apr-2023 342 +1.8% 789 -29.0% May-2023 356 +7.6% 807 -28.0% Jun-2023 323 -13.9% 793 -28.1% Jul-2023 314 -14.4% 765 -25.1% Aug-2023 343 -2.6% 702 -21.7% Sep-2023 483 -0.4% 979 -11.4% Oct-2023 454 -4.2% 978 -10.8% Nov-2023 339 -9.6% 813 -6.8% Dec-2023 176 -18.5% 482 -7.8% Jan-2024 215 -17.3% 584 -10.7% Feb-2024 244 -14.1% 659 -9.2% 12-Month Avg* 326 -6.3% 760 -19.1% Historical Inventory of Active Listings by Month The number of properties available for sale in active status at the end of a given month. * Active Listings for all properties from March 2023 through February 2024. This is not the average of the individual figures above. Current as of March 11, 2024. All data from the San Francisco Association of REALTORS® MLS. Report © 2024 ShowingTime Plus, LLC. | 10 299 992 284 726 244 659 Single Family Condo/TIC/Coop February 0 500 1,000 1,500 2,000 2,500 1-2005 1-2006 1-2007 1-2008 1-2009 1-2010 1-2011 1-2012 1-2013 1-2014 1-2015 1-2016 1-2017 1-2018 1-2019 1-2020 1-2021 1-2022 1-2023 1-2024 Single Family Condo/TIC/Coop 2022 2023 2024 - 9.2% - 26.8% - 14.1% - 5.0% 2022 2023 2024 - 21.5% - 19.8%
  • 11. % of Properties Sold Over List Price % of Properties Sold Over List Price Single Family Year-Over-Year Change Condo/TIC/ Coop Year-Over-Year Change Mar-2023 62.3% -27.9% 36.3% -37.5% Apr-2023 62.1% -30.0% 32.7% -47.9% May-2023 63.0% -27.5% 40.9% -26.0% Jun-2023 69.8% -19.1% 37.5% -34.6% Jul-2023 66.7% -15.1% 30.7% -22.5% Aug-2023 64.2% -14.7% 31.3% -15.6% Sep-2023 69.0% +2.7% 31.2% +0.6% Oct-2023 67.7% +5.6% 34.2% -8.8% Nov-2023 62.2% +8.2% 33.1% +8.9% Dec-2023 54.5% +11.9% 22.1% +41.7% Jan-2024 50.5% +14.8% 19.1% +0.5% Feb-2024 63.5% +23.3% 34.8% +23.4% 12-Month Avg 63.7% -13.5% 32.9% -26.5% Historical % of Properties Sold Over List Price by Month Percentage found when dividing the number of properties sold by properties sold over its original list price, not accounting for seller concessions. * % of Properties Sold Over List Price for all properties from March 2023 through February 2024. This is not the average of the individual figures above. Current as of March 11, 2024. All data from the San Francisco Association of REALTORS® MLS. Report © 2024 ShowingTime Plus, LLC. | 11 86.8% 58.4% 51.5% 28.2% 63.5% 34.8% Single Family Condo/TIC/Coop February 0.0% 20.0% 40.0% 60.0% 80.0% 100.0% 1-2005 1-2006 1-2007 1-2008 1-2009 1-2010 1-2011 1-2012 1-2013 1-2014 1-2015 1-2016 1-2017 1-2018 1-2019 1-2020 1-2021 1-2022 1-2023 1-2024 Single Family Condo/TIC/Coop 81.7% 50.0% 47.8% 24.3% 58.3% 28.7% Single Family Condo/TIC/Coop Year to Date 2022 2023 2024 + 23.4% - 51.7% + 23.3% - 40.7% - 51.4% + 22.0% - 41.5% + 18.1% 2022 2023 2024 2022 2023 2024 2022 2023 2024 + 27.5% + 29.7% + 74.8% + 65.4%
  • 12. % of List Price Received % of List Price Received Single Family Year-Over-Year Change Condo/TIC/ Coop Year-Over-Year Change Mar-2023 107.9% -11.5% 100.4% -5.6% Apr-2023 107.1% -13.0% 99.9% -6.8% May-2023 108.2% -9.5% 100.1% -5.5% Jun-2023 108.6% -7.0% 100.6% -4.5% Jul-2023 108.3% -2.4% 99.6% -1.9% Aug-2023 107.2% -1.0% 99.5% -1.2% Sep-2023 107.6% -0.8% 99.0% -1.6% Oct-2023 107.9% +0.7% 99.7% -0.7% Nov-2023 106.0% +1.0% 100.1% +0.9% Dec-2023 104.3% +1.4% 99.0% +0.9% Jan-2024 104.6% +1.4% 96.7% -1.2% Feb-2024 108.0% +4.1% 100.6% +1.6% 12-Month Avg* 107.3% -4.9% 99.7% -3.2% Historical % of List Price Received by Month Percentage found when dividing a property’s sales price by its most recent list price, then taking the average for all properties sold in a given month, not accounting for seller concessions. * % of List Price Received for all properties from March 2023 through February 2024. This is not the average of the individual figures above. Current as of March 11, 2024. All data from the San Francisco Association of REALTORS® MLS. Report © 2024 ShowingTime Plus, LLC. | 12 121.2% 106.1% 103.7% 99.0% 108.0% 100.6% Single Family Condo/TIC/Coop February 119.5% 103.9% 103.5% 98.5% 106.6% 99.1% Single Family Condo/TIC/Coop Year to Date 90.0% 100.0% 110.0% 120.0% 130.0% 1-2005 1-2006 1-2007 1-2008 1-2009 1-2010 1-2011 1-2012 1-2013 1-2014 1-2015 1-2016 1-2017 1-2018 1-2019 1-2020 1-2021 1-2022 1-2023 1-2024 Single Family Condo/TIC/Coop 2022 2023 2024 + 1.6% - 6.7% + 4.1% - 14.4% 2022 2023 2024 + 10.5% + 5.4% 2022 2023 2024 + 0.6% - 5.2% + 3.0% - 13.4% 2022 2023 2024 + 11.2% + 4.2%
  • 13. Housing Affordability Ratio Housing Affordability Ratio Single Family Year-Over-Year Change Condo/TIC/ Coop Year-Over-Year Change Mar-2023 25 +4.2% 44 -2.2% Apr-2023 26 +23.8% 40 +8.1% May-2023 25 +13.6% 43 +2.4% Jun-2023 25 +8.7% 41 +2.5% Jul-2023 27 0.0% 39 -9.3% Aug-2023 24 -14.3% 40 -21.6% Sep-2023 24 0.0% 41 +5.1% Oct-2023 22 -4.3% 35 -5.4% Nov-2023 25 -7.4% 38 -5.0% Dec-2023 28 +3.7% 46 -6.1% Jan-2024 26 -16.1% 42 -12.5% Feb-2024 25 -10.7% 40 0.0% 12-Month Avg* 25 -1.9% 41 -5.5% Historical Housing Affordability Ratio by Month This index measures housing affordability for the region. For example, an index of 120 means the median household income is 120% of what is necessary to qualify for the median-priced home under prevailing interest rates. A higher number means greater affordability. * Affordability Ratio for all properties from March 2023 through February 2024. This is not the average of the individual figures above. Current as of March 11, 2024. All data from the San Francisco Association of REALTORS® MLS. Report © 2024 ShowingTime Plus, LLC. | 13 27 49 28 40 25 40 Single Family Condo/TIC/Coop February 20 40 60 80 100 1-2005 1-2006 1-2007 1-2008 1-2009 1-2010 1-2011 1-2012 1-2013 1-2014 1-2015 1-2016 1-2017 1-2018 1-2019 1-2020 1-2021 1-2022 1-2023 1-2024 Single Family Condo/TIC/Coop 2022 2023 2024 0.0% - 18.4% - 10.7% + 3.7% 2022 2023 2024 - 18.2% - 7.5% 28 51 29 43 25 40 Single Family Condo/TIC/Coop Year to Date 2022 2023 2024 - 7.0% - 15.7% - 13.8% + 3.6% 2022 2023 2024 - 17.6% - 8.9%
  • 14. Months Supply of Inventory Months Supply of Inventory Single Family Year-Over-Year Change Condo/TIC/ Coop Year-Over-Year Change Mar-2023 1.8 +38.5% 3.5 +20.7% Apr-2023 2.0 +42.9% 3.7 +15.6% May-2023 2.1 +50.0% 4.0 +21.2% Jun-2023 1.9 +18.8% 4.0 +17.6% Jul-2023 1.9 +18.8% 4.0 +25.0% Aug-2023 2.2 +37.5% 3.8 +31.0% Sep-2023 3.1 +34.8% 5.4 +45.9% Oct-2023 2.8 +21.7% 5.5 +41.0% Nov-2023 2.1 +10.5% 4.6 +39.4% Dec-2023 1.1 0.0% 2.7 +35.0% Jan-2024 1.4 +7.7% 3.2 +18.5% Feb-2024 1.5 0.0% 3.5 +12.9% 12-Month Avg* 2.0 +25.8% 4.0 +27.3% Historical Months Supply of Inventory by Month The inventory of homes for sale at the end of a given month, divided by the average monthly pending sales from the last 12 months. * Months Supply for all properties from March 2023 through February 2024. This is not the average of the individual figures above. Current as of March 11, 2024. All data from the San Francisco Association of REALTORS® MLS. Report © 2024 ShowingTime Plus, LLC. | 14 1.2 2.7 1.5 3.1 1.5 3.5 Single Family Condo/TIC/Coop February 0.0 2.0 4.0 6.0 8.0 10.0 12.0 1-2005 1-2006 1-2007 1-2008 1-2009 1-2010 1-2011 1-2012 1-2013 1-2014 1-2015 1-2016 1-2017 1-2018 1-2019 1-2020 1-2021 1-2022 1-2023 1-2024 Single Family Condo/TIC/Coop 2022 2023 2024 + 12.9% + 14.8% 0.0% + 25.0% 2022 2023 2024 - 29.4% - 42.6%
  • 15. All Properties Activity Overview Key metrics by report month and for year-to-date (YTD) starting from the first of the year. Key Metrics Historical Sparkbars 2-2023 2-2024 Percent Change YTD 2023 YTD 2024 Percent Change Current as of March 11, 2024. All data from the San Francisco Association of REALTORS® MLS. Report © 2024 ShowingTime Plus, LLC. | 15 Months Supply 2.4 2.6 + 8.3% -- -- -- Affordability Ratio 31 27 - 12.9% % of List Price Received 101.0% 103.8% + 2.8% 100.7% 31 42.0% + 20.0% + 1.7% 26 - 16.1% 102.4% % of Properties Sold Over List Price 38.1% 47.8% + 25.5% 35.0% Active Listings 1,037 922 - 11.1% -- Avg. Sales Price $1,512,802 $1,637,826 + 8.3% $1,518,153 Days on Market 49 44 - 10.2% 58 $1,333,000 + 6.6% + 11.6% 56 - 3.4% $1,694,865 -- -- Sold Listings 244 319 + 30.7% 451 530 + 17.5% Median Sales Price $1,263,500 $1,362,500 + 7.8% $1,250,000 + 12.2% Pending Sales 304 407 + 33.9% 516 684 + 32.6% New Listings 496 600 + 21.0% 1,013 1,137 2-2021 2-2022 2-2023 2-2024 2-2021 2-2022 2-2023 2-2024 2-2021 2-2022 2-2023 2-2024 2-2021 2-2022 2-2023 2-2024 2-2021 2-2022 2-2023 2-2024 2-2021 2-2022 2-2023 2-2024 2-2021 2-2022 2-2023 2-2024 2-2021 2-2022 2-2023 2-2024 2-2021 2-2022 2-2023 2-2024 2-2021 2-2022 2-2023 2-2024 2-2021 2-2022 2-2023 2-2024
  • 16. Activity by District SF District 1: Northwest (Sea Cliff, Lake, Jordan Park / Laurel Heights, Outer Richmond, Central Richmond, Inner Richmond, Lone Mountain) SF District 2: Central West (Outer Sunset, Central Sunset, Inner Sunset, Outer Parkside, Parkside, Inner Parkside, Golden Gate Heights) SF District 3: Southwest (Pine Lake Park, Lake Shore, Merced Manor, Stonestown, Lakeside, Merced Heights, Ingleside, Ingleside Heights, Oceanview) SF District 4: Twin Peaks W (Forest Hill (& Ext), W Portal, St Francis Wd, Balboa Terr, Mt Dav Manor, Ingleside Terr, Monterey Hts, Wstwd Pk & H'lnds, Shrwd Fst, Miraloma Pk, Dmnd Hts, Mdtwn Terr) SF District 5: Central (Haight Ashbury, Cole Vly / Prnssus Hts, Clarndn Hts, Corona Hts, Twin Pks, Glen Pk, Noe Vly, Eureka Vly / Dolores Hts, Mission Dolores, Duboce Trngl, Buena Vista / Ashbury Hts) SF District 6: Central North (Lower Pacific Heights, Anza Vista, Western Addition, North Panhandle, Alamo Square, Hayes Valley) SF District 7: North (Marina, Cow Hollow, Presidio Heights, Pacific Heights) SF District 8: Northeast (North Waterfront, North Beach, Russian Hill, Telegraph Hill, Nob Hill, Financial District / Barbary Coast, Downtown, Van Ness / Civic Center, Tenderloin) SF District 9: Central East (Yerba Buena, South Beach, South of Market, Mission Bay, Inner Mission, Potrero Hill, Central Waterfront / Dogpatch, Bernal Heights) SF District 10: Southeast (Outer Mission, Mission Terr, Excelsior, Portola, Bayview, Silver Terr, Hunters Pt, Candlestick Pt, Bayview Hts, Little Hollywood, Visitation Vly, Crocker Amazon) 2-2023 2-2024 + / – 2-2023 2-2024 + / – 2-2023 2-2024 + / – 2-2023 2-2024 + / – 2-2023 2-2024 + / – Single Family 1 SF District 1 24 14 -41.7% 2 10 +400.0% $3,925,000 $1,550,000 -60.5% 40 19 -52.5% 1.5 0.9 -40.0% 2 SF District 2 33 35 +6.1% 16 25 +56.3% $1,627,000 $1,370,000 -15.8% 23 31 +34.8% 0.9 1.1 +22.2% 3 SF District 3 20 17 -15.0% 9 9 0.0% $1,205,000 $1,160,000 -3.7% 25 23 -8.0% 1.6 1.4 -12.5% 4 SF District 4 29 20 -31.0% 14 15 +7.1% $1,495,000 $1,850,200 +23.8% 34 37 +8.8% 1.2 0.9 -25.0% 5 SF District 5 29 39 +34.5% 18 24 +33.3% $2,715,361 $2,413,000 -11.1% 30 33 +10.0% 1.0 1.9 +90.0% 6 SF District 6 6 6 0.0% 1 3 +200.0% $1,350,000 $1,900,000 +40.7% 20 48 +140.0% 2.2 2.0 -9.1% 7 SF District 7 33 30 -9.1% 2 10 +400.0% $7,097,500 $4,100,000 -42.2% 35 33 -5.7% 4.7 3.3 -29.8% 8 SF District 8 9 9 0.0% 0 4 -- $0 $2,761,500 -- 0 15 -- 2.9 4.5 +55.2% 9 SF District 9 32 24 -25.0% 15 16 +6.7% $1,650,000 $1,527,250 -7.4% 45 31 -31.1% 1.7 1.5 -11.8% 10 SF District 10 69 50 -27.5% 24 21 -12.5% $972,500 $1,068,000 +9.8% 38 59 +55.3% 1.8 1.6 -11.1% Condo/TIC/Coop 1 SF District 1 25 17 -32.0% 9 1 -88.9% $1,395,000 $800,000 -42.7% 54 148 +174.1% 1.9 1.8 -5.3% 2 SF District 2 16 10 -37.5% 7 3 -57.1% $1,050,000 $749,000 -28.7% 65 31 -52.3% 4.6 3.2 -30.4% 3 SF District 3 5 3 -40.0% 3 1 -66.7% $768,800 $1,000,000 +30.1% 22 13 -40.9% 1.7 1.4 -17.6% 4 SF District 4 12 4 -66.7% 2 4 +100.0% $945,000 $919,000 -2.8% 9 16 +77.8% 3.3 1.0 -69.7% 5 SF District 5 86 53 -38.4% 21 36 +71.4% $1,245,000 $1,357,500 +9.0% 47 24 -48.9% 2.0 1.6 -20.0% 6 SF District 6 56 44 -21.4% 16 12 -25.0% $1,335,000 $962,500 -27.9% 34 23 -32.4% 2.1 2.4 +14.3% 7 SF District 7 60 55 -8.3% 15 21 +40.0% $1,600,000 $1,720,000 +7.5% 24 19 -20.8% 2.4 2.8 +16.7% 8 SF District 8 156 172 +10.3% 24 33 +37.5% $920,000 $965,000 +4.9% 86 75 -12.8% 4.0 4.8 +20.0% 9 SF District 9 287 272 -5.2% 42 60 +42.9% $1,012,500 $1,125,000 +11.1% 79 73 -7.6% 3.9 4.7 +20.5% 10 SF District 10 23 29 +26.1% 3 8 +166.7% $900,000 $599,000 -33.4% 47 54 +14.9% 4.2 6.2 +47.6% Key metrics by report month for the districts of San Francisco. Current as of March 11, 2024. All data from the San Francisco Association of REALTORS® MLS. Report © 2024 ShowingTime Plus, LLC. | 16 Active Listings Sold Listings Median Sales Price Days on Market Months Supply