
Recommended
Recommended
More Related Content
What's hot
What's hot (15)
Viewers also liked
Viewers also liked (20)
Similar to Cincinnati JLL Office Employment Update February 2015
Similar to Cincinnati JLL Office Employment Update February 2015 (20)
More from cybrooks
More from cybrooks (10)
Recently uploaded
Recently uploaded (20)
Cincinnati JLL Office Employment Update February 2015
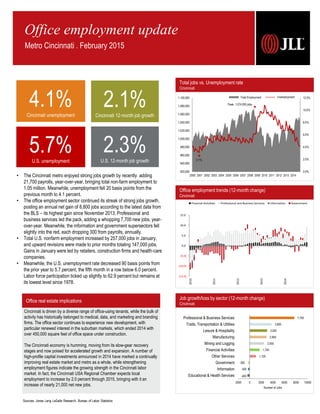
- 1. Office employment trends (12-month change) Cincinnati Sources: Jones Lang LaSalle Research, Bureau of Labor Statistics 4.1%Cincinnati unemployment • The Cincinnati metro enjoyed strong jobs growth by recently adding 21,700 payrolls, year-over-year, bringing total non-farm employment to 1.05 million. Meanwhile, unemployment fell 20 basis points from the previous month to 4.1 percent. • The office employment sector continued its streak of strong jobs growth, posting an annual net gain of 8,800 jobs according to the latest data from the BLS – its highest gain since November 2013. Professional and business services led the pack, adding a whopping 7,700 new jobs, year- over-year. Meanwhile, the information and government supersectors fell slightly into the red, each dropping 300 from payrolls, annually. • Total U.S. nonfarm employment increased by 257,000 jobs in January, and upward revisions were made to prior months totaling 147,000 jobs. Gains in January were led by retailers, construction firms and health-care companies. • Meanwhile, the U.S. unemployment rate decreased 90 basis points from the prior year to 5.7 percent, the fifth month in a row below 6.0 percent. Labor force participation ticked up slightly to 62.9 percent but remains at its lowest level since 1978. Total jobs vs. Unemployment rate Cincinnati 2.1%Cincinnati 12-month job growth 5.7%U.S. unemployment 2.3%U.S. 12-month job growth Office employment update Metro Cincinnati . February 2015 Unemployment 3.1% Cincinnati is driven by a diverse range of office-using tenants, while the bulk of activity has historically belonged to medical, data, and marketing and branding firms. The office sector continues to experience new development, with particular renewed interest in the suburban markets, which ended 2014 with over 450,000 square feet of office space under construction. The Cincinnati economy is humming, moving from its slow-gear recovery stages and now poised for accelerated growth and expansion. A number of high-profile capital investments announced in 2014 have marked a continually improving real estate market and metro as a whole, while strengthening employment figures indicate the growing strength in the Cincinnati labor market. In fact, the Cincinnati USA Regional Chamber expects local employment to increase by 2.0 percent through 2015, bringing with it an increase of nearly 21,000 net new jobs. Office real estate implications Job growth/loss by sector (12-month change) Cincinnati -400 -300 -300 1,100 1,700 2,500 2,900 3,000 3,800 7,700 -2000 0 2000 4000 6000 8000 10000 Educational & Health Services Information Government Other Services Financial Activities Mining and Logging Manufacturing Leisure & Hospitality Trade, Transportation & Utilities Professional & Business Services Number of Jobs 0.0% 2.0% 4.0% 6.0% 8.0% 10.0% 12.0% 920,000 940,000 960,000 980,000 1,000,000 1,020,000 1,040,000 1,060,000 1,080,000 1,100,000 2000 2001 2002 2003 2004 2005 2006 2007 2008 2009 2010 2011 2012 2013 2014 Peak: 1,074,050 jobs Total Employment 3.1% (15.0) (10.0) (5.0) 0.0 5.0 10.0 15.0 2010 2011 2012 2013 2014 Financial Activities Professional and Business Services Information Government
- 2. © 2015 Jones Lang LaSalle IP, Inc. All rights reserved. All information contained herein is from sources deemed reliable; however, no representation or warranty is made to the accuracy thereof. JLL Americas Research • Cincinnati Office Employment Update 2 December 2012 December 2013 December 2014 Total Non-farm Employment 1,019,300 1.4% 1,033,000 1.3% 1,054,700 2.1% Unemployment Rate 6.8% 6.1% 4.1% Cincinnati Supersectors December 2012 December 2013 December 2014 Mining, Logging and Construction 38,100 -1.3% 38,300 0.5% 40,800 6.5% Manufacturing 105,800 0.1% 106,800 0.9% 109,700 2.7% Trade, Transportation, & Utilities 206,200 0.0% 207,500 0.6% 211,300 1.8% Information 14,200 1.4% 14,000 -1.4% 13,700 -2.1% Financial Activities 65,300 2.5% 65,600 0.5% 67,300 2.6% Professional & Business Services 162,500 2.3% 165,900 2.1% 173,600 4.6% Educational & Health Services 155,000 2.2% 159,100 2.6% 158,700 -0.3% Leisure & Hospitality 104,500 3.7% 105,700 1.1% 108,700 2.8% Other Services 39,700 3.4% 39,900 0.5% 41,000 2.8% Government 128,000 0.1% 130,200 1.7% 129,900 -0.2% News on the street Cincinnati businesses expanding, contracting, etc. Employment statistics Cincinnati Industry employment stratification Cincinnati Allos Ventures Ι Consulting Services: Relocating Cincinnati venture capital firm Allos Ventures is on the move. Allos has moved into larger office space closer to Over-the-Rhine. It's now on the fourth floor of the building occupied by branding firm Deskey Associates at 120 E. Eighth Street. Allos had been in the Scripps Center at 312 Walnut Street where it shared office space with Blue Chip Venture Co. Allos is sharing the 5,000-square-foot office in the Deskey building with software developer Differential. BoxcarPR Ι Public Relations Services: Expanding BoxcarPR, a public relations firm headquartered in Louisville is opening a new office in downtown Cincinnati. BoxcarPR's new location will be at 652 Main St. The full-service boutique agency was founded in 2012 and offers a variety of services, including public relations, public affairs, crisis communications, social media management and creative services. Its clients include Churchill Downs Inc., 21C Museum Hotels and University of Louisville athletics. FisherBroyles Ι Property/Casualty Insurance Carriers: Expanding A national virtual law firm has opened an office in Cincinnati, but it may not be familiar to attorneys or clients used to traditional law firms. FisherBroyles opened offices in Cincinnati, Columbus and Cleveland as part of an expansion into the Ohio market. FisherBroyles was founded in Atlanta in 2002 as the first national cloud- based law firm. It has since grown to more than 100 attorneys in 15 offices nationwide. HumaCare Inc. Ι Staffing Services: Relocating HumaCare Inc., a growing human resources company, is moving its corporate headquarters to Deerfield Township from Loveland. The 48-employee company, which also has an office in Columbus, has outgrown its 7,000-square-foot office space at 9501 Union Cemetery Road. HumaCare signed an 11-year lease for 14,000 square feet of space in One Waterstone Place, located at 9435 Waterstone Boulevard in the Fields Ertel/Mason submarket. Mayfield Clinic Ι Physicians: Relocating The Mayfield Clinic plans to consolidate three of its 10 medical offices and relocate its Avondale headquarters to space now under construction at the Rookwood Exchange in Norwood. The new headquarters will encompass 45,000 square feet on an entire floor of the eight-story office tower overlooking Interstate 71. About half of the space will be dedicated to administrative purposes, and the rest is being designed so health providers can examine and treat patients there. Total Quality Logistics Ι Freight Forwarding Services: Relocating Total Quality Logistics is in the middle of relocating one of its Milford offices. TQL, a freight brokerage firm and Greater Cincinnati's largest private company with more than $2 billion in revenue last year, moved about 120 employees to Batavia from a Milford office, located at 502 Techne Center Drive. The new Batavia office, located 4101 Founders Boulevard, opened in December. Another 80 employees from TQL's Techne Center office are expected to move over starting in February. Cody Brooks Research Analyst tel +1 513 297 2509 Cody.Brooks@am.jll.com 312 Walnut St, Suite 3030 Cincinnati, OH 45202 www.jll.com/cincinnati Robert Kramp Senior Vice President – Americas Midwest & Great Lakes Research Director tel +1 312 228 2470 Robert.Kramp@am.jll.com 200 East Randolph Street, 47th Floor Chicago, IL 60601 www.us.joneslanglasalle.com/research Trade, transportation and Utilities, 211,300, 20% Professional and Business Services, 173,600, 17% Educational and Health Services, 158,700, 15% Government, 129,900, 12% Manufacturing, 109,700, 11% Leisure and Hospitality, 108,700, 10% Financial Activities, 67,300, 6% Other Services, 41,000, 4% Mining, Logging and construction, 40,800, 4% Information, 13,700, 1%