1. Office real estate implications
Sources: JLL Research, Bureau of Labor Statistics
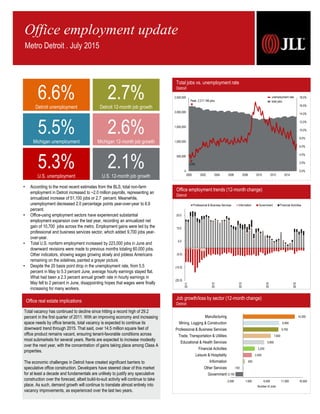
Job growth/loss by sector (12-month change)
Detroit
Total vacancy has continued to decline since hitting a record high of 29.2
percent in the first quarter of 2011. With an improving economy and increasing
space needs by office tenants, total vacancy is expected to continue its
downward trend through 2015. That said, over 14.5 million square feet of
office product remains vacant, ensuring tenant-favorable conditions across
most submarkets for several years. Rents are expected to increase modestly
over the next year, with the concentration of gains taking place among Class A
properties.
The economic challenges in Detroit have created significant barriers to
speculative office construction. Developers have steered clear of this market
for at least a decade and fundamentals are unlikely to justify any speculative
construction over the forecast, albeit build-to-suit activity will continue to take
place. As such, demand growth will continue to translate almost entirely into
vacancy improvements, as experienced over the last two years.
Total jobs vs. unemployment rate
Detroit
(25.0)
(15.0)
(5.0)
5.0
15.0
25.0
2011
2012
2013
2014
2015
Professional & Business Services Information Government Financial Activities
Office employment trends (12-month change)
Detroit
Office employment update
Metro Detroit . July 2015
0.0%
2.0%
4.0%
6.0%
8.0%
10.0%
12.0%
14.0%
16.0%
18.0%
0
500,000
1,000,000
1,500,000
2,000,000
2,500,000
2000 2002 2004 2006 2008 2010 2012 2014
Peak: 2,217,186 jobs
unemployment rate
total jobs
3.0%
-2,100
-100
500
2,400
3,200
5,800
7,600
9,700
9,900
14,200
-3,500 1,500 6,500 11,500 16,500
Government
Other Services
Information
Leisure & Hospitality
Financial Activities
Educational & Health Services
Trade, Transportation & Utilities
Professional & Business Services
Mining, Logging & Construction
Manufacturing
Number of Jobs
• According to the most recent estimates from the BLS, total non-farm
employment in Detroit increased to ~2.0 million payrolls, representing an
annualized increase of 51,100 jobs or 2.7 percent. Meanwhile,
unemployment decreased 2.0 percentage points year-over-year to 6.6
percent.
• Office-using employment sectors have experienced substantial
employment expansion over the last year, recording an annualized net
gain of 10,700 jobs across the metro. Employment gains were led by the
professional and business services sector, which added 9,700 jobs year-
over-year.
• Total U.S. nonfarm employment increased by 223,000 jobs in June and
downward revisions were made to previous months totaling 60,000 jobs.
Other indicators, showing wages growing slowly and jobless Americans
remaining on the sidelines, painted a grayer picture.
• Despite the 20 basis point drop in the unemployment rate, from 5.5
percent in May to 5.3 percent June, average hourly earnings stayed flat.
What had been a 2.3 percent annual growth rate in hourly earnings in
May fell to 2 percent in June, disappointing hopes that wages were finally
increasing for many workers.
5.3%U.S. unemployment
2.1%U.S. 12-month job growth
6.6%Detroit unemployment
2.7%Detroit 12-month job growth
5.5%Michigan unemployment
2.6%Michigan 12-month job growth