
Recommended
Recommended
More Related Content
What's hot
What's hot (12)
Similar to JLL Minneapolis-St. Paul Office Employment Update - May 2015
Similar to JLL Minneapolis-St. Paul Office Employment Update - May 2015 (20)
More from JLL_Midwest_Great_Lakes_Research
More from JLL_Midwest_Great_Lakes_Research (20)
Recently uploaded
Recently uploaded (20)
JLL Minneapolis-St. Paul Office Employment Update - May 2015
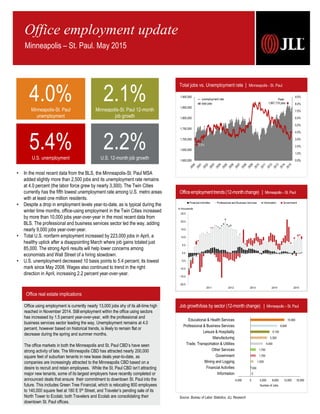
- 1. 0 300 1,000 1,700 1,700 4,000 5,300 6,100 8,600 10,900 -4,000 0 4,000 8,000 12,000 16,000 Information Financial Activities Mining and Logging Government Other Services Trade, Transportation & Utilities Manufacturing Leisure & Hospitality Professional & Business Services Educational & Health Services Number of Jobs Office real estate implications Officeemploymenttrends(12-monthchange) | Minneapolis – St. Paul 4.0%Minneapolis-St. Paul unemployment • In the most recent data from the BLS, the Minneapolis-St. Paul MSA added slightly more than 2,500 jobs and its unemployment rate remains at 4.0 percent (the labor force grew by nearly 3,300). The Twin Cities currently has the fifth lowest unemployment rate among U.S. metro areas with at least one million residents. • Despite a drop in employment levels year-to-date, as is typical during the winter time months, office-using employment in the Twin Cities increased by more than 10,000 jobs year-over-year in the most recent data from BLS. The professional and business services sector led the way, adding nearly 9,000 jobs year-over-year. • Total U.S. nonfarm employment increased by 223,000 jobs in April, a healthy uptick after a disappointing March where job gains totaled just 85,000. The strong April results will help lower concerns among economists and Wall Street of a hiring slowdown. • U.S. unemployment decreased 10 basis points to 5.4 percent, its lowest mark since May 2008. Wages also continued to trend in the right direction in April, increasing 2.2 percent year-over-year. Job growth/loss by sector (12-month change) | Minneapolis – St. PaulOffice using employment is currently nearly 13,000 jobs shy of its all-time high reached in November 2014. Still employment within the office using sectors has increased by 1.5 percent year-over-year, with the professional and business services sector leading the way. Unemployment remains at 4.0 percent, however based on historical trends, is likely to remain flat or decrease during the spring and summer months. The office markets in both the Minneapolis and St. Paul CBD’s have seen strong activity of late. The Minneapolis CBD has attracted nearly 200,000 square feet of suburban tenants in new lease deals year-to-date, as companies are increasingly attracted to the Minneapolis CBD based on a desire to recruit and retain employees. While the St. Paul CBD isn’t attracting major new tenants, some of its largest employers have recently completed or announced deals that ensure their commitment to downtown St. Paul into the future. This includes Green Tree Financial, which is relocating 800 employees to 140,000 square feet at 180 E 5th Street, and Traveler’s pending sale of its North Tower to Ecolab; both Travelers and Ecolab are consolidating their downtown St. Paul offices. Total jobs vs. Unemployment rate | Minneapolis - St. Paul 0.0% 1.0% 2.0% 3.0% 4.0% 5.0% 6.0% 7.0% 8.0% 9.0% 1,600,000 1,650,000 1,700,000 1,750,000 1,800,000 1,850,000 1,900,000 Peak: 1,867,718 jobs 2.5% 2.1%Minneapolis-St. Paul 12-month job growth 5.4%U.S. unemployment 2.2%U.S. 12-month job growth unemployment rate total jobs Source: Bureau of Labor Statistics, JLL Research Office employment update Minneapolis – St. Paul. May 2015
- 2. JLL Americas Research • Minneapolis – St. Paul Office Employment Update – May 2015 2 News on the street Minneapolis – St. Paul businesses expanding, contracting, etc. BioSig | Medical device manufacturing: Expanding Medical-device company BioSig Technologies Inc. (OTCQB: BSGM) is moving its headquarters from Los Angeles to Golden Valley, where it plans to hire about a dozen workers. BioSig picked the Minneapolis/St. Paul area largely because of its strong med-tech workforce, CEO Greg Cash said. The new headquarters address is 8441 Wayzata Boulevard. BioSig plans to add workers across several categories, including sales and marketing, engineering and administration. ECMC | Education nonprofit: Relocating Education Credit Management Corp. (ECMC) will relocate from Oakdale to an office building in downtown Minneapolis, bringing its 500 employees along with it. The education nonprofit signed a letter of intent to move into 122,000 square feet in the Ameriprise Client Service Center building at 901 Third Ave. S. The move is being prompted by ECMC's desire to attract and retain workers, CEO Dave Hawn said. Hawn said ECMC anticipates doing quite a bit of hiring in its new location. ECMC plans to move before February 2016. The new space will be on the 13th and 14th floors of the Ameriprise Client Service Center and "ebb and flow" between 500 and 600 employees for the next couple of years as the company's business changes. Ecolab | Water and energy technologies: Relocating/consolidating Ecolab Inc. (NYSE: ECL) announced a deal in April to buy a building from Travelers in downtown St. Paul, where Ecolab plans to relocate its entire 1,500-person downtown workforce. Terms of the sale haven't been disclosed. Ecolab expects to begin the move later this year, after the deal closes in the third quarter. Ecolab today occupies three buildings on Wabasha Street: the 19-story Ecolab Corporate Center, which it leases through mid-2018; the 15-story Ecolab University Center, which it leases through 2019; and the six-story Ecolab Global Communications Center, which it owns. Combined, the three buildings comprise more than 460,000 square feet. Infinite Campus | Student data services provider: Expanding One of Blaine’s largest employers plans to double its employee count and office space, potentially becoming the biggest employer with the tallest building in the northern suburb. Infinite Campus is seeking permission to build an eight-story office building on its existing campus on the northeast quadrant of Lexington Avenue and 109th Avenue Northeast. It currently has 400 workers on its campus, making an average salary of $81,000, with plans to add “well over” 400 in the expansion, founder and CEO Charlie Kratsch said Thursday in an interview. Travelers | Insurance: Relocating consolidating Hartford, Conn.-based Travelers (NYSE: TRV) is selling the North Tower at 385 Washington St. to Ecolab. The insurance company will consolidate its 2,100 St. Paul employees into an adjacent building it owns. Walter Investment Management Corp. | Home loan financing: Relocating The parent company of Green Tree Servicing plans to replant its 800 St. Paul employees in a newly leased Lowertown space. Walter Investment Management Corp. (NYSE: WAC) signed a lease for 140,000 square feet at 180 East Fifth, the 13-story office building constructed at that address a century ago by railroad tycoon James J. Hill. It will relocate about 600 employees from the Landmark Towers (345 St. Peter St.), where Green Tree has had offices since the mid-1980s. The other 200 St. Paul employees will move from Lawson Commons (380 St. Peter St.). Employment statistics | Minneapolis – St. Paul Industry employment stratification | Minneapolis - St. Paul Trade, transportation and Utilities, 338,700, 18% Educational and Health Services, 315,700, 17% Professional and Business Services, 297,500, 16% Government, 251,700, 13% Manufacturing, 192,200, 10% Leisure and Hospitality, 169,900, 9% Financial Activities, 144,400, 8% Other Services, 79,200, 4% Mining, Logging and construction, 61,100, 3% Information, 39,300, 2% Abel Balwierz Senior Research Analyst tel +1 612 217 5136 Abel.Balwierz@am.jll.com 45 South Seventh Street, Suite 3051 Minneapolis MN 55402 www.jll.com/minneapolis© 2015 Jones Lang LaSalle IP, Inc. All rights reserved. All information contained herein is from sources deemed reliable; however, no representation or warranty is made to the accuracy thereof. March 2013 March 2014 March 2015 Total Non-farm Employment 1,824,400 1.8% 1,850,100 1.4% 1,889,700 2.1% Unemployment Rate 5.3% 4.8% 4.0% Twin Cities Supersectors March 2013 March 2014 March 2015 Mining, Logging & Construction 55.3 5.7% 60.1 8.7% 61.1 1.7% Manufacturing 184.3 1.3% 186.9 1.4% 192.2 2.8% Trade, Transportation & Utilities 329.7 1.1% 334.7 1.5% 338.7 1.2% Information 40.2 0.0% 39.3 -2.2% 39.3 0.0% Financial Activities 143.9 1.0% 144.1 0.1% 144.4 0.2% Professional & Business Services 287.2 2.0% 288.9 0.6% 297.5 3.0% Educational & Health Services 297.9 2.9% 304.8 2.3% 315.7 3.6% Leisure & Hospitality 161.7 2.1% 163.8 1.3% 169.9 3.7% Other Services 78.2 0.8% 77.5 -0.9% 79.2 2.2% Government 246.0 1.4% 250 1.6% 251.7 0.7%