
Recommended
Recommended
More Related Content
What's hot
What's hot (19)
Viewers also liked
Viewers also liked (16)
Similar to Columbus office employment trends
Similar to Columbus office employment trends (18)
More from Andrew Batson
More from Andrew Batson (20)
Recently uploaded
Recently uploaded (20)
Columbus office employment trends
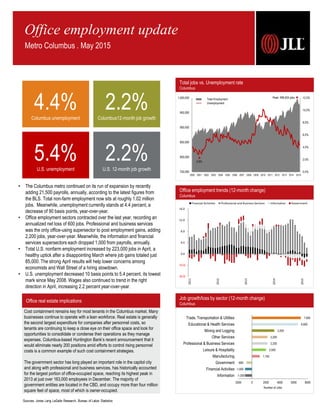
- 1. Office employment trends (12-month change) Columbus Total jobs vs. Unemployment rate Columbus Office employment update Metro Columbus . May 2015 Cost containment remains key for most tenants in the Columbus market. Many businesses continue to operate with a lean workforce. Real estate is generally the second largest expenditure for companies after personnel costs, so tenants are continuing to keep a close eye on their office space and look for opportunities to consolidate or condense their operations as they manage expenses. Columbus-based Huntington Bank’s recent announcement that it would eliminate nearly 200 positions amid efforts to control rising personnel costs is a common example of such cost containment strategies. The government sector has long played an important role in the capitol city and along with professional and business services, has historically accounted for the largest portion of office-occupied space, reaching its highest peak in 2013 at just over 163,000 employees in December. The majority of government entities are located in the CBD, and occupy more than four million square feet of space, most of which is owner-occupied. Office real estate implications Job growth/loss by sector (12-month change) Columbus -1,000 -1,000 -800 1,100 2,000 2,200 2,200 3,200 6,600 7,000 -2000 0 2000 4000 6000 8000 Information Financial Activities Government Manufacturing Leisure & Hospitality Professional & Business Services Other Services Mining and Logging Educational & Health Services Trade, Transportation & Utilities Number of Jobs Sources: Jones Lang LaSalle Research, Bureau of Labor Statistics • The Columbus metro continued on its run of expansion by recently adding 21,500 payrolls, annually, according to the latest figures from the BLS. Total non-farm employment now sits at roughly 1.02 million jobs. Meanwhile, unemployment currently stands at 4.4 percent, a decrease of 90 basis points, year-over-year. • Office employment sectors contracted over the last year, recording an annualized net loss of 600 jobs. Professional and business services was the only office-using supersector to post employment gains, adding 2,200 jobs, year-over-year. Meanwhile, the information and financial services supersectors each dropped 1,000 from payrolls, annually. • Total U.S. nonfarm employment increased by 223,000 jobs in April, a healthy uptick after a disappointing March where job gains totaled just 85,000. The strong April results will help lower concerns among economists and Wall Street of a hiring slowdown. • U.S. unemployment decreased 10 basis points to 5.4 percent, its lowest mark since May 2008. Wages also continued to trend in the right direction in April, increasing 2.2 percent year-over-year. (8.0) (4.0) 0.0 4.0 8.0 12.0 16.0 2011 2012 2013 2014 2015 Financial Activities Professional and Business Services Information Government 0.0% 2.0% 4.0% 6.0% 8.0% 10.0% 12.0% 750,000 800,000 850,000 900,000 950,000 1,000,000 2000 2001 2002 2003 2004 2005 2006 2007 2008 2009 2010 2011 2012 2013 2014 2015 Total Employment Unemployment Peak: 996,834 jobs 2.8% 4.4%Columbus unemployment 2.2%Columbus12-month job growth 5.4%U.S. unemployment 2.2%U.S. 12-month job growth
- 2. © 2015 Jones Lang LaSalle IP, Inc. All rights reserved. All information contained herein is from sources deemed reliable; however, no representation or warranty is made to the accuracy thereof. JLL Americas Research • Columbus Office Employment Update 2 March 2013 March 2014 March 2015 Total Non-farm Employment 972,100 2.0% 993,500 2.2% 1,015,000 2.2% Unemployment Rate 6.5% 5.3% 4.4% Columbus Supersectors March 2013 March 2014 March 2015 Mining, Logging and Construction 28,600 0.0% 31,700 10.8% 34,900 10.1% Manufacturing 68,700 2.5% 69,000 0.4% 70,100 1.6% Trade, Transportation, & Utilities 182,700 0.6% 185,200 1.4% 192,200 3.8% Information 18,300 8.9% 18,100 -1.1% 17,100 -5.5% Financial Activities 75,100 3.0% 75,100 0.0% 74,100 -1.3% Professional & Business Services 159,300 2.4% 169,500 6.4% 171,700 1.3% Educational & Health Services 139,700 1.7% 145,000 3.8% 151,600 4.6% Leisure & Hospitality 93,200 3.2% 95,700 2.7% 97,700 2.1% Other Services 37,600 3.9% 38,600 2.7% 40,800 5.7% Government 165,300 -0.7% 165,600 0.2% 164,800 -0.5% News on the street Columbus businesses expanding, contracting, etc. Employment statistics Columbus Industry employment stratification Columbus Aver Informatics Inc. Ι Computer Software: Expanding Aver Informatics, a fast-growing software and data analytics firm, will move into the entire 14th floor of the Huntington Center skyscraper on Capitol Square this fall. The technology company serving the health-care industry has shared space with investor Drive Capital LLC at 448 W. Nationwide Boulevard since coming to Columbus last year. According to company officials, the firm expects to double its staff of 53 by the end of the year. Dynamit Technologies LLC Ι Information Technology Services: Expanding In the year since moving into larger offices in the Arena District, fast-growing Dynamit Technologies LLC has had to take even more space. And at 80 people, the software and mobile application developer has more than surpassed its jobs growth pledge in a 2013 city tax incentive, when it hoped to grow to 65 jobs from 35. Dynamit is on pace to hire another 20 this year. Dynamit had $5.8 million in revenue in 2014 and is on pace to double that this year. Lextant Corp. Ι Consulting Service: Expanding Columbus-based Lextant Corp., a research and design consulting firm, is seeking a five-year, 50 percent Columbus Downtown Office incentive for its plans to create 40 new jobs and retain 45. Founded in 1998, Lextant has been working with the world’s leading companies to bring meaningful products and services to market. Lextant is currently located at 580 N. 4th Street in the Smith Brothers Hardware building in the Warehouse District. Neo Innovation Ι Information Technology Services: Contracting Neo Innovation has shut down operations of its Powell software development office three years after acquiring the former EdgeCase LLC. The office was down to about 12 software engineers, from 33 in three cities in 2012, when Tokyo-based Digital Garage bought and combined several U.S. firms under its New Context division. It was renamed Neo a few months later. Neo Columbus and the former EdgeCase specialized in agile development in the programming language Ruby. Ringside Search Partners Inc. Ι Staffing Services: Expanding Columbus-based Ringside Search Partners Inc., an employee staffing and executive search firm, is seeking a five-year, 50 percent Downtown Office Incentive for its plans to add 32 new jobs and retain 14. In roughly four years, Ringside has grown into a $2.1 million-dollar talent acquisition firm covering nine states and specializing in accounting, finance, tax, audit and information technology. Ringside occupies roughly 2,500 square feet in the PNC Plaza. Ventech Solutions Inc. Ι Information Technology Services: Expanding Ventech Solutions Inc. will add three offices and nearly 200 jobs over the next year to staff up for a 10-year contract managing data for a health care quality initiative for the federal Centers for Medicare and Medicaid Services. Ventech, which now has 125 employees in Columbus and at client sites, will add about 15 in Columbus as a result of the contract and try to shift more here through the decade, according to company officials. Cody Brooks Research Analyst Great Lakes Region tel +1 614 460 4444 Cody.Brooks@am.jll.com 65 E State Street, Suite 550 Columbus, OH 43215 www.jll.com/columbus Andrew Batson Senior Research Analyst Great Lakes Region tel +1 216 937 4374 Andrew.Batson@am.jll.com 127 Public Square, Suite 2410 Cleveland, OH 44114 www.jll.com/cleveland Trade, transportation and Utilities, 192,200, 19% Professional and Business Services, 171,700, 17% Government, 164,800, 16% Educational and Health Services, 151,600, 15% Leisure and Hospitality, 97,700, 10% Financial Activities, 74,100, 7% Manufacturing, 70,100, 7% Other Services, 40,800, 4% Mining, Logging and construction, 34,900, 3% Information, 17,100, 2%