Cleveland JLL Industrial Employment Update April 2015
•
1 like•125 views

Industrial employment sectors contracted slightly over the last year, recording an annualized net loss of 600 jobs across the metro. The largest job losses occurred in the trade, transportation and utilities sector, where total employment declined by 2,300 jobs year-over-year.

Recommended
Recommended
More Related Content
What's hot
What's hot (17)
Viewers also liked
Viewers also liked (17)
Similar to Cleveland JLL Industrial Employment Update April 2015
Similar to Cleveland JLL Industrial Employment Update April 2015 (20)
More from Andrew Batson
More from Andrew Batson (20)
Recently uploaded
Recently uploaded (20)
Cleveland JLL Industrial Employment Update April 2015
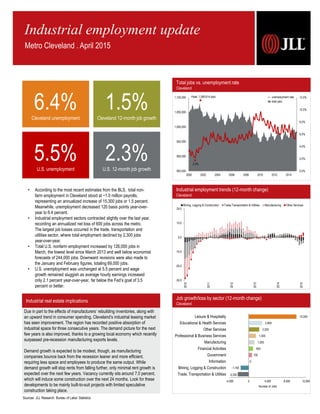
- 1. Sources: JLL Research, Bureau of Labor Statistics Job growth/loss by sector (12-month change) Cleveland -2,300 -1,700 0 700 900 1,200 1,500 2,200 2,800 10,000 -4,000 0 4,000 8,000 12,000 Trade, Transportation & Utilities Mining, Logging & Construction Information Government Financial Activities Manufacturing Professional & Business Services Other Services Educational & Health Services Leisure & Hospitality Number of Jobs Total jobs vs. unemployment rate Cleveland 0.0% 2.0% 4.0% 6.0% 8.0% 10.0% 12.0% 850,000 900,000 950,000 1,000,000 1,050,000 1,100,000 2000 2002 2004 2006 2008 2010 2012 2014 Peak: 1,080,614 jobs 2.2% unemployment rate total jobs Metro Cleveland . April 2015 6.4%Cleveland unemployment 1.5%Cleveland 12-month job growth 5.5%U.S. unemployment 2.3%U.S. 12-month job growth • According to the most recent estimates from the BLS, total non- farm employment in Cleveland stood at ~1.0 million payrolls, representing an annualized increase of 15,300 jobs or 1.5 percent. Meanwhile, unemployment decreased 120 basis points year-over- year to 6.4 percent. • Industrial employment sectors contracted slightly over the last year, recording an annualized net loss of 600 jobs across the metro. The largest job losses occurred in the trade, transportation and utilities sector, where total employment declined by 2,300 jobs year-over-year. • Total U.S. nonfarm employment increased by 126,000 jobs in March, the lowest level since March 2013 and well below economist forecasts of 244,000 jobs. Downward revisions were also made to the January and February figures, totaling 69,000 jobs. • U.S. unemployment was unchanged at 5.5 percent and wage growth remained sluggish as average hourly earnings increased only 2.1 percent year-over-year, far below the Fed’s goal of 3.5 percent or better. Industrial employment trends (12-month change) Cleveland -30.0 -20.0 -10.0 0.0 10.0 20.0 2010 2011 2012 2013 2014 2015 Mining, Logging & Construction Trade,Transportation & Utilities Manufacturing Other Services Due in part to the effects of manufacturers’ rebuilding inventories, along with an upward trend in consumer spending, Cleveland’s industrial leasing market has seen improvement. The region has recorded positive absorption of industrial space for three consecutive years. The demand picture for the next few years is also improved, thanks to a growing local economy which recently surpassed pre-recession manufacturing exports levels. Demand growth is expected to be modest, though, as manufacturing companies bounce back from the recession leaner and more efficient, requiring less space and employees to produce the same output. While demand growth will stop rents from falling further, only minimal rent growth is expected over the next few years. Vacancy currently sits around 7.0 percent, which will induce some construction over the next 24 months. Look for these developments to be mainly built-to-suit projects with limited speculative construction taking place. Industrial real estate implications Industrial employment update
- 2. February 2013 February 2014 February 2015 Total Non-farm Employment 1,004,800 1.0% 1,012,100 0.7% 1,027,400 1.5% Unemployment Rate 7.6% 7.6% 6.4% Cleveland Supersectors February 2013 February 2014 February 2015 Mining, Logging & Construction 29,700 1.4% 30,200 1.7% 28,500 -5.6% Manufacturing 123,700 1.1% 123,400 -0.2% 124,600 1.0% Trade, Transportation, & Utilities 177,200 0.5% 178,800 0.9% 176,500 -1.3% Information 15,000 -2.0% 14,600 -2.7% 14,600 0.0% Financial Activities 62,500 1.1% 64,300 2.9% 65,200 1.4% Professional & Business Services 139,600 0.7% 143,500 2.8% 145,000 1.0% Educational & Health Services 195,900 1.8% 194,900 -0.5% 197,700 1.4% Leisure & Hospitality 88,000 6.4% 89,700 1.9% 99,700 11.1% Other Services 39,100 -1.8% 39,200 0.3% 41,400 5.6% Government 134,100 -1.3% 133,500 -0.4% 134,200 0.5% News on the street Cleveland businesses expanding, contracting, etc. Employment statistics Cleveland Industry employment stratification Cleveland Educational & Health Services, 197,700, 19% Trade, Transportation & Utilities, 176,500, 17% Professional & Business Services, 145,000, 14% Government, 134,200, 13% Manufacturing, 124,600 , 12% Leisure & Hospitality, 99,700, 10% Financial Activities, 65,200 , 6% Other Services, 41,400, 4% Mining, Logging & Construction, 28,500, 3% Information, 14,600, 1% Andrew Batson Senior Research Analyst Great Lakes Region tel +1 216 937 4374 Andrew.Batson@am.jll.com 127 Public Square, Suite 2410 Cleveland, OH 44114 www.jll.com/cleveland Robert Kramp Senior Vice President – Americas Midwest & Great Lakes Research Director tel +1 312 228 2470 Robert.Kramp@am.jll.com 200 East Randolph Street, 47th Floor Chicago, IL 60601 www.us.joneslanglasalle.com/research © 2015 Jones Lang LaSalle IP, Inc. All rights reserved. All information contained herein is from sources deemed reliable; however, no representation or warranty is made to the accuracy thereof. JLL Americas Research • Cleveland Industrial Employment Update 2 Cleveland-Cuyahoga County Port Authority Ι Logistics: Expanding The Port Authority and Spliethoff Transport BV recently negotiated a new agreement for the operation of the Cleveland-Europe Express with the addition of a second monthly roundtrip sailing. The added service is attractive to shippers, particularly those that bring containers into the U.S. and need more frequent service. In its first year, the Cleveland-Europe Express carried more heavy machinery and other bulk cargo than containers, which are used for consumer product Core-Tech Ι Ceramic Fabrication: Expanding Core-Tech Inc., a ceramic core maker, is adding 17,000 square feet to its footprint in Mentor. Core-Tech makes precision ceramic cores for investment casting processes in a variety of industries. Core-Tech recently bought an adjacent building to its current operations in Mentor and plans to invest more than $1.2 million in equipment and upgrades to the facility. The company plans to hire an additional 10 people when operation begins at the new plant. Door to Door Organics Ι Grocery Stores & Supermarkets: Expanding Online grocery service Door to Door Organics plans an expansion into the Cleveland market. The Colorado-based company intends to open a distribution center at 6230 Cochran Road in Solon late this spring. The company will begin delivery service to 20 area communities from Cleveland to Akron. The company will have 15 local employees and has begun hiring for the new location. Ramco Specialties Ι Fasteners Manufacturing: Expanding Ramco, the maker and value-added distributor of nut and fastener products for the automobile and heavy trucking industry, is planning to construct a 165,000- square-foot building about a mile away from its three current buildings in Hudson. The new building will be at 5445 Hudson Industrial Parkway. Work on the new building will begin in May, with the project to be completed in December. Ramco is investing about $12 million in the new building. Ray Fogg Corporate Properties Ι Commercial Real Estate: Development A year after finishing its first office/warehouse building at Bluestone Business Center in Euclid, Ray Fogg Corporate Properties LLC already is taking steps for an encore. The Brooklyn Heights-based real estate developer and industrial construction contractor plans to add a building with 127,000 square feet of space at Bluestone as soon as possible this spring. Plans call for the structure with 32-foot-tall ceilings to be ready for tenants by summer's end. W Diamond Group Ι Apparel Manufacturing: Acquisitions The Hugo Boss men's clothing factory, which was scheduled to close in April, will remain open under new ownership. The Tiedeman Road facility is being sold to Chicago-based W Diamond Group. The company, which has a commitment to domestic manufacturing, makes Hart Schaffner Marx suits in Chicago. About 160 employees work at the facility. All employees will be retained as part of the sale, which is scheduled to be completed by the end of April.