JLL Chicago Chart of the Week - September 14, 2015
Columbus jll office employment update march 2015
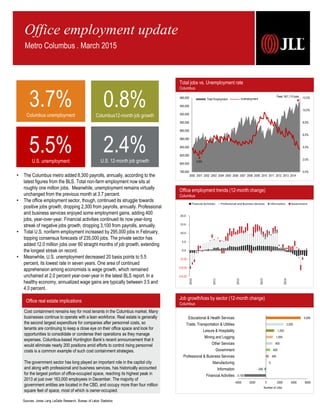
1. Office employment trends (12-month change)
Columbus
Total jobs vs. Unemployment rate
Columbus
Office employment update
Metro Columbus . March 2015
Cost containment remains key for most tenants in the Columbus market. Many
businesses continue to operate with a lean workforce. Real estate is generally
the second largest expenditure for companies after personnel costs, so
tenants are continuing to keep a close eye on their office space and look for
opportunities to consolidate or condense their operations as they manage
expenses. Columbus-based Huntington Bank’s recent announcement that it
would eliminate nearly 200 positions amid efforts to control rising personnel
costs is a common example of such cost containment strategies.
The government sector has long played an important role in the capitol city
and along with professional and business services, has historically accounted
for the largest portion of office-occupied space, reaching its highest peak in
2013 at just over 163,000 employees in December. The majority of
government entities are located in the CBD, and occupy more than four million
square feet of space, most of which is owner-occupied.
Office real estate implications
Job growth/loss by sector (12-month change)
Columbus
-3,100
-200
0
400
600
900
1,000
1,200
2,500
5,000
-4000 -2000 0 2000 4000 6000
Financial Activities
Information
Manufacturing
Professional & Business Services
Government
Other Services
Mining and Logging
Leisure & Hospitality
Trade, Transportation & Utilities
Educational & Health Services
Number of Jobs
0.0%
2.0%
4.0%
6.0%
8.0%
10.0%
12.0%
780,000
800,000
820,000
840,000
860,000
880,000
900,000
920,000
940,000
960,000
2000 2001 2002 2003 2004 2005 2006 2007 2008 2009 2010 2011 2012 2013 2014
Peak: 951,110 jobs
2.6%
Total Employment Unemployment
Sources: Jones Lang LaSalle Research, Bureau of Labor Statistics
3.7%Columbus unemployment
0.8%Columbus12-month job growth
5.5%U.S. unemployment
2.4%U.S. 12-month job growth
• The Columbus metro added 8,300 payrolls, annually, according to the
latest figures from the BLS. Total non-farm employment now sits at
roughly one million jobs. Meanwhile, unemployment remains virtually
unchanged from the previous month at 3.7 percent.
• The office employment sector, though, continued its struggle towards
positive jobs growth, dropping 2,300 from payrolls, annually. Professional
and business services enjoyed some employment gains, adding 400
jobs, year-over-year. Financial activities continued its now year-long
streak of negative jobs growth, dropping 3,100 from payrolls, annually.
• Total U.S. nonfarm employment increased by 295,000 jobs in February,
topping consensus forecasts of 235,000 jobs. The private sector has
added 12.0 million jobs over 60 straight months of job growth, extending
the longest streak on record.
• Meanwhile, U.S. unemployment decreased 20 basis points to 5.5
percent, its lowest rate in seven years. One area of continued
apprehension among economists is wage growth, which remained
unchained at 2.0 percent year-over-year in the latest BLS report. In a
healthy economy, annualized wage gains are typically between 3.5 and
4.0 percent.
(15.0)
(10.0)
(5.0)
0.0
5.0
10.0
15.0
20.0
2010
2011
2012
2013
2014
Financial Activities Professional and Business Services Information Government