
Recommended
Recommended
More Related Content
What's hot
What's hot (15)
Viewers also liked
Viewers also liked (16)
Similar to JLL Pittsburgh Office Employment Update April 2015
Similar to JLL Pittsburgh Office Employment Update April 2015 (20)
More from JLL_Midwest_Great_Lakes_Research
More from JLL_Midwest_Great_Lakes_Research (20)
Recently uploaded
Recently uploaded (20)
JLL Pittsburgh Office Employment Update April 2015
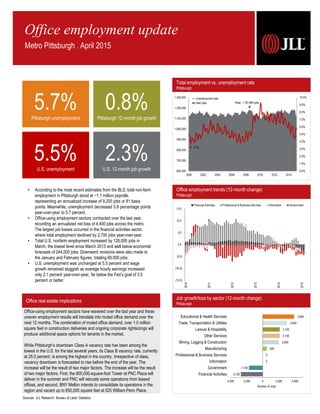
- 1. Office real estate implications Sources: JLL Research, Bureau of Labor Statistics Job growth/loss by sector (12-month change) Pittsburgh -2,700 -1,700 0 0 500 2,000 2,100 2,100 3,000 3,900 -4,000 -2,000 0 2,000 4,000 Financial Activities Government Information Professional & Business Services Manufacturing Mining, Logging & Construction Other Services Leisure & Hospitality Trade, Transportation & Utilities Educational & Health Services Number of Jobs Office-using employment sectors have wavered over the last year and these uneven employment results will translate into muted office demand over the next 12 months. The combination of muted office demand, over 1.0 million square feet in construction deliveries and ongoing corporate rightsizings will produce additional space options for tenants in the market. While Pittsburgh’s downtown Class A vacancy rate has been among the lowest in the U.S. for the last several years, its Class B vacancy rate, currently at 25.0 percent, is among the highest in the country. Irrespective of class, vacancy downtown is forecasted to rise before the end of the year. The increase will be the result of two major factors. The increase will be the result of two major factors. First, the 800,000-square-foot Tower at PNC Plaza will deliver in the summer and PNC will relocate some operations from leased offices, and second, BNY Mellon intends to consolidate its operations in the region and vacant up to 650,000 square feet at 525 William Penn Place. Total employment vs. unemployment rate Pittsburgh 0.0% 1.0% 2.0% 3.0% 4.0% 5.0% 6.0% 7.0% 8.0% 9.0% 10.0% 600,000 700,000 800,000 900,000 1,000,000 1,100,000 1,200,000 1,300,000 2000 2002 2004 2006 2008 2010 2012 2014 Peak: 1,187,884 jobs 3.7% unemployment rate total jobs (15.0) (10.0) (5.0) 0.0 5.0 10.0 15.0 2010 2011 2012 2013 2014 2015 Financial Activities Professional & Business Services Information Government Office employment trends (12-month change) Pittsburgh Office employment update Metro Pittsburgh . April 2015 5.7%Pittsburgh unemployment 0.8%Pittsburgh 12-month job growth 5.5%U.S. unemployment 2.3%U.S. 12-month job growth • According to the most recent estimates from the BLS, total non-farm employment in Pittsburgh stood at ~1.1 million payrolls, representing an annualized increase of 9,200 jobs or 81 basis points. Meanwhile, unemployment decreased 0.8 percentage points year-over-year to 5.7 percent. • Office-using employment sectors contracted over the last year, recording an annualized net loss of 4,400 jobs across the metro. The largest job losses occurred in the financial activities sector, where total employment declined by 2,700 jobs year-over-year. • Total U.S. nonfarm employment increased by 126,000 jobs in March, the lowest level since March 2013 and well below economist forecasts of 244,000 jobs. Downward revisions were also made to the January and February figures, totaling 69,000 jobs. • U.S. unemployment was unchanged at 5.5 percent and wage growth remained sluggish as average hourly earnings increased only 2.1 percent year-over-year, far below the Fed’s goal of 3.5 percent or better.
- 2. JLL Americas Research • Pittsburgh Office Employment Update 2 February 2013 February 2014 February 2015 Total Non-farm Employment 1,140,800 0.3% 1,135,200 -0.5% 1,144,400 0.8% Unemployment Rate 7.6% 6.5% 5.7% Pittsburgh Supersectors February 2013 February 2014 February 2015 Mining, Logging & Construction 57,100 0.5% 56,700 -0.7% 58,700 3.5% Manufacturing 89,200 0.5% 88,200 -1.1% 88,700 0.6% Trade, Transportation, & Utilities 211,600 -1.5% 211,000 -0.3% 214,000 1.4% Information 18,200 0.0% 18,100 -0.5% 18,100 0.0% Financial Activities 70,900 1.3% 70,700 -0.3% 68,000 -3.8% Professional & Business Services 172,200 2.7% 171,600 -0.3% 171,600 0.0% Educational & Health Services 243,400 0.0% 242,200 -0.5% 246,100 1.6% Leisure & Hospitality 105,200 2.6% 106,100 0.9% 108,200 2.0% Other Services 50,200 -1.4% 50,300 0.2% 52,400 4.2% Government 122,800 -1.1% 120,300 -2.0% 118,600 -1.4% News on the street Pittsburgh businesses expanding, contracting, etc. Columbia Gas Ι Natural Gas Distribution: Expanding Columbia Gas of Pennsylvania recently broke ground on neighboring training and operations centers in Beaver County. According to company spokeswoman, the operations center will replace an existing facility, which after 30 years, the company has outgrown. Along with the new operations building, the company is building an employee training center. Both facilities will be outside Monaca, near the Beaver Valley Mall. Mullen Communications Ι Advertising Agencies: Ceased Operations Mullen’s Pittsburgh office recently ceased operations. The ad agency lost its largest client, Highmark Health at the end of 2014 and its Boston-based parent company decided to shutter the office. About 25 employees stayed through the first part of 2015 to help transition clients. The Pittsburgh agency had gone through many changes in its 29-year history but it had historically tipped heavily toward having a single client dominate its business. Oxford Development Ι Commercial Real Estate: Development Oxford is considering increasing the number of floors in its proposed 350 Fifth Avenue skyscraper on Smithfield Street from 20 to 29 in a bid to attract an anchor tenant that would allow the company to get started on the $200 million project. Steve Guy, Oxford’s CEO, said the company is “reacting to needs” in adding more floors to the building. “We’re just trying to keep up with the people out there looking for space,” he said. Stantec Ι Engineering Services: Relocation A team of Stantec engineers, architects and others recently moved into an office at Southpointe, ground zero for companies working in the Marcellus shale industry. The Southpointe location will serve as the U.S. oil and gas pipeline office for the Edmonton-based Stantec. The engineering firm is focused on growing its energy business unit, which specializes in pipeline development, well pad construction and related environmental services. The Davis Companies Ι Commercial Real Estate: Development After buying the Union Trust Building for $14 million in March 2014, The Davis Companies expects to invest up to $100 million to restore and modernize the building, according to a statement. The figure includes the original purchase price. Davis recently selected Mascaro Construction to help renovate the 500,000-square-foot building, a gothic style structure commissioned by Henry Clay Frick that ranks among downtown's most architecturally significant structures. Union Real Estate Ι Commercial Real Estate: Capital Markets The Allegheny Building, an office tower built in the early 20th century, has been put up for sale by its owner, Union Real Estate. Rich Beynon, president of downtown-based Beynon & Co., is representing the 19-story building at a list price of $7.8 million, or about $53 per square foot. The Class C property totals 150,000 square feet with 8,000-square-foot floors and is approximately 75 percent occupied. Industry employment stratification Pittsburgh Educational & Health Services, 246,100, 22% Trade, Transportation & Utilities, 214,000, 19% Professional & Business Services, 171,600 , 15% Government, 118,600 , 10% Leisure & Hospitality, 108,200, 9% Manufacturing, 88,700, 8% Financial Activities, 68,000 , 6% Mining, Logging & Construction, 58,700, 5% Other Services, 52,400, 5% Information, 18,100, 2% Andrew Batson Senior Research Analyst Great Lakes Region tel +1 412 208 1400 Andrew.Batson@am.jll.com 525 William Penn Place Suite 2500 Pittsburgh, PA 15259 www.jll.com/pittsburgh © 2015 Jones Lang LaSalle IP, Inc. All rights reserved. All information contained herein is from sources deemed reliable; however, no representation or warranty is made to the accuracy thereof. Employment statistics Pittsburgh Robert Kramp Senior Vice President – Americas Midwest & Great Lakes Research Director tel +1 312 228 2470 Robert.Kramp@am.jll.com 200 East Randolph Street, 47th Floor Chicago, IL 60601 www.us.joneslanglasalle.com/research