
Recommended
Recommended
More Related Content
What's hot
What's hot (15)
Viewers also liked
Viewers also liked (20)
Similar to Columbus JLL Office Employment Update April 2015
Similar to Columbus JLL Office Employment Update April 2015 (20)
More from JLL_Midwest_Great_Lakes_Research
More from JLL_Midwest_Great_Lakes_Research (20)
Recently uploaded
Recently uploaded (20)
Columbus JLL Office Employment Update April 2015
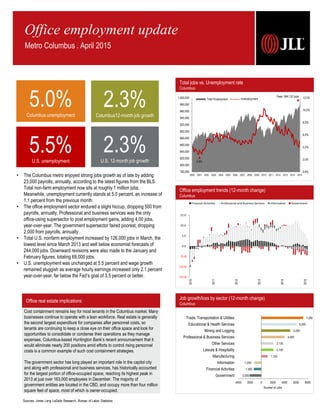
- 1. Office employment trends (12-month change) Columbus Total jobs vs. Unemployment rate Columbus Office employment update Metro Columbus . April 2015 Cost containment remains key for most tenants in the Columbus market. Many businesses continue to operate with a lean workforce. Real estate is generally the second largest expenditure for companies after personnel costs, so tenants are continuing to keep a close eye on their office space and look for opportunities to consolidate or condense their operations as they manage expenses. Columbus-based Huntington Bank’s recent announcement that it would eliminate nearly 200 positions amid efforts to control rising personnel costs is a common example of such cost containment strategies. The government sector has long played an important role in the capitol city and along with professional and business services, has historically accounted for the largest portion of office-occupied space, reaching its highest peak in 2013 at just over 163,000 employees in December. The majority of government entities are located in the CBD, and occupy more than four million square feet of space, most of which is owner-occupied. Office real estate implications Job growth/loss by sector (12-month change) Columbus -2,000 -1,300 -1,200 1,100 2,100 2,100 4,000 5,000 6,000 7,200 -4000 -2000 0 2000 4000 6000 8000 Government Financial Activities Information Manufacturing Leisure & Hospitality Other Services Professional & Business Services Mining and Logging Educational & Health Services Trade, Transportation & Utilities Number of Jobs 0.0% 2.0% 4.0% 6.0% 8.0% 10.0% 12.0% 780,000 800,000 820,000 840,000 860,000 880,000 900,000 920,000 940,000 960,000 980,000 1,000,000 2000 2001 2002 2003 2004 2005 2006 2007 2008 2009 2010 2011 2012 2013 2014 2015 Peak: 984,122 jobs 2.8% Total Employment Unemployment Sources: Jones Lang LaSalle Research, Bureau of Labor Statistics 5.0%Columbus unemployment 2.3%Columbus12-month job growth 5.5%U.S. unemployment 2.3%U.S. 12-month job growth • The Columbus metro enjoyed strong jobs growth as of late by adding 23,000 payrolls, annually, according to the latest figures from the BLS. Total non-farm employment now sits at roughly 1 million jobs. Meanwhile, unemployment currently stands at 5.0 percent, an increase of 1.1 percent from the previous month. • The office employment sector endured a slight hiccup, dropping 500 from payrolls, annually. Professional and business services was the only office-using supersector to post employment gains, adding 4,00 jobs, year-over-year. The government supersector faired poorest, dropping 2,000 from payrolls, annually. • Total U.S. nonfarm employment increased by 126,000 jobs in March, the lowest level since March 2013 and well below economist forecasts of 244,000 jobs. Downward revisions were also made to the January and February figures, totaling 69,000 jobs. • U.S. unemployment was unchanged at 5.5 percent and wage growth remained sluggish as average hourly earnings increased only 2.1 percent year-over-year, far below the Fed’s goal of 3.5 percent or better. (15.0) (10.0) (5.0) 0.0 5.0 10.0 15.0 2010 2011 2012 2013 2014 2015 Financial Activities Professional and Business Services Information Government
- 2. © 2015 Jones Lang LaSalle IP, Inc. All rights reserved. All information contained herein is from sources deemed reliable; however, no representation or warranty is made to the accuracy thereof. JLL Americas Research • Columbus Office Employment Update 2 February 2013 February 2014 February 2015 Total Non-farm Employment 968,500 2.2% 990,200 2.2% 1,013,200 2.3% Unemployment Rate 7.0% 5.9% 5.0% Columbus Supersectors February 2013 February 2014 February 2015 Mining, Logging and Construction 28,600 2.9% 30,200 5.6% 35,200 16.6% Manufacturing 68,700 2.7% 69,100 0.6% 70,200 1.6% Trade, Transportation, & Utilities 182,700 0.7% 185,400 1.5% 192,600 3.9% Information 18,300 8.9% 18,200 -0.5% 17,000 -6.6% Financial Activities 75,100 3.6% 75,300 0.3% 74,000 -1.7% Professional & Business Services 159,300 3.2% 168,900 6.0% 172,900 2.4% Educational & Health Services 139,700 1.7% 144,900 3.7% 150,900 4.1% Leisure & Hospitality 93,200 6.0% 93,900 0.8% 96,000 2.2% Other Services 37,600 4.4% 38,400 2.1% 40,500 5.5% Government 165,300 -0.9% 165,900 0.4% 163,900 -1.2% News on the street Columbus businesses expanding, contracting, etc. Employment statistics Columbus Industry employment stratification Columbus Berardi & Partners Ι Architectural Services: Relocating The Berardi & Partners design firm plans to leave its home on the edge of German Village for one of three office buildings the Edwards Cos. development firm built in Grandview Heights nearly nine years ago. Records show Goodale IV LLC, real estate affiliate of the design firm, purchased the 15,738-square-foot office property at 1398 Goodale Blvd. for $2.1 million. The firm will move into about 11,000 square feet that's occupied by the Conrad Phillips Vutec. Coyote Logistics Ι Freight Forwarding Services: Expanding Chicago-based logistics provider, Coyote Logistics, plans to relocate its administrative operations from Hilliard and expand its regional offices at the mixed-use complex at 250 S. High Street. under construction downtown. Daimler Group and Kaufman Development expect to finish the project this year. Coyote looks to add 50 new jobs while moving 34 existing jobs with its relocation. According to the firm, Coyote was attracted to Columbus strategist logistics hub among other factors. Lextant Corp. Ι Consulting Service: Expanding Columbus-based Lextant Corp., a research and design consulting firm, is seeking a five-year, 50 percent Columbus Downtown Office incentive for its plans to create 40 new jobs and retain 45. Founded in 1998, Lextant has been working with the world’s leading companies to bring meaningful products and services to market. Lextant is currently located at 580 N. 4th Street in the Smith Brothers Hardware building in the Warehouse District. Neo Innovation Ι Information Technology Services: Contracting Neo Innovation has shut down operations of its Powell software development office three years after acquiring the former EdgeCase LLC. The office was down to about 12 software engineers, from 33 in three cities in 2012, when Tokyo-based Digital Garage bought and combined several U.S. firms under its New Context division. It was renamed Neo a few months later. Neo Columbus and the former EdgeCase specialized in agile development in the programming language Ruby. Ringside Search Partners Inc. Ι Staffing Services: Expanding Columbus-based Ringside Search Partners Inc., an employee staffing and executive search firm, is seeking a five-year, 50 percent Downtown Office Incentive for its plans to add 32 new jobs and retain 14. In roughly four years, Ringside has grown into a $2.1 million-dollar talent acquisition firm covering nine states and specializing in accounting, finance, tax, audit and information technology. Ringside occupies roughly 2,500 square feet in the PNC Plaza. Thelab Ι Advertising Agencies: Expanding A New York creative production agency is making Columbus its Midwest home. Thelab, which counts Victoria's Secret among its clients, has taken 5,500 square feet at 855 Grandview Avenue and expects to hire between 10 and 15 employees in the next 18 months. Thelab was founded in 2002 as a creative retouching agency and has grown into a full-service production group. It has 90 employees between its New York and Los Angeles offices. Cody Brooks Research Analyst tel +1 614 460 4444 Cody.Brooks@am.jll.com 65 E State Street, Suite 550 Columbus, OH 43215 www.jll.com/columbus Robert Kramp Senior Vice President – Americas Midwest & Great Lakes Research Director tel +1 312 228 2470 Robert.Kramp@am.jll.com 200 East Randolph Street, 47th Floor Chicago, IL 60601 www.us.joneslanglasalle.com/research Trade, transportation and Utilities, 192,600, 19% Professional and Business Services, 172,900, 17% Government, 163,900, 16% Educational and Health Services, 150,900, 15% Leisure and Hospitality, 96,000, 10% Financial Activities, 74,000, 7% Manufacturing, 70,200, 7% Other Services, 40,500, 4% Mining, Logging and construction, 35,200, 3% Information, 17,000, 2%