
Recommended
Recommended
More Related Content
What's hot
What's hot (16)
Viewers also liked
Viewers also liked (17)
Similar to Cleveland JLL Office Employment Update April 2015
Similar to Cleveland JLL Office Employment Update April 2015 (20)
More from JLL_Midwest_Great_Lakes_Research
More from JLL_Midwest_Great_Lakes_Research (20)
Recently uploaded
Recently uploaded (20)
Cleveland JLL Office Employment Update April 2015
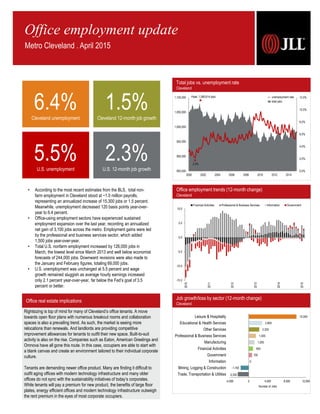
- 1. Office real estate implications Sources: JLL Research, Bureau of Labor Statistics Job growth/loss by sector (12-month change) Cleveland -2,300 -1,700 0 700 900 1,200 1,500 2,200 2,800 10,000 -4,000 0 4,000 8,000 12,000 Trade, Transportation & Utilities Mining, Logging & Construction Information Government Financial Activities Manufacturing Professional & Business Services Other Services Educational & Health Services Leisure & Hospitality Number of Jobs Rightsizing is top of mind for many of Cleveland’s office tenants. A move towards open floor plans with numerous breakout rooms and collaboration spaces is also a prevailing trend. As such, the market is seeing more relocations than renewals. And landlords are providing competitive improvement allowances for tenants to outfit their new space. Built-to-suit activity is also on the rise. Companies such as Eaton, American Greetings and Omnova have all gone this route. In this case, occupiers are able to start with a blank canvas and create an environment tailored to their individual corporate culture. Tenants are demanding newer office product. Many are finding it difficult to outfit aging offices with modern technology infrastructure and many older offices do not sync with the sustainability initiatives of today’s corporates. While tenants will pay a premium for new product, the benefits of large floor plates, energy efficient offices and modern technology infrastructure outweigh the rent premium in the eyes of most corporate occupiers. Total jobs vs. unemployment rate Cleveland 0.0% 2.0% 4.0% 6.0% 8.0% 10.0% 12.0% 850,000 900,000 950,000 1,000,000 1,050,000 1,100,000 2000 2002 2004 2006 2008 2010 2012 2014 Peak: 1,080,614 jobs 2.2% unemployment rate total jobs Office employment trends (12-month change) Cleveland Office employment update Metro Cleveland . April 2015 6.4%Cleveland unemployment 1.5%Cleveland 12-month job growth 5.5%U.S. unemployment 2.3%U.S. 12-month job growth • According to the most recent estimates from the BLS, total non- farm employment in Cleveland stood at ~1.0 million payrolls, representing an annualized increase of 15,300 jobs or 1.5 percent. Meanwhile, unemployment decreased 120 basis points year-over- year to 6.4 percent. • Office-using employment sectors have experienced sustained employment expansion over the last year, recording an annualized net gain of 3,100 jobs across the metro. Employment gains were led by the professional and business services sector, which added 1,500 jobs year-over-year. • Total U.S. nonfarm employment increased by 126,000 jobs in March, the lowest level since March 2013 and well below economist forecasts of 244,000 jobs. Downward revisions were also made to the January and February figures, totaling 69,000 jobs. • U.S. unemployment was unchanged at 5.5 percent and wage growth remained sluggish as average hourly earnings increased only 2.1 percent year-over-year, far below the Fed’s goal of 3.5 percent or better. -15.0 -10.0 -5.0 0.0 5.0 10.0 2010 2011 2012 2013 2014 2015 Financial Activities Professional & Business Services Information Government
- 2. JLL Americas Research • Cleveland Office Employment Update 2 February 2013 February 2014 February 2015 Total Non-farm Employment 1,004,800 1.0% 1,012,100 0.7% 1,027,400 1.5% Unemployment Rate 7.6% 7.6% 6.4% Cleveland Supersectors February 2013 February 2014 February 2015 Mining, Logging & Construction 29,700 1.4% 30,200 1.7% 28,500 -5.6% Manufacturing 123,700 1.1% 123,400 -0.2% 124,600 1.0% Trade, Transportation, & Utilities 177,200 0.5% 178,800 0.9% 176,500 -1.3% Information 15,000 -2.0% 14,600 -2.7% 14,600 0.0% Financial Activities 62,500 1.1% 64,300 2.9% 65,200 1.4% Professional & Business Services 139,600 0.7% 143,500 2.8% 145,000 1.0% Educational & Health Services 195,900 1.8% 194,900 -0.5% 197,700 1.4% Leisure & Hospitality 88,000 6.4% 89,700 1.9% 99,700 11.1% Other Services 39,100 -1.8% 39,200 0.3% 41,400 5.6% Government 134,100 -1.3% 133,500 -0.4% 134,200 0.5% News on the street Cleveland businesses expanding, contracting, etc. Benesch Ι Legal Services: Relocating Leaders at the Benesch law firm have reached an agreement with developer Stark Enterprises to occupy roughly 66,500 square feet at a new office building that will be part of a $430 million proposed nuCLEus project that could include a 54-story tower, largely filled with apartments; a bridge-like hotel; stores; restaurants; and parking garages. The Benesch deal marks the first tenant commitment to nuCLEus, an ambitious undertaking by Stark and J-Dek Investments of Solon. Cordell & Cordell Ι Legal Services: Expansion Cordell & Cordell, a law firm that focuses on representing men in family law cases, has opened an office in Cleveland. The Cleveland office, located downtown at 600 Superior Avenue, “will broaden the opportunities for divorcing dads to gain information and counsel,” the company said in a news release. Cordell & Cordell said it has more than 170 attorneys working in 105 offices in 31 states nationwide. Forest City Enterprises Ι Commercial Real Estate: REIT Conversion Forest City Enterprises (NYSE:FCE.A) still aims to sell or shed a partial stake in a handful of properties, including most of its Cleveland buildings, as the company readies to become a real estate investment trust (REIT). The company announced in January that it plans to transform its corporate structure, in a move that will help keep its tax burden low. The $8.8 billion real estate business expects to transform from a C-Corp into a REIT on Jan. 1, 2016. K&D Group Ι Commercial Real Estate: Acquisition The 21-story Keith Building is the latest downtown Cleveland office building to become part of Willoughby-based apartment owner and developer K&D Group’s portfolio. Unlike K&D’s other office deals last year, the Halle and Leader buildings, Keith will remain an office building. Through 1621 Keith LLC, K&D on March 24 paid $5.2 million for a place to try to put office tenants from Halle and Leader. North Point Properties Ι Commercial Real Estate: Acquisition Rockwood Center, located at 6505 Rockside Road in Independence, was recently acquired for $2.5 million ($76 per square foot) by North Point Properties of Cleveland from an affiliate of Omni Property Companies of Warrensville Heights. Daniel Dzina, president of North Point Properties, said he plans to locate his commercial real estate firm on the first floor of Rockwood. The 32,000-square-foot building was 97 percent occupied at the time of sale. Spero-Smith Investment Advisers Ι Asset Management: Expanding Spero-Smith Investment Advisers, one of the largest independent investment management firms in Northeast Ohio, has relocated its operations from Beachwood to 8,000 square feet on the 27th floor of Terminal Tower in downtown Cleveland. The company comprises 13 employees today, but will be hiring another two or three additional staff in the coming months, according to a statement from the company’s president and chief operating officer, Jeffrey Malbasa. Employment statistics Cleveland Industry employment stratification Cleveland Educational & Health Services, 197,700, 19% Trade, Transportation & Utilities, 176,500, 17% Professional & Business Services, 145,000, 14% Government, 134,200, 13% Manufacturing, 124,600 , 12% Leisure & Hospitality, 99,700, 10% Financial Activities, 65,200 , 6% Other Services, 41,400, 4% Mining, Logging & Construction, 28,500, 3% Information, 14,600, 1% Andrew Batson Senior Research Analyst Great Lakes Region tel +1 216 937 4374 Andrew.Batson@am.jll.com 127 Public Square, Suite 2410 Cleveland, OH 44114 www.jll.com/cleveland Robert Kramp Senior Vice President – Americas Midwest & Great Lakes Research Director tel +1 312 228 2470 Robert.Kramp@am.jll.com 200 East Randolph Street, 47th Floor Chicago, IL 60601 www.us.joneslanglasalle.com/research © 2015 Jones Lang LaSalle IP, Inc. All rights reserved. All information contained herein is from sources deemed reliable; however, no representation or warranty is made to the accuracy thereof.