JLL Cleveland Office Employment Update February 2015
•
1 like•179 views

Office-using employment sectors have experienced modest employment expansion over the last year, recording an annualized net gain of 2,900 jobs across the metro. Employment gains were led by the professional and business services sector, which added 4,700 jobs year-over-year.

Recommended
Recommended
More Related Content
What's hot
What's hot (14)
Viewers also liked
Viewers also liked (18)
Similar to JLL Cleveland Office Employment Update February 2015
Similar to JLL Cleveland Office Employment Update February 2015 (20)
More from Andrew Batson
More from Andrew Batson (18)
Recently uploaded
Recently uploaded (20)
JLL Cleveland Office Employment Update February 2015
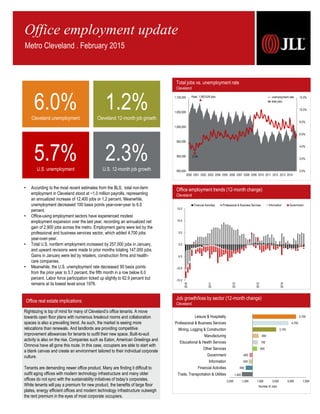
- 1. Office real estate implications Sources: JLL Research, Bureau of Labor Statistics Job growth/loss by sector (12-month change) Cleveland -1,400 -900 -500 -400 600 700 800 3,100 4,700 5,700 -3,000 -1,000 1,000 3,000 5,000 7,000 Trade, Transportation & Utilities Financial Activities Information Government Other Services Educational & Health Services Manufacturing Mining, Logging & Construction Professional & Business Services Leisure & Hospitality Number of Jobs Rightsizing is top of mind for many of Cleveland’s office tenants. A move towards open floor plans with numerous breakout rooms and collaboration spaces is also a prevailing trend. As such, the market is seeing more relocations than renewals. And landlords are providing competitive improvement allowances for tenants to outfit their new space. Built-to-suit activity is also on the rise. Companies such as Eaton, American Greetings and Omnova have all gone this route. In this case, occupiers are able to start with a blank canvas and create an environment tailored to their individual corporate culture. Tenants are demanding newer office product. Many are finding it difficult to outfit aging offices with modern technology infrastructure and many older offices do not sync with the sustainability initiatives of today’s corporates. While tenants will pay a premium for new product, the benefits of large floor plates, energy efficient offices and modern technology infrastructure outweigh the rent premium in the eyes of most corporate occupiers. Total jobs vs. unemployment rate Cleveland 0.0% 2.0% 4.0% 6.0% 8.0% 10.0% 12.0% 850,000 900,000 950,000 1,000,000 1,050,000 1,100,000 2000 2001 2002 2003 2004 2005 2006 2007 2008 2009 2010 2011 2012 2013 2014 Peak: 1,083,529 jobs 3.3% unemployment rate total jobs -15.0 -10.0 -5.0 0.0 5.0 10.0 15.0 2010 2011 2012 2013 2014 Financial Activities Professional & Business Services Information Government Office employment trends (12-month change) Cleveland Office employment update Metro Cleveland . February 2015 6.0%Cleveland unemployment 1.2%Cleveland 12-month job growth 5.7%U.S. unemployment 2.3%U.S. 12-month job growth • According to the most recent estimates from the BLS, total non-farm employment in Cleveland stood at ~1.0 million payrolls, representing an annualized increase of 12,400 jobs or 1.2 percent. Meanwhile, unemployment decreased 100 basis points year-over-year to 6.0 percent. • Office-using employment sectors have experienced modest employment expansion over the last year, recording an annualized net gain of 2,900 jobs across the metro. Employment gains were led by the professional and business services sector, which added 4,700 jobs year-over-year. • Total U.S. nonfarm employment increased by 257,000 jobs in January, and upward revisions were made to prior months totaling 147,000 jobs. Gains in January were led by retailers, construction firms and health- care companies. • Meanwhile, the U.S. unemployment rate decreased 90 basis points from the prior year to 5.7 percent, the fifth month in a row below 6.0 percent. Labor force participation ticked up slightly to 62.9 percent but remains at its lowest level since 1978.
- 2. JLL Americas Research • Cleveland Office Employment Update 2 December 2012 December 2013 December 2014 Total Non-farm Employment 1,031,500 1.7% 1,031,300 0.0% 1,043,700 1.2% Unemployment Rate 7.0% 7.0% 6.0% Cleveland Supersectors December 2012 December 2013 December 2014 Mining, Logging & Construction 33,900 -1.5% 33,900 0.0% 37,000 9.1% Manufacturing 124,600 1.4% 124,500 -0.1% 125,300 0.6% Trade, Transportation, & Utilities 187,100 1.4% 187,600 0.3% 186,200 -0.7% Information 15,200 -1.9% 15,200 0.0% 14,700 -3.3% Financial Activities 63,000 1.3% 62,500 -0.8% 61,600 -1.4% Professional & Business Services 144,300 1.7% 145,800 1.0% 150,500 3.2% Educational & Health Services 196,800 2.8% 198,200 0.7% 198,900 0.4% Leisure & Hospitality 92,600 7.3% 89,800 -3.0% 95,500 6.3% Other Services 39,800 -0.7% 40,000 0.5% 40,600 1.5% Government 134,200 -0.9% 133,800 -0.3% 133,400 -0.3% News on the street Cleveland businesses expanding, contracting, etc. Hartland & Company Ι Financial Consultant: Acquisition Hartland & Company, a Cleveland-based institutional and private wealth advisory firm, recently announced its acquisition of Portland, Maine-based independent wealth adviser Plimsoll Mark Capital. The transaction was completed on December 31. Financial terms of the deal were not disclosed. Hartland advises about 70 institutions and about 250 private families and individuals on roughly $15 billion in combined assets. Hyland Software Ι Management Software: Expanding Hyland Software, creator of OnBase, has embarked upon a hiring spree that could take its workforce past the 2,000 threshold this year. The private company, an expert in workflow management, plans to hire 200 people in the coming months to meet growing demand for its products. Hyland currently employs about 1,800 people worldwide, including 1,400 at its campus off Clemons Road in Westlake, making it the largest software company in Greater Cleveland. Oswald Companies Ι Investment Firms: Expanding Cleveland-based Oswald Companies, an independent insurance brokerage firm, has opened two satellite offices in Toledo and Cincinnati and is engaged in talks for acquisitions that could further expand its growing Midwest footprint. Oswald president David Jacobs said the company has seen organic growth of at least 10% annually since about 2010. Panther Premium Logistics Ι Logistics Services: Relocation Panther Premium Logistics, a specialized freight carrier based in the Medina County community of Seville since 2004, has completed the move to its new corporate headquarters and dispatch center in Sharon Township. The new facility, also in Medina County, has 50,000 square feet of office space and a 9,000-square-foot service bay for applying decals and GPS units to trucks. Signet Enterprises Ι Consulting Services: Expanding Signet Enterprises, an Akron-based diversified financial investment enterprise, has launched its sixth company, Signet Capital Advisors, in downtown Cleveland. The new company offers capital and business advisory solutions for middle-market companies, currently specializing in merger and acquisition advice, corporate development, raising of capital, debt placement and valuation services Summit Cleveland LP Ι Commercial Real Estate: Acquisition Northeast Ohio's largest suburban office park changed hands recently in a $26.5 million transaction that brought new blood to the Cleveland commercial real estate market. Summit Cleveland LP, Canadian investor group, bought Summit Office Park from Aegon, a lender that has owned the Independence properties since 2009. The sale involved nearly 500,000 square feet of office space across four buildings in the Rockside Road submarket. Employment statistics Cleveland Industry employment stratification Cleveland Educational & Health Services, 198,900, 19% Trade, Transportation & Utilities, 186,200, 18% Professional & Business Services, 150,500, 14% Government, 133,400, 13% Manufacturing, 125,300 , 12% Leisure & Hospitality, 95,500, 9% Financial Activities, 61,600 , 6% Other Services, 40,600, 4% Mining, Logging & Construction, 37,000, 4% Information, 14,700, 1% Andrew Batson Senior Research Analyst Great Lakes Region tel +1 216 937 4374 Andrew.Batson@am.jll.com 127 Public Square, Suite 2410 Cleveland, OH 44114 www.jll.com/cleveland Robert Kramp Senior Vice President – Americas Midwest & Great Lakes Research Director tel +1 312 228 2470 Robert.Kramp@am.jll.com 200 East Randolph Street, 47th Floor Chicago, IL 60601 www.us.joneslanglasalle.com/research © 2015 Jones Lang LaSalle IP, Inc. All rights reserved. All information contained herein is from sources deemed reliable; however, no representation or warranty is made to the accuracy thereof.