
Recommended
Recommended
More Related Content
What's hot
What's hot (18)
Viewers also liked
Viewers also liked (7)
Similar to Cincinnati JLL Office Employment Update June 2015
Similar to Cincinnati JLL Office Employment Update June 2015 (20)
More from JLL_Midwest_Great_Lakes_Research
More from JLL_Midwest_Great_Lakes_Research (20)
Recently uploaded
Recently uploaded (20)
Cincinnati JLL Office Employment Update June 2015
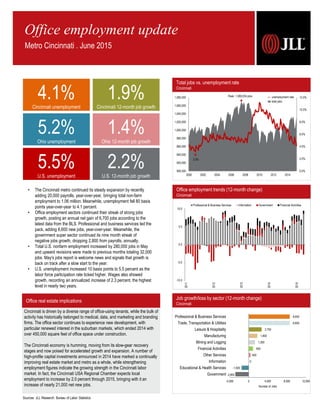
- 1. Office real estate implications Sources: JLL Research, Bureau of Labor Statistics Job growth/loss by sector (12-month change) Cincinnati -2,800 -1,500 0 400 900 1,300 1,800 2,700 8,600 8,600 -4,000 0 4,000 8,000 12,000 Government Educational & Health Services Information Other Services Financial Activities Mining and Logging Manufacturing Leisure & Hospitality Trade, Transportation & Utilities Professional & Business Services Number of Jobs Cincinnati is driven by a diverse range of office-using tenants, while the bulk of activity has historically belonged to medical, data, and marketing and branding firms. The office sector continues to experience new development, with particular renewed interest in the suburban markets, which ended 2014 with over 450,000 square feet of office space under construction. The Cincinnati economy is humming, moving from its slow-gear recovery stages and now poised for accelerated growth and expansion. A number of high-profile capital investments announced in 2014 have marked a continually improving real estate market and metro as a whole, while strengthening employment figures indicate the growing strength in the Cincinnati labor market. In fact, the Cincinnati USA Regional Chamber expects local employment to increase by 2.0 percent through 2015, bringing with it an increase of nearly 21,000 net new jobs. Office employment trends (12-month change) Cincinnati Office employment update Metro Cincinnati . June 2015 • The Cincinnati metro continued its steady expansion by recently adding 20,000 payrolls, year-over-year, bringing total non-farm employment to 1.06 million. Meanwhile, unemployment fell 80 basis points year-over-year to 4.1 percent. • Office employment sectors continued their streak of strong jobs growth, posting an annual net gain of 6,700 jobs according to the latest data from the BLS. Professional and business services led the pack, adding 8,600 new jobs, year-over-year. Meanwhile, the government super sector continued its nine month streak of negative jobs growth, dropping 2,800 from payrolls, annually. • Total U.S. nonfarm employment increased by 280,000 jobs in May and upward revisions were made to previous months totaling 32,000 jobs. May's jobs report is welcome news and signals that growth is back on track after a slow start to the year. • U.S. unemployment increased 10 basis points to 5.5 percent as the labor force participation rate ticked higher. Wages also showed growth, recording an annualized increase of 2.3 percent, the highest level in nearly two years. -10.0 -5.0 0.0 5.0 10.0 2011 2012 2013 2014 2015 Professional & Business Services Information Government Financial Activities 5.5%U.S. unemployment 2.2%U.S. 12-month job growth 4.1%Cincinnati unemployment 1.9%Cincinnati 12-month job growth 5.2%Ohio unemployment 1.4%Ohio 12-month job growth Total jobs vs. unemployment rate Cincinnati 0.0% 2.0% 4.0% 6.0% 8.0% 10.0% 12.0% 900,000 920,000 940,000 960,000 980,000 1,000,000 1,020,000 1,040,000 1,060,000 1,080,000 2000 2002 2004 2006 2008 2010 2012 2014 Peak: 1,069,054 jobs 3.2% unemployment rate total jobs
- 2. JLL Americas Research • Cincinnati Office Employment Update 2 April 2013 April 2014 April 2015 Total Non-farm Employment 1,026,300 1.8% 1,042,600 1.6% 1,062,600 1.9% Unemployment Rate 6.7% 4.9% 4.1% Cincinnati Supersectors April 2013 April 2014 April 2015 Mining, Logging & Construction 37,300 -1.6% 40,200 7.8% 41,500 3.2% Manufacturing 105,000 0.3% 109,100 3.9% 110,900 1.6% Trade, Transportation, & Utilities 199,400 0.9% 201,400 1.0% 210,000 4.3% Information 14,100 2.9% 13,600 -3.5% 13,600 0.0% Financial Activities 65,200 2.5% 66,100 1.4% 67,000 1.4% Professional & Business Services 162,600 1.6% 166,200 2.2% 174,800 5.2% Educational & Health Services 156,300 2.5% 159,400 2.0% 157,900 -0.9% Leisure & Hospitality 111,300 4.9% 113,800 2.2% 116,500 2.4% Other Services 39,900 3.6% 39,100 -2.0% 39,500 1.0% Government 135,200 1.2% 133,700 -1.1% 130,900 -2.1% News on the street Cincinnati businesses expanding, contracting, etc. Cassady Schiller & Associates Inc. Ι Accounting Services: Relocating One of Greater Cincinnati’s largest accounting firms is getting ready to move its offices. Cassady Schiller & Associates Inc. has outgrown the building it owns on Lake Forest Drive in Blue Ash and is moving down the street. The company has signed a lease to move this summer to become a major tenant at the Westlake Center at 4555 Lake Forest Drive. It’s vacating about 10,000 square feet and moving into 16,000 square feet on the fourth floor of the seven-story building. GreenSky Trade Credit LLC Ι Credit Reporting Services: Expanding GreenSky Trade Credit LLC, a consumer finance company specializing in home improvement and retail credit, is looking at moving and nearly tripling the size of its Covington call center operation. Atlanta-based GreenSky proposed to invest nearly $6.9 million in the project. It is considering a move from its office in Covington to a location in Crestview Hills, a move that would “enable the growth of its business.” GreenSky works with its bank partners across all 50 states. Procter & Gamble Ι Personal Care Products Manufacturing: Contracting Procter & Gamble’s (NYSE: PG) three-year effort to trim its office workforce by about 10,000 employees is a year ahead of schedule, and up to 6,000 additional non- manufacturing jobs could be eliminated over the next two years through buyouts, retirements and not filling vacant positions. P&G has about 11,000 employees in Greater Cincinnati and another 107,000 elsewhere. In addition, roughly 10,000 manufacturing jobs have been eliminated globally over the last three years. Staffmark Ι Staffing Services: Relocating Staffmark, the national commercial staffing firm based in downtown Cincinnati, is moving its corporate headquarters after more than 20 years on Elm Street. Staffmark signed an eight-year lease for more than 37,000 square feet of space at Omnicare Center. The company, which has 200 employees in its downtown office, is expected to move before the end of the year. The firm will take all of the eighth floor and a portion of the seventh floor in the building. Time Warner Cable Ι Commercial Real Estate: Acquisition Time Warner Cable (NYSE: TWC) is adding 40 new jobs in Greater Cincinnati in advance of its planned, $56.7 billion merger with Charter Communications. Time Warner Cable will host a job fair at its 7906 Dixie Highway location to fill more than 40 full-time direct sales and technical support positions. Time Warner Cable is one of the biggest television and Internet providers in Cincinnati, competing against local provider Cincinnati Bell. VonLehman & Co. Inc. Ι Accounting Services: Expanding VonLehman & Co. Inc., another of the largest accounting firms in Greater Cincinnati, is looking at moving its Northern Kentucky office and adding 20 new employees as part of a more than $3 million investment. The firm would spend nearly $2.5 million on rent and another $600,000 on other start-up costs as it considers moving the firm’s Fort Mitchell office to Fort Wright. The firm expects to create 20 new jobs in the next seven years, with an average hourly wage of $43 including benefits. Employment statistics Cincinnati Industry employment stratification Cincinnati Cody Brooks Research Analyst Great Lakes Region tel +1 513 297 2509 Cody.Brooks@am.jll.com 312 Walnut St, Suite 3030 Cincinnati, OH 45202 www.jll.com/cincinnati Andrew Batson Senior Research Analyst Great Lakes Region tel +1 216 937 4374 Andrew.Batson@am.jll.com 127 Public Square, Suite 2410 Cleveland, OH 44114 www.jll.com/cleveland © 2015 Jones Lang LaSalle IP, Inc. All rights reserved. All information contained herein is from sources deemed reliable; however, no representation or warranty is made to the accuracy thereof. Trade, transportation and Utilities, 210,000, 20% Professional and Business Services, 174,800, 17% Educational and Health Services, 157,900, 15% Government, 130,900, 12% Leisure and Hospitality, 116,500, 11% Manufacturing, 110,900, 10% Financial Activities, 67,000, 6% Mining, Logging and construction, 41,500, 4% Other Services, 39,500, 4% Information, 13,600, 1%