Download as PDF, PPTX


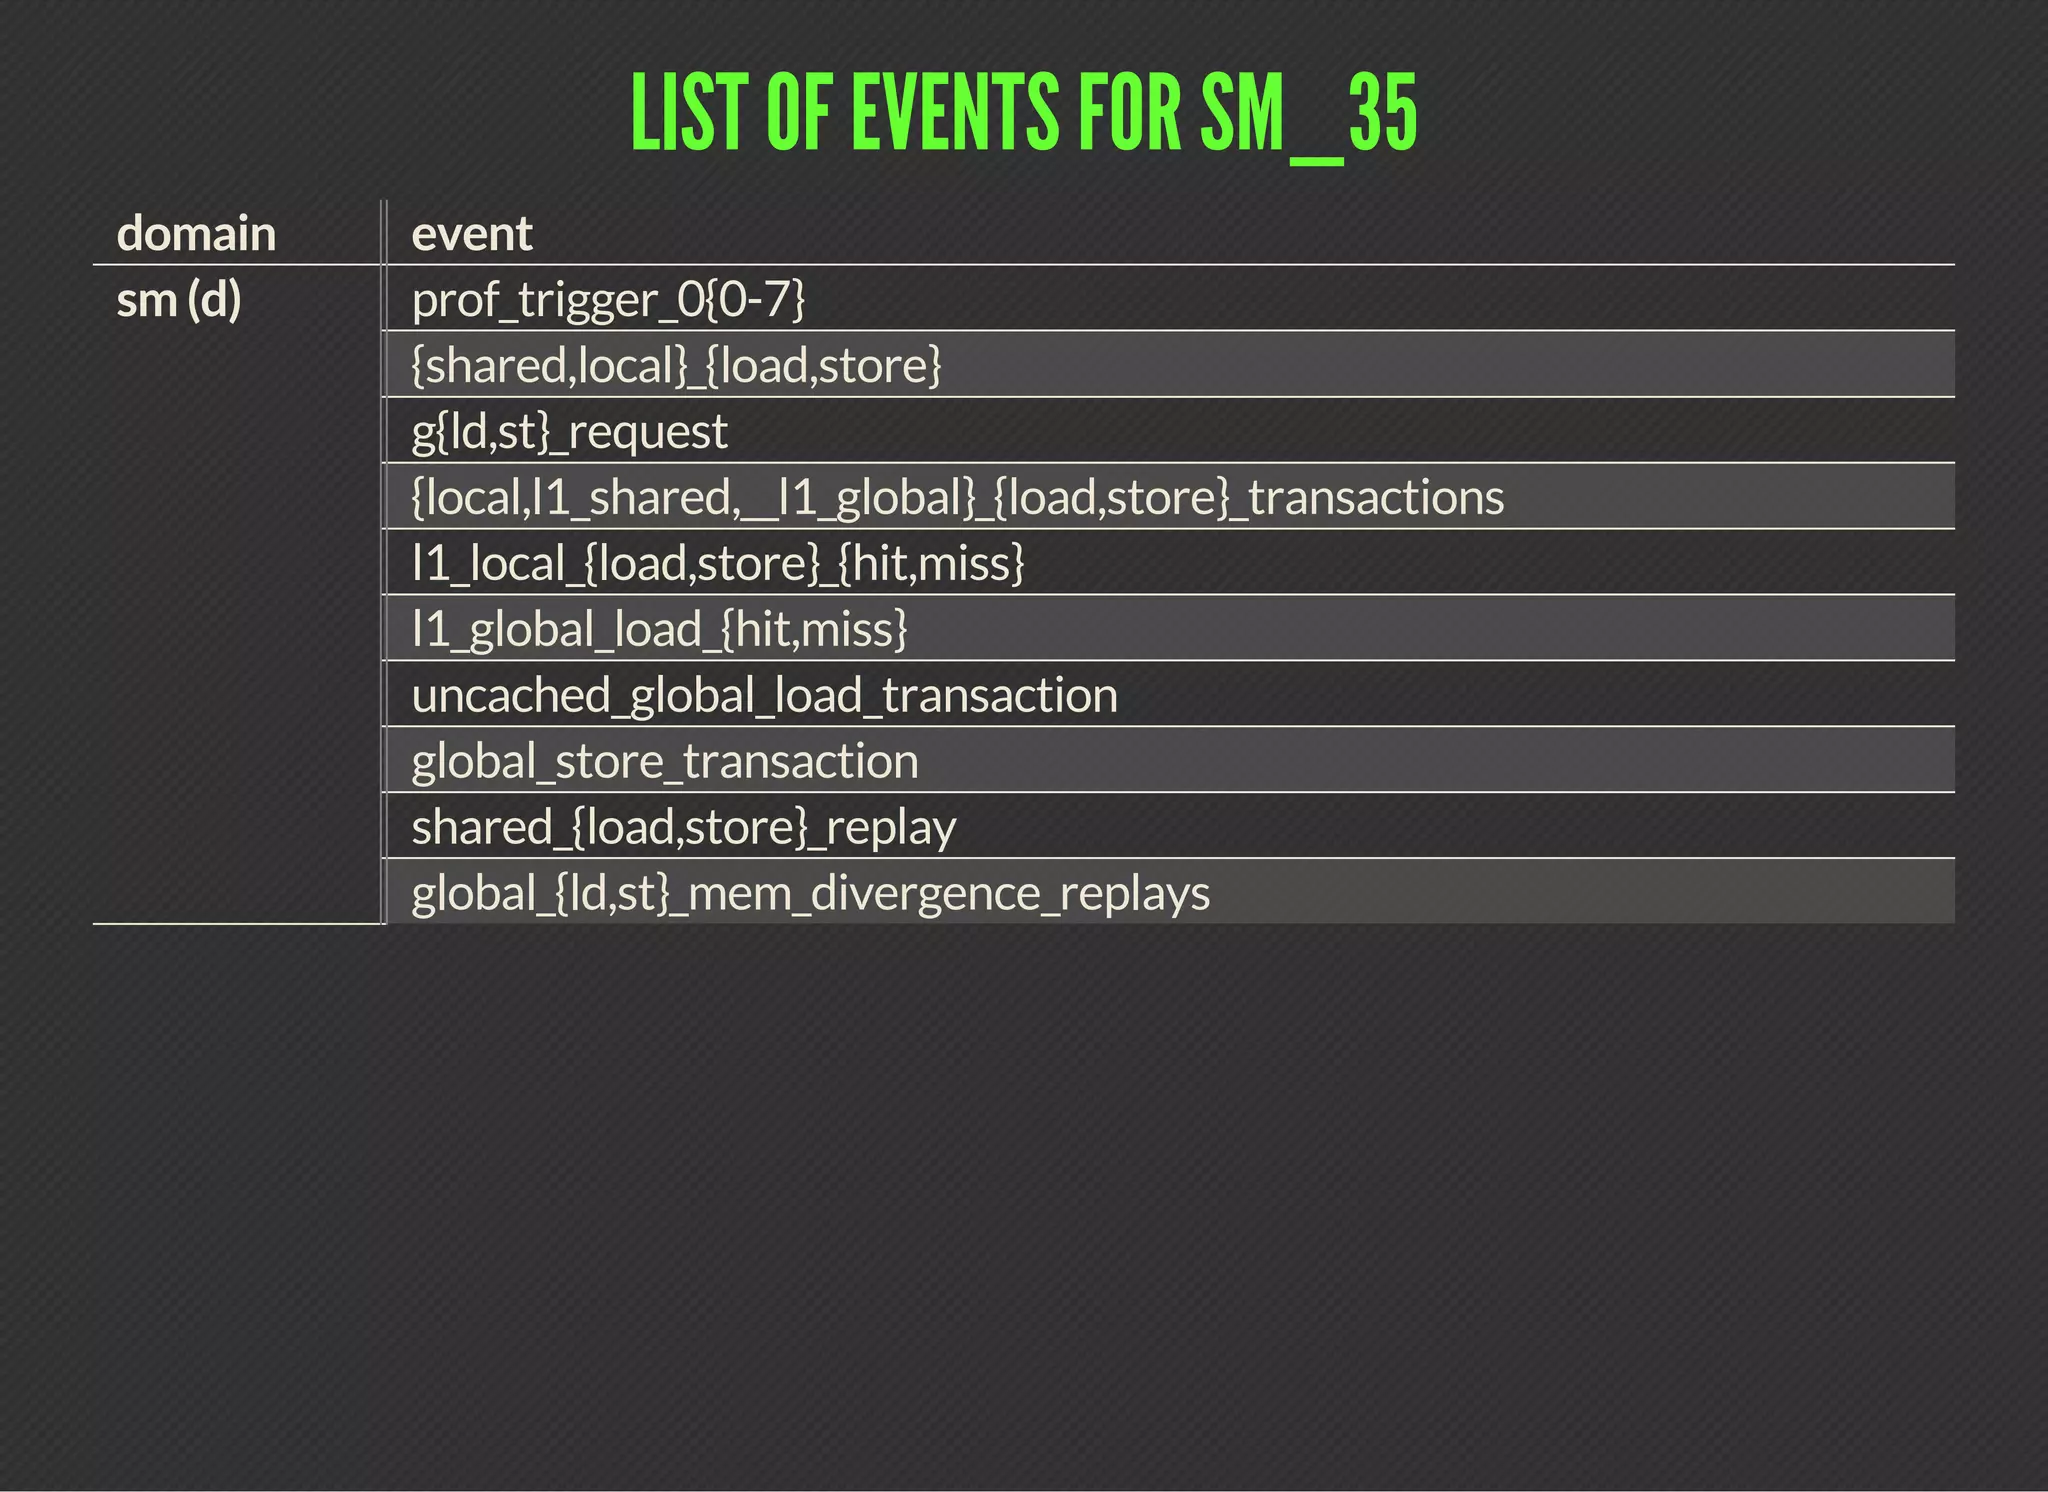
![LIST OF EVENTS FOR SM_35
domain event
sm (d) {threads,warps,sm_cta}_launched
inst_issued{1,2}
[thread_,not_predicated_off_thread_]inst_executed
{atom,gred}_count
active_{cycles,warps}](https://image.slidesharecdn.com/code-gpu-with-cuda-6-150915224404-lva1-app6891/75/Code-GPU-with-CUDA-Identifying-performance-limiters-16-2048.jpg)
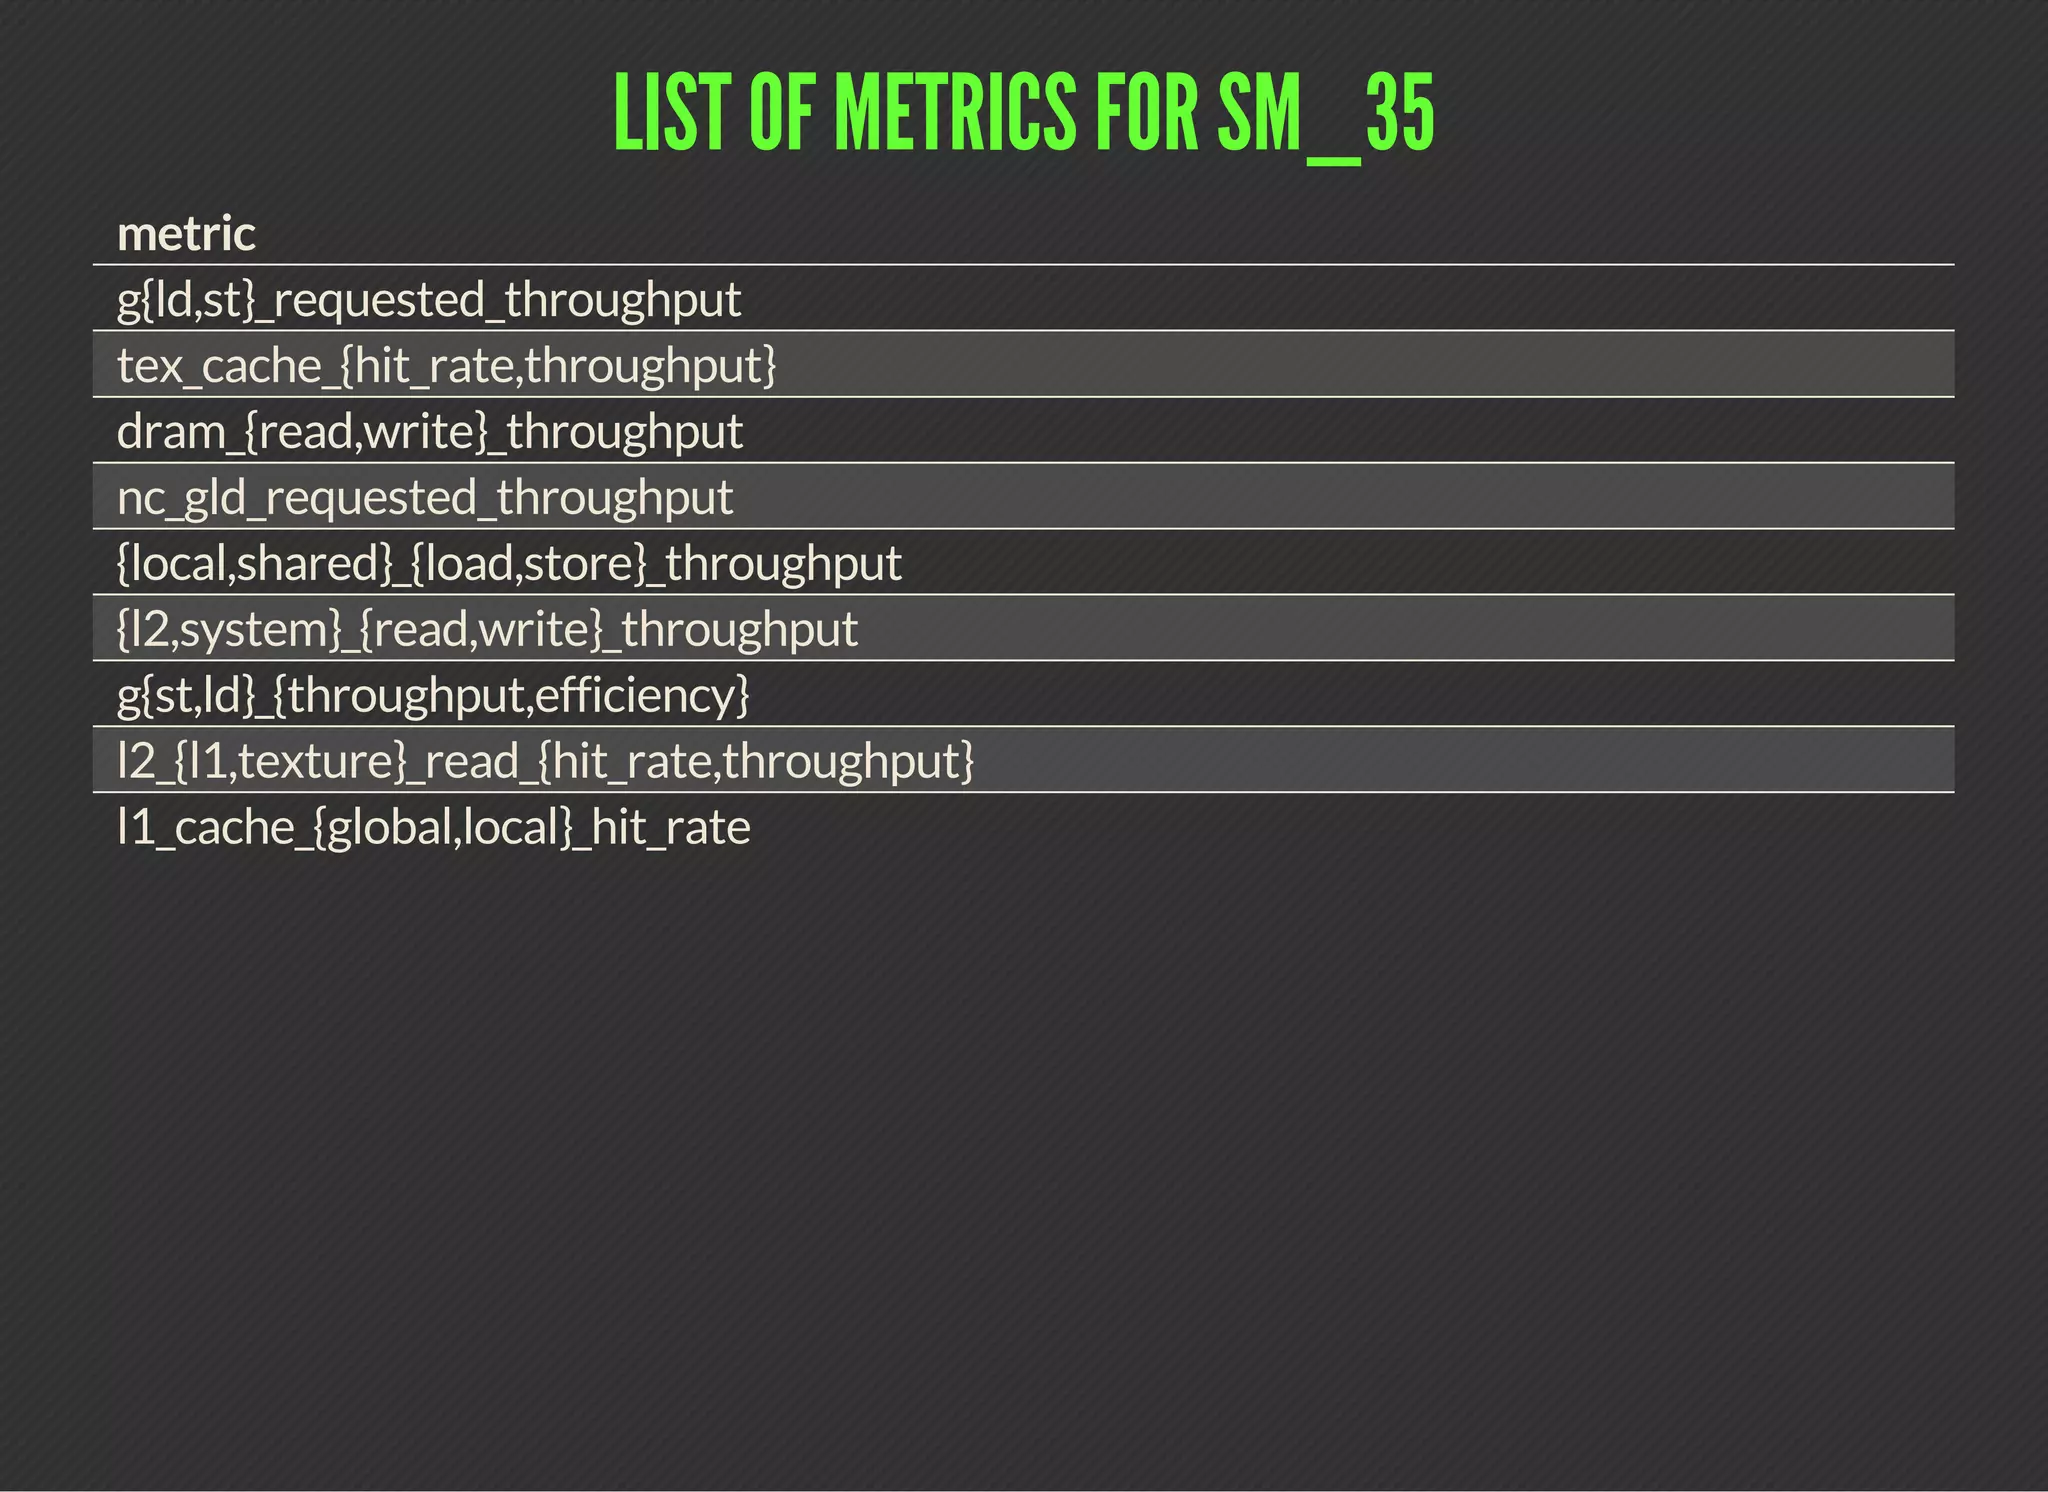
![LIST OF METRICS FOR SM_35
metric
{local,shared}_{load,store}_transactions[_per_request]
gl{d,st}_transactions[_per_request]
{sysmem,dram,l2}_{read,write}_transactions
tex_cache_transactions
{inst,shared,global,global_cache,local}_replay_overhead
local_memory_overhead
shared_efficiency
achieved_occupancy
sm_efficiency[_instance]
ipc[_instance]
issued_ipc
inst_per_warp](https://image.slidesharecdn.com/code-gpu-with-cuda-6-150915224404-lva1-app6891/75/Code-GPU-with-CUDA-Identifying-performance-limiters-18-2048.jpg)
![LIST OF METRICS FOR SM_35
metric
flops_{sp,dp}[_add,mul,fma]
warp_execution_efficiency
warp_nonpred_execution_efficiency
flops_sp_special
stall_{inst_fetch,exec_dependency,data_request,texture,sync,other}
{l1_shared,l2,tex,dram,system}_utilization
{cf,ldst}_{issued,executed}
{ldst,alu,cf,tex}_fu_utilization
issue_slot_utilization
inst_{issued,executed}
issue_slots](https://image.slidesharecdn.com/code-gpu-with-cuda-6-150915224404-lva1-app6891/75/Code-GPU-with-CUDA-Identifying-performance-limiters-19-2048.jpg)
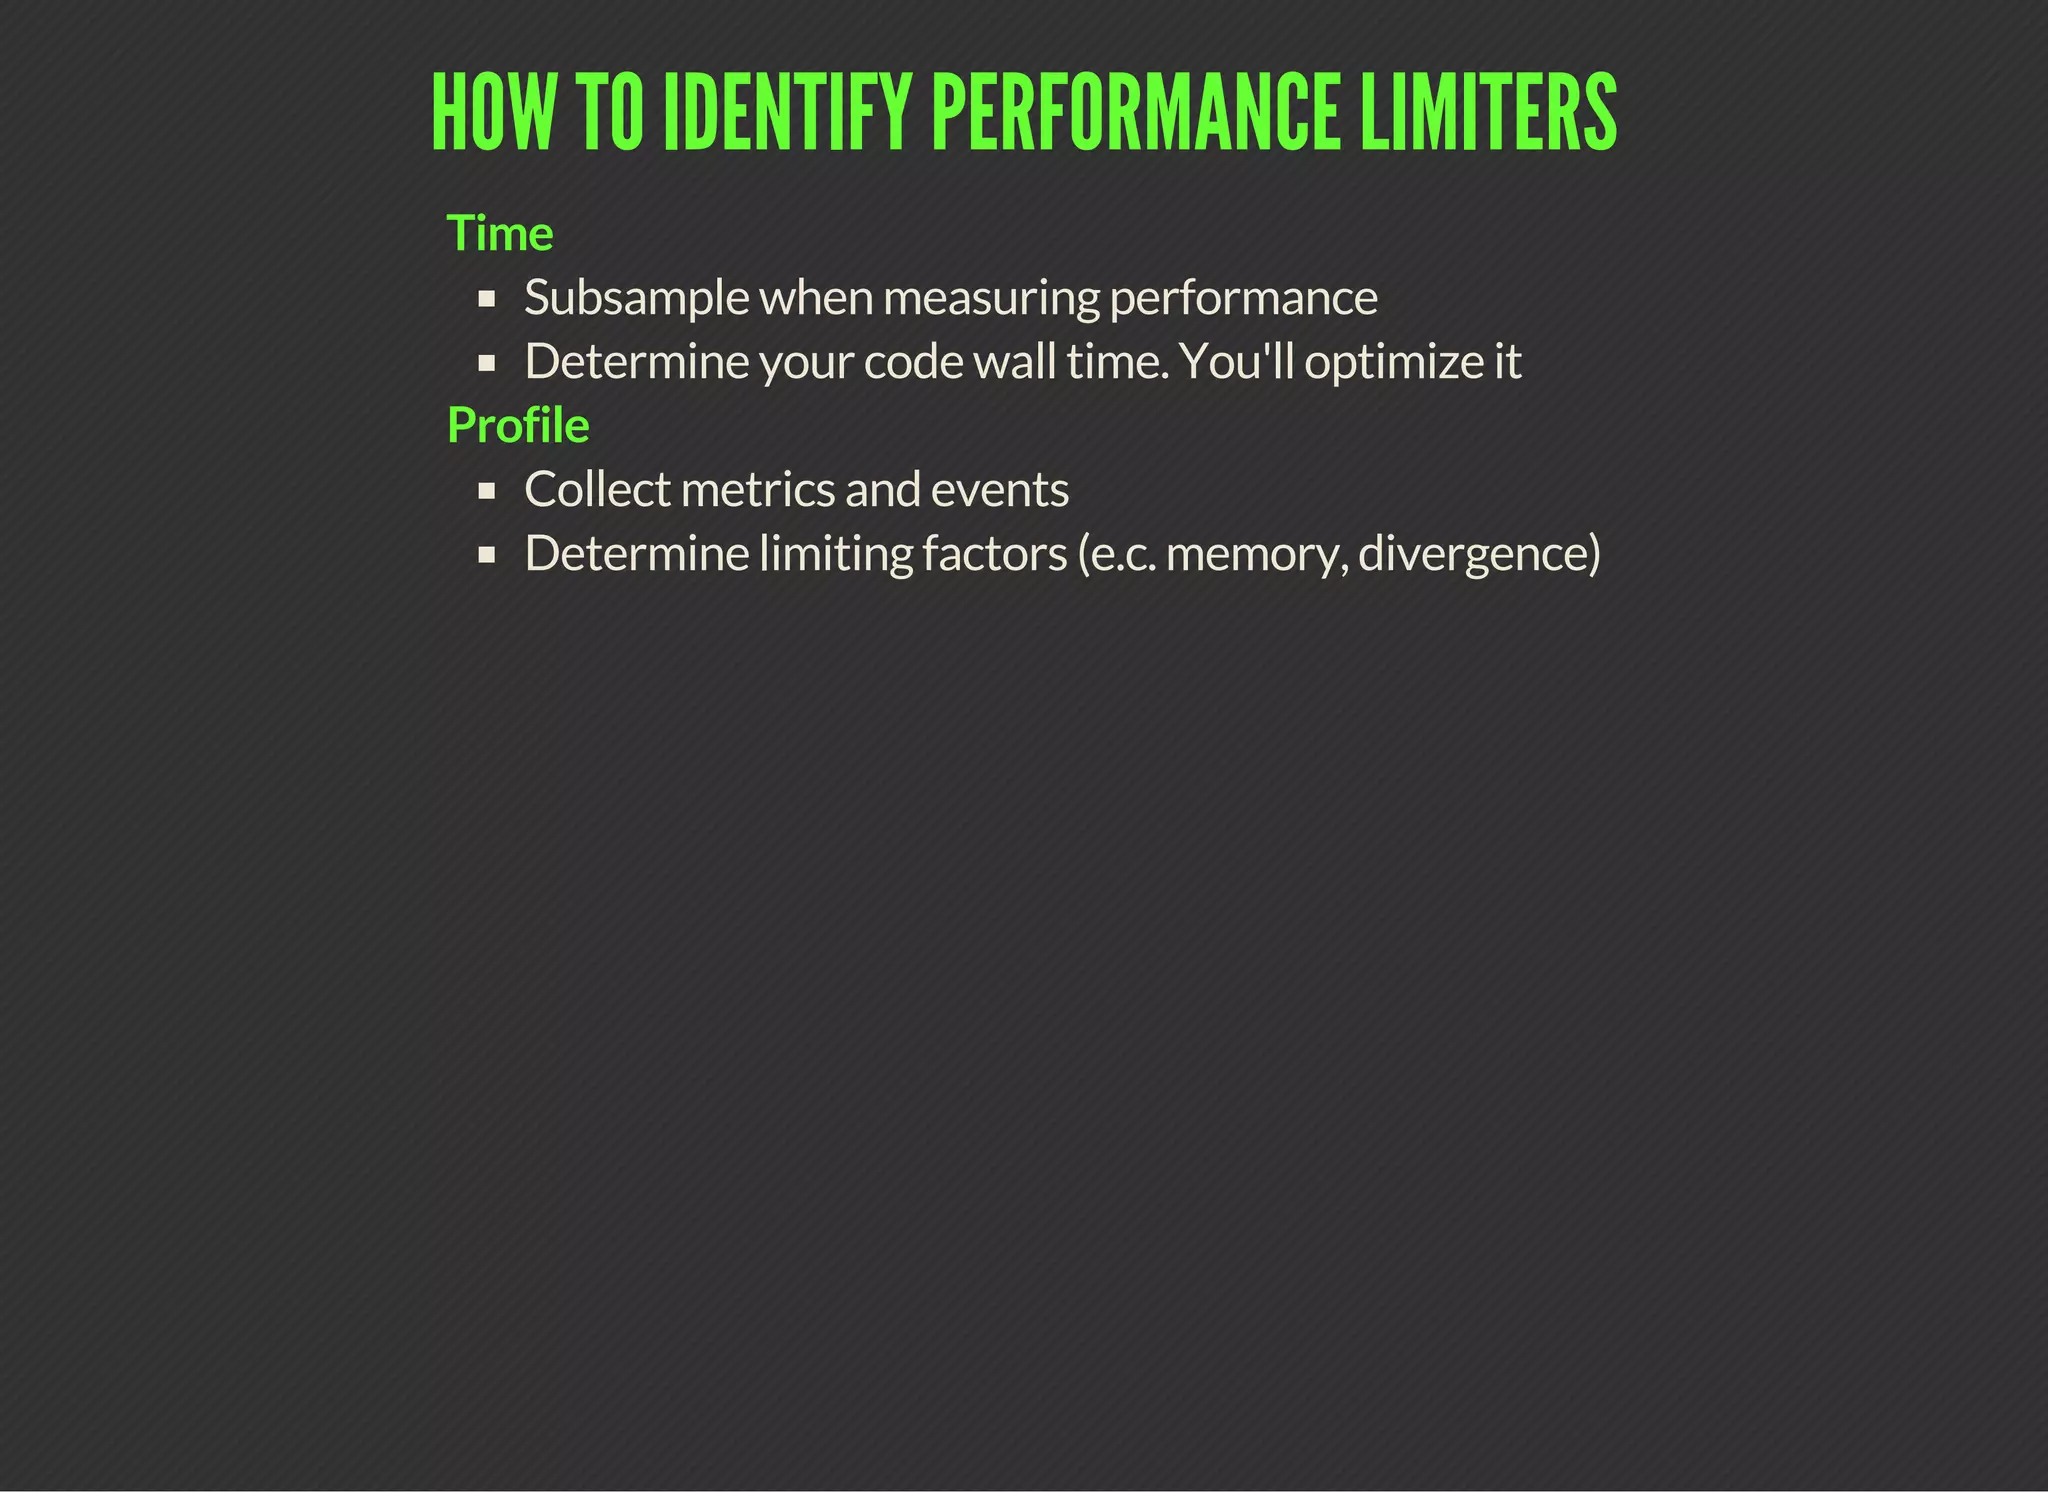
![CODE PATHS ANALYSIS
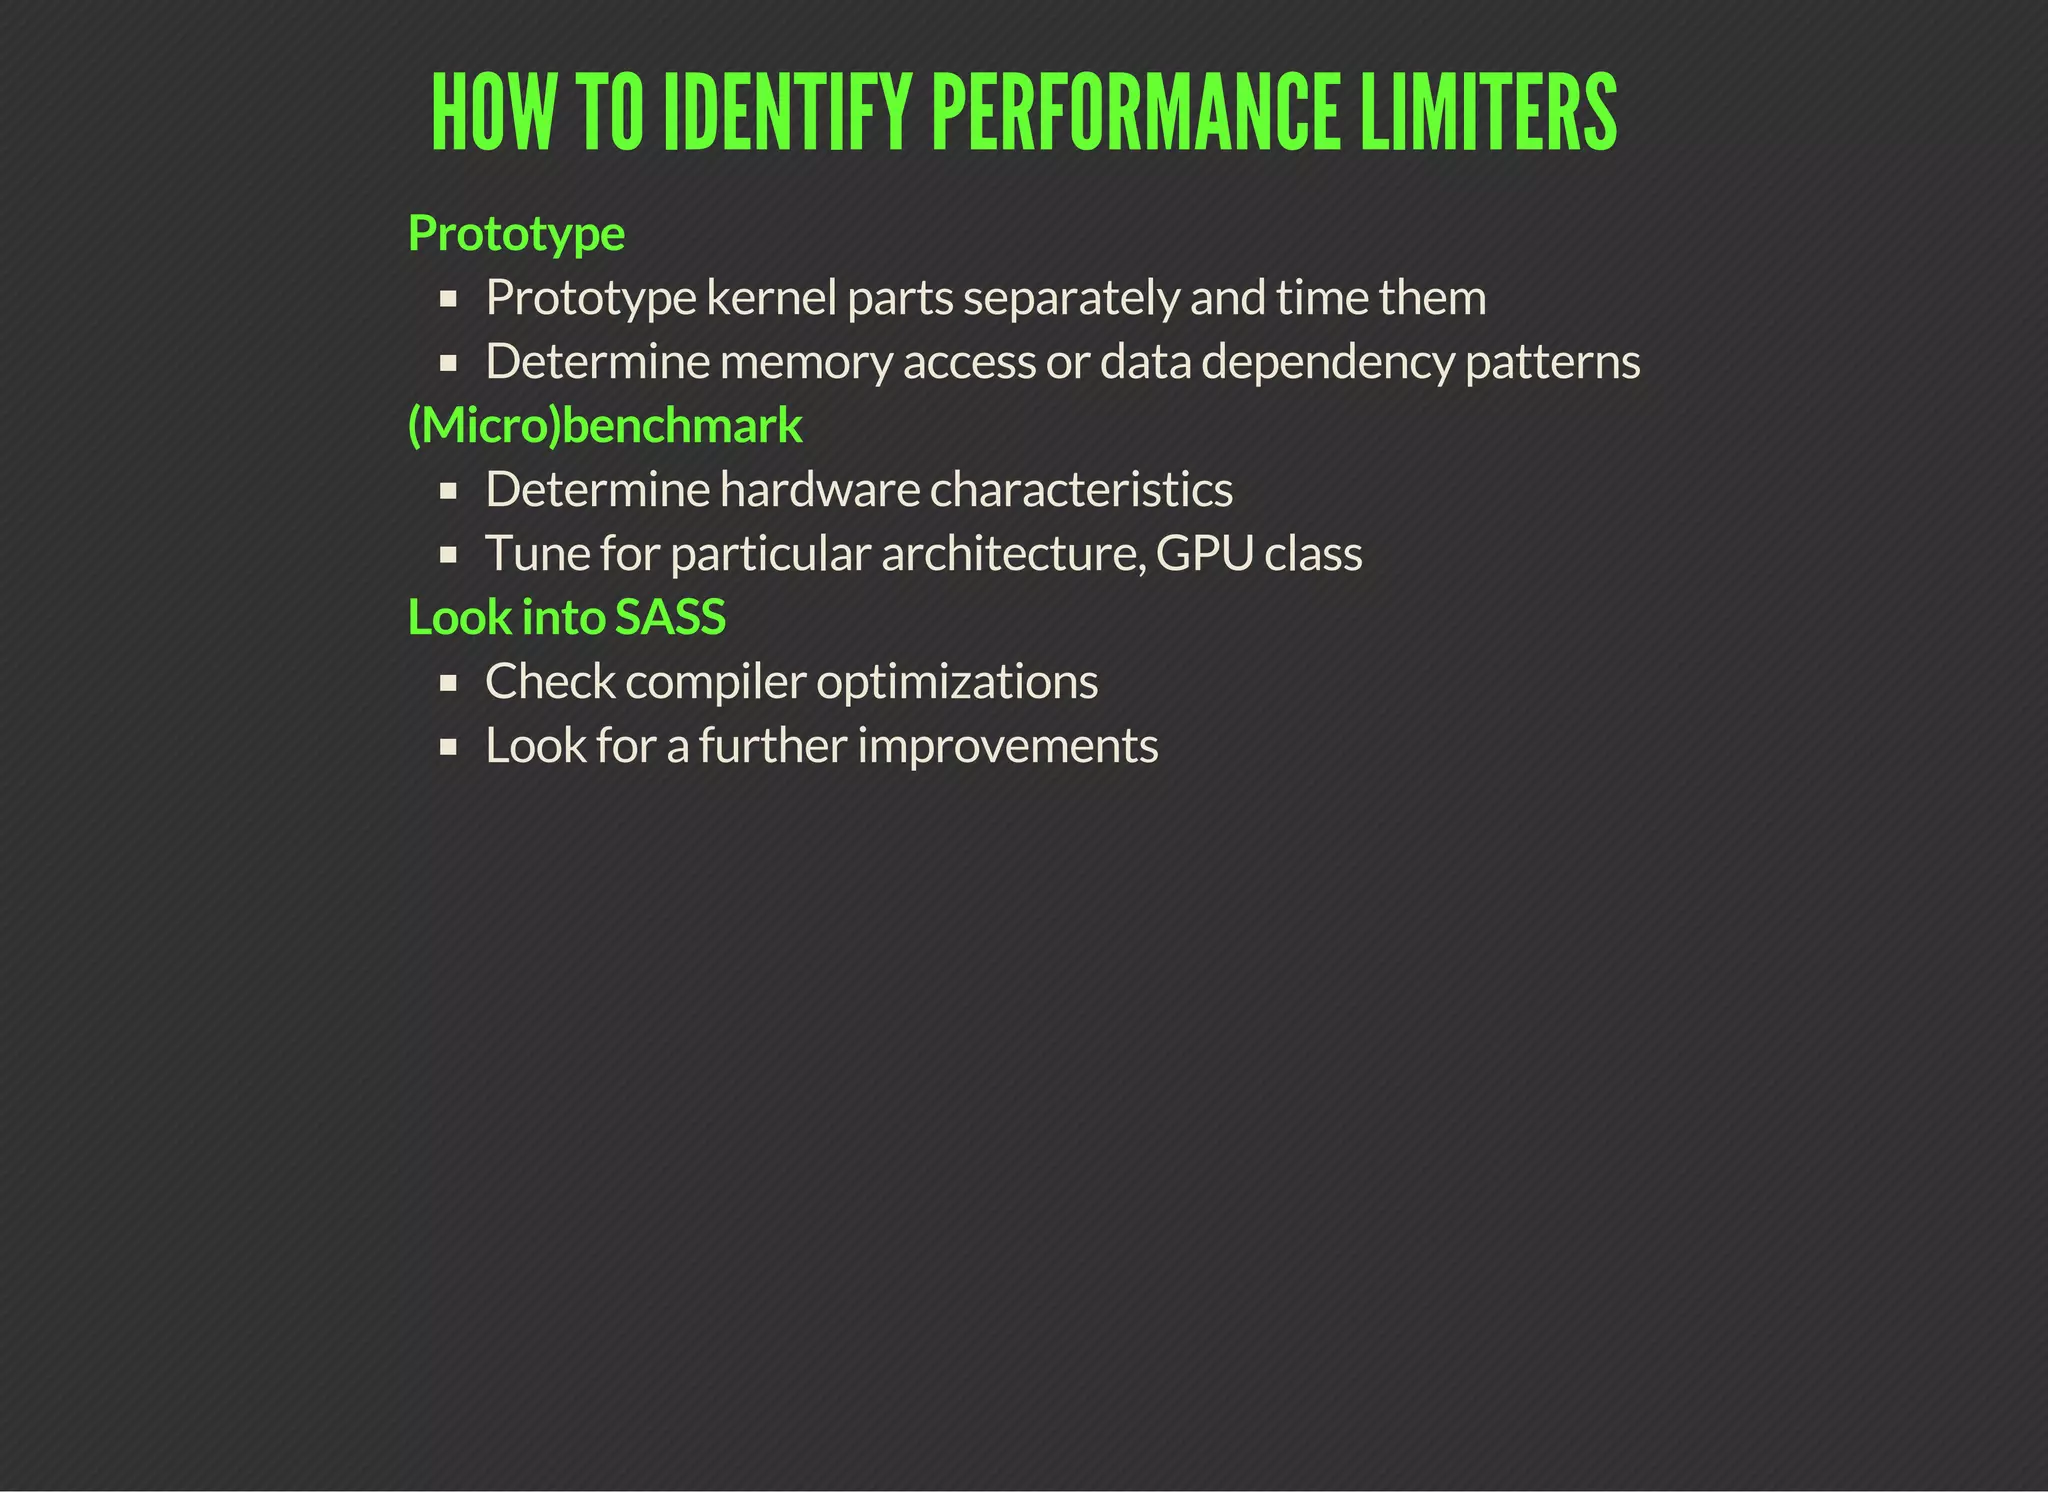
The main idea: determine performance limiters through measuring different parts
independently
Simple case: time memory-only and math-only versions of the kernel
Shows how well memory operations are overlapped with arithmetic: compare the sum
of mem-only and math-only times to full-kernel time
t e m p l a t e < t y p e n a m e T >
_ _ g l o b a l _ _ v o i d
b e n c h m a r k _ c o n t i g u o u s _ d i r e c t _ l o a d ( T * s , t y p e n a m e T : : v a l u e _ t y p e * r , b o o l d o S t o r e )
{
i n t g l o b a l _ i n d e x = t h r e a d I d x . x + b l o c k D i m . x * b l o c k I d x . x ;
T d a t a = s [ g l o b a l _ i n d e x ] ;
a s m ( " " : : : " m e m o r y " ) ;
i f ( s & & d o S t o r e )
r [ g l o b a l _ i n d e x ] = s u m ( d a t a ) ;
}](https://image.slidesharecdn.com/code-gpu-with-cuda-6-150915224404-lva1-app6891/75/Code-GPU-with-CUDA-Identifying-performance-limiters-24-2048.jpg)
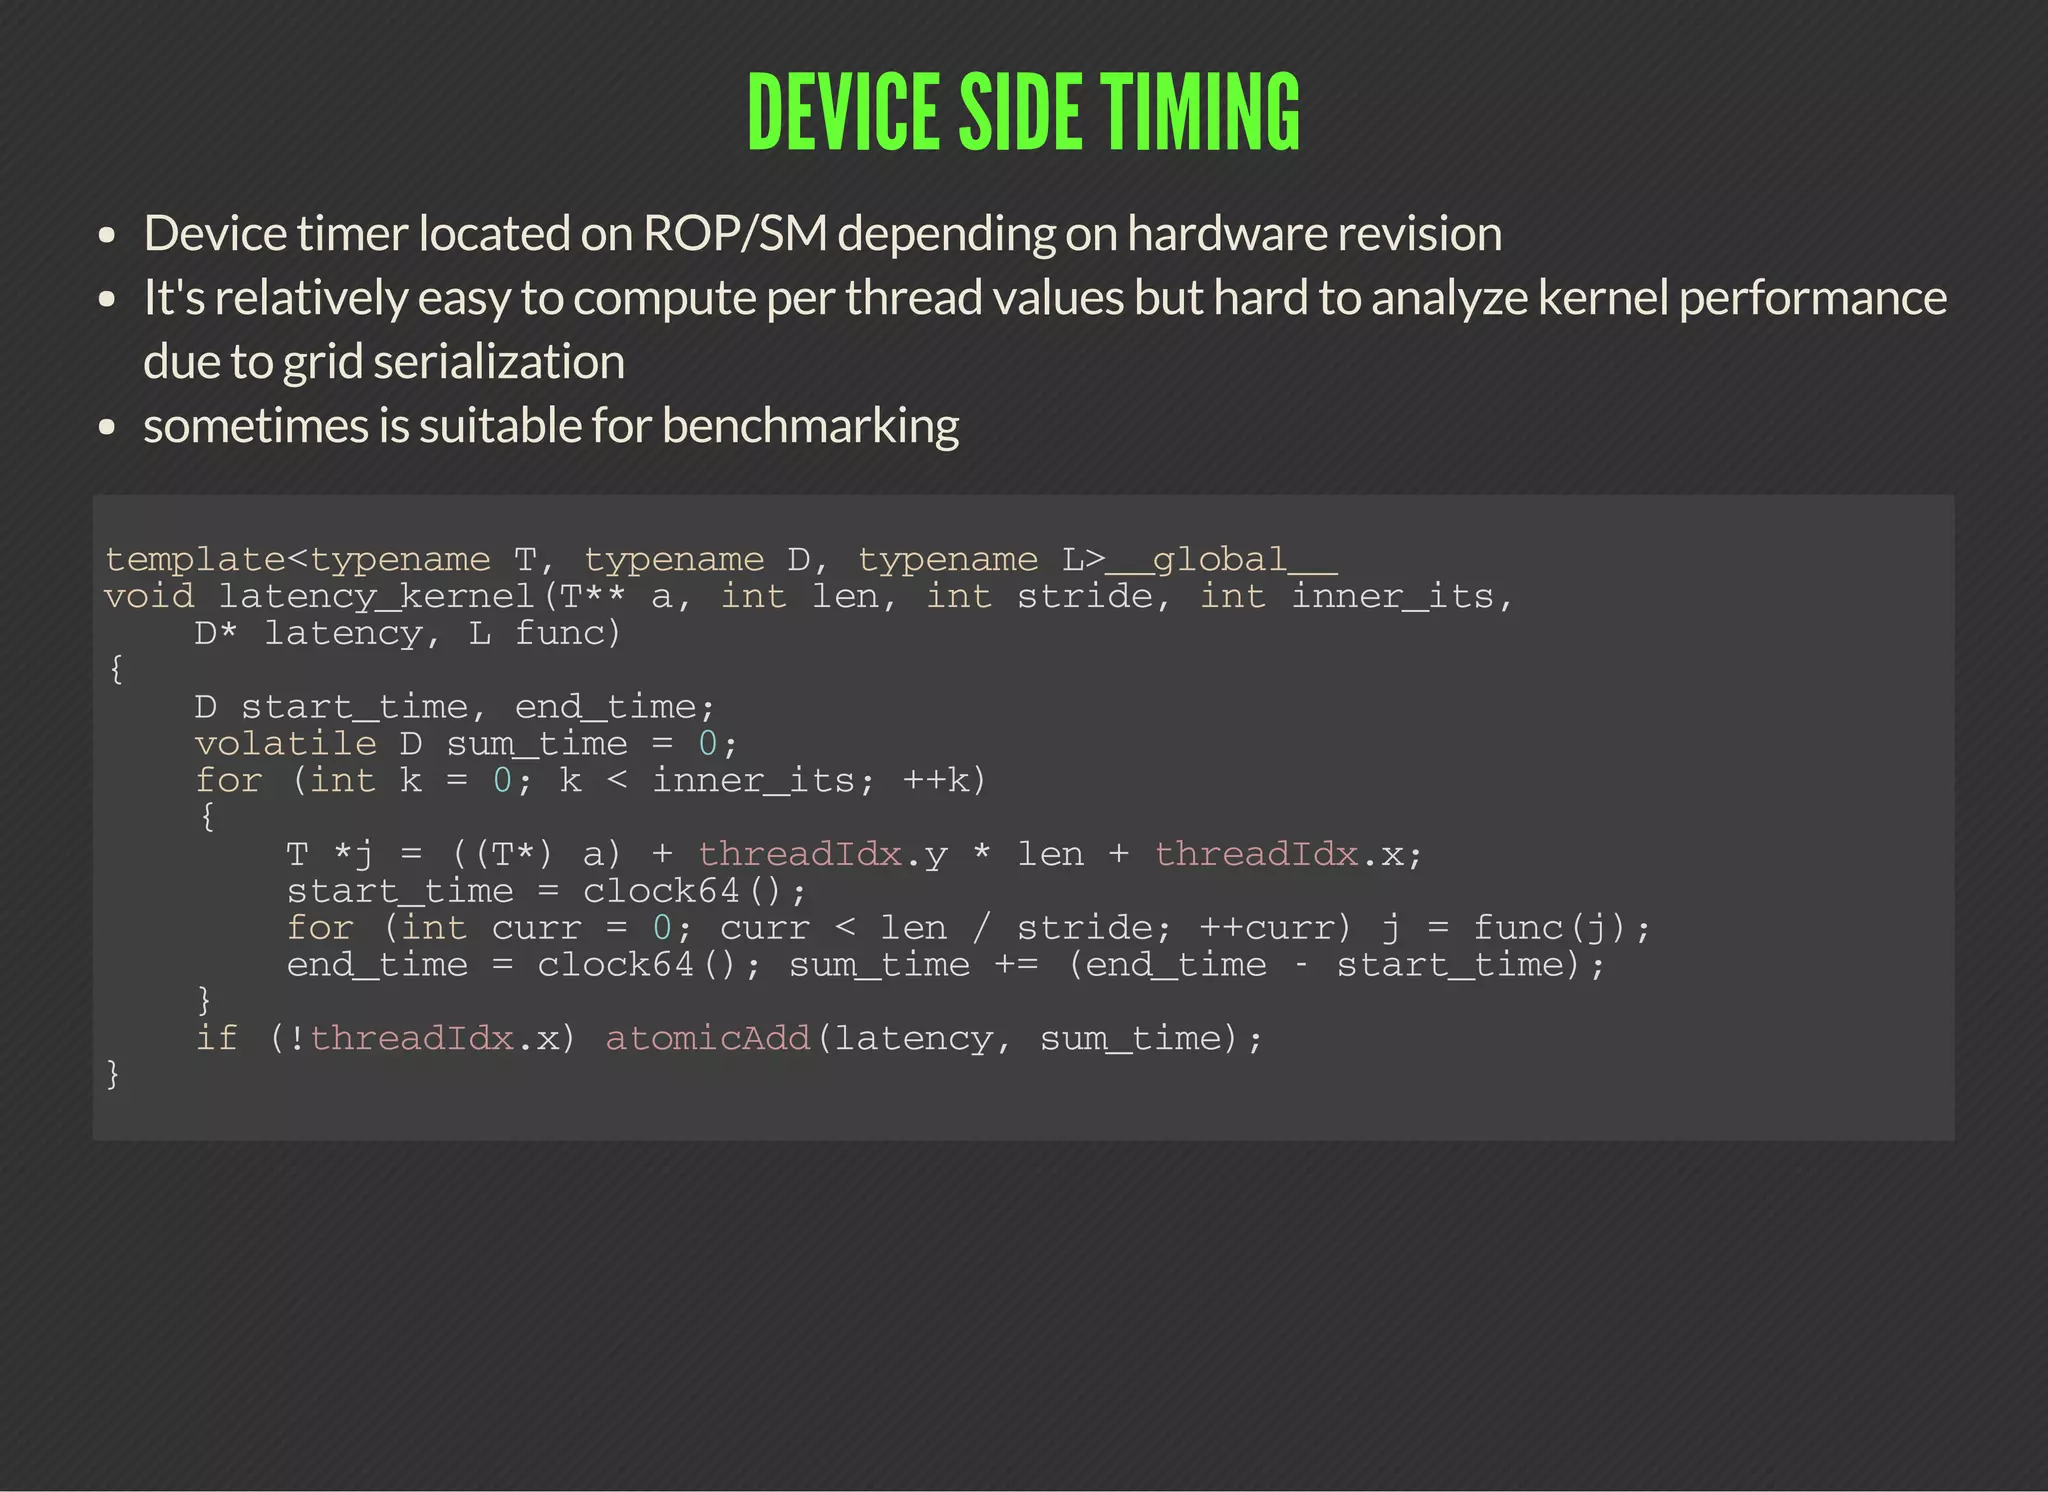

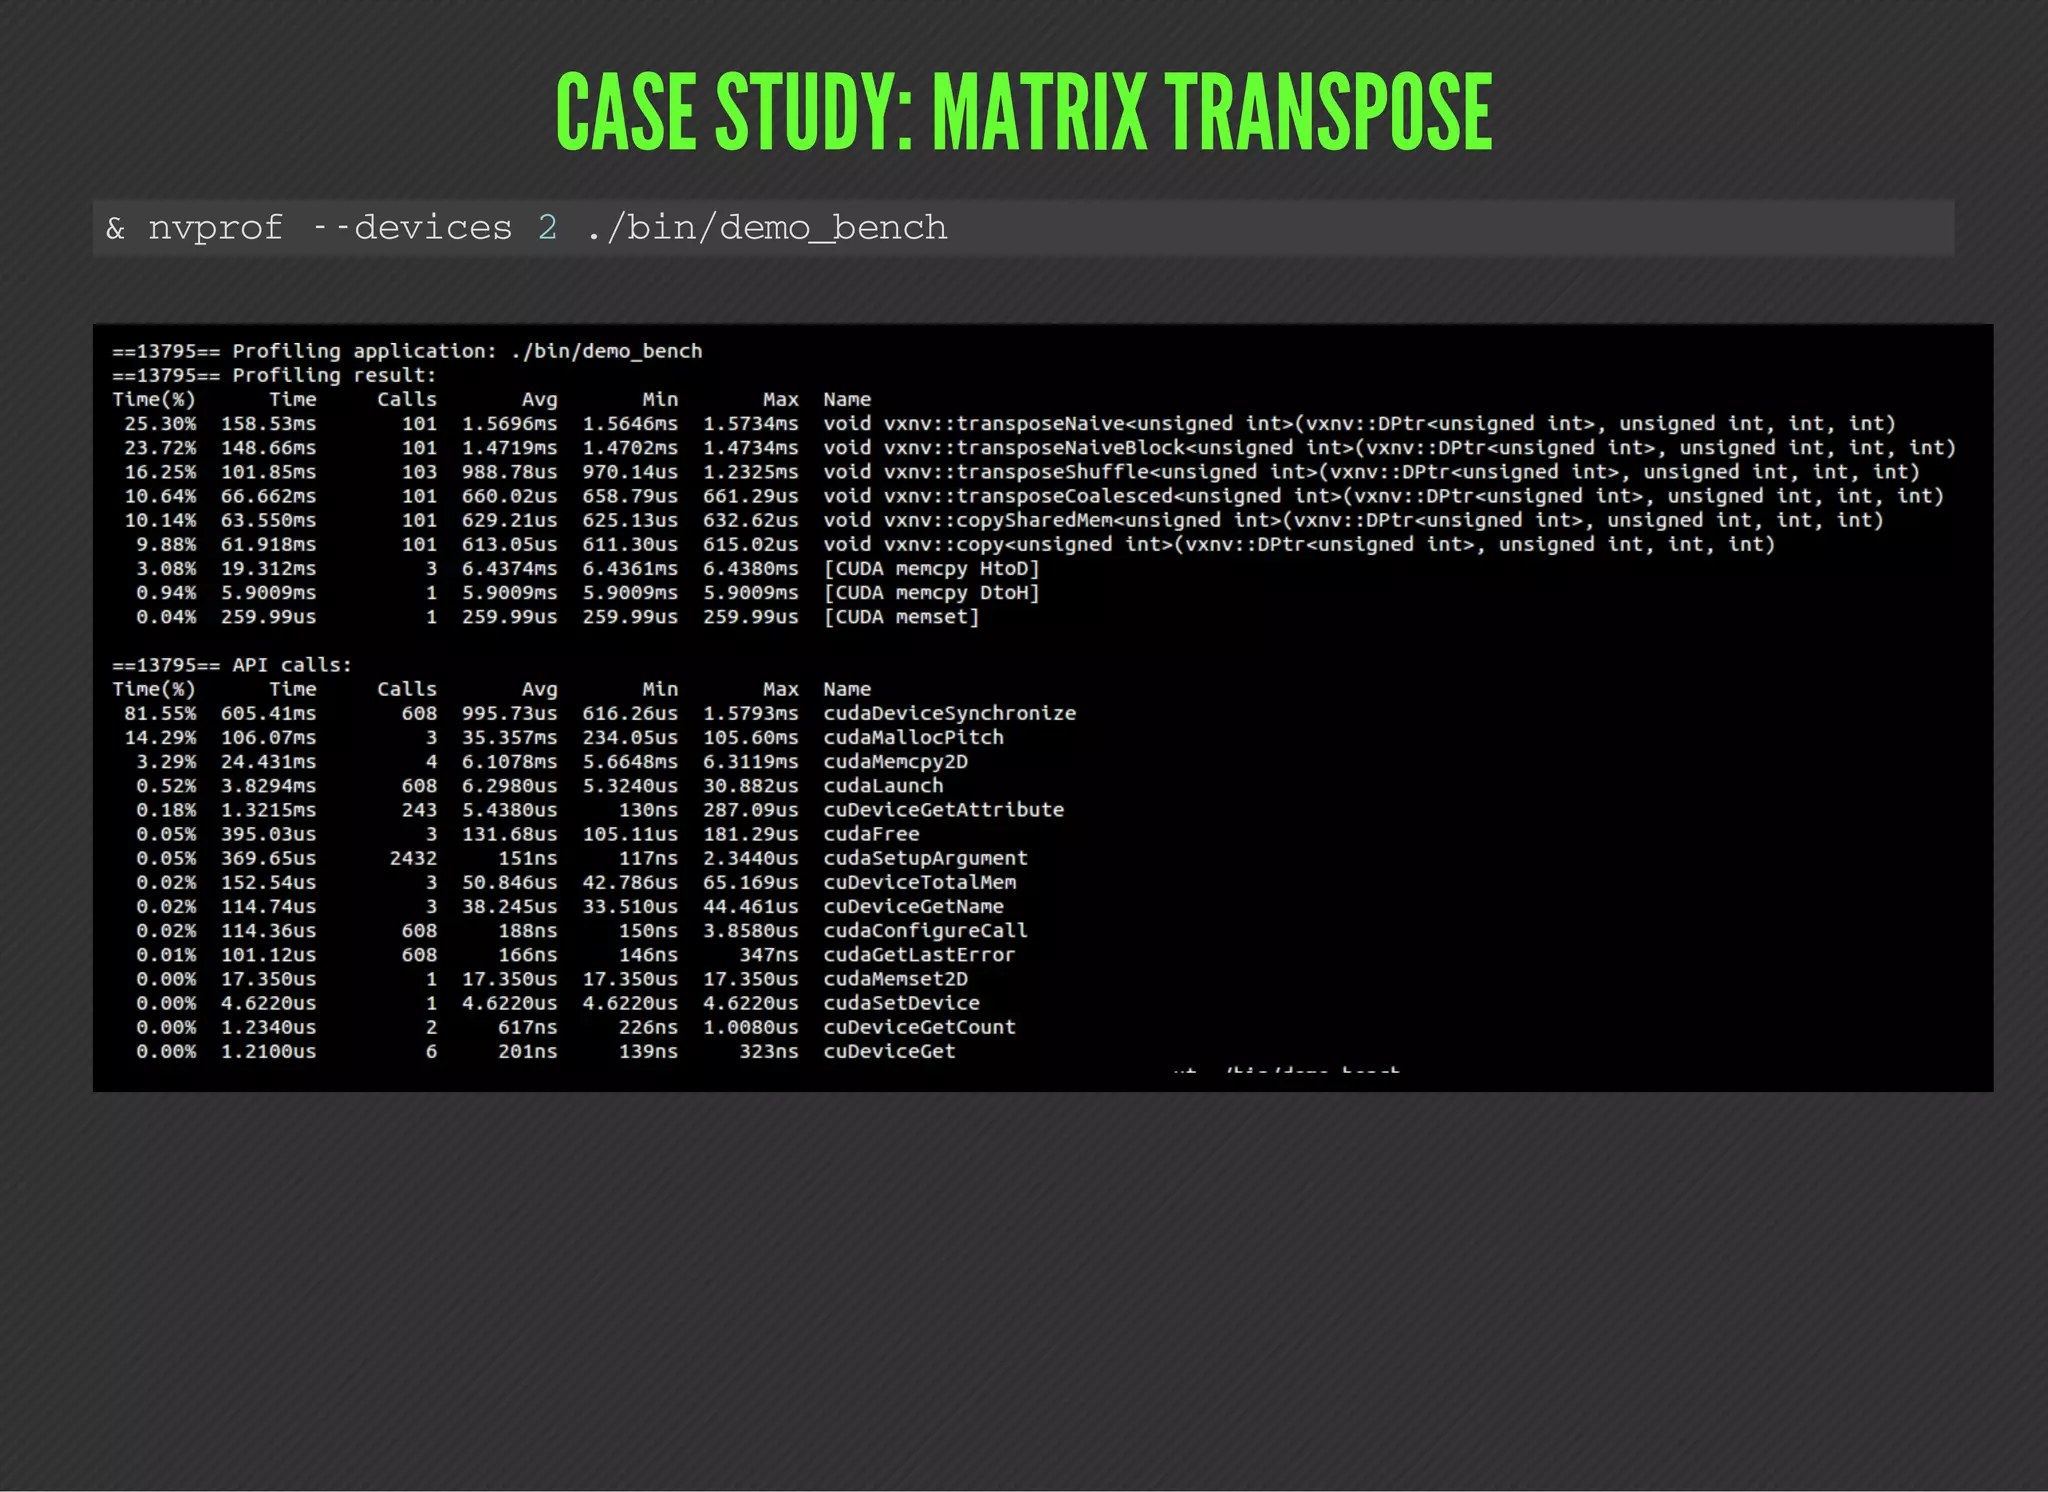
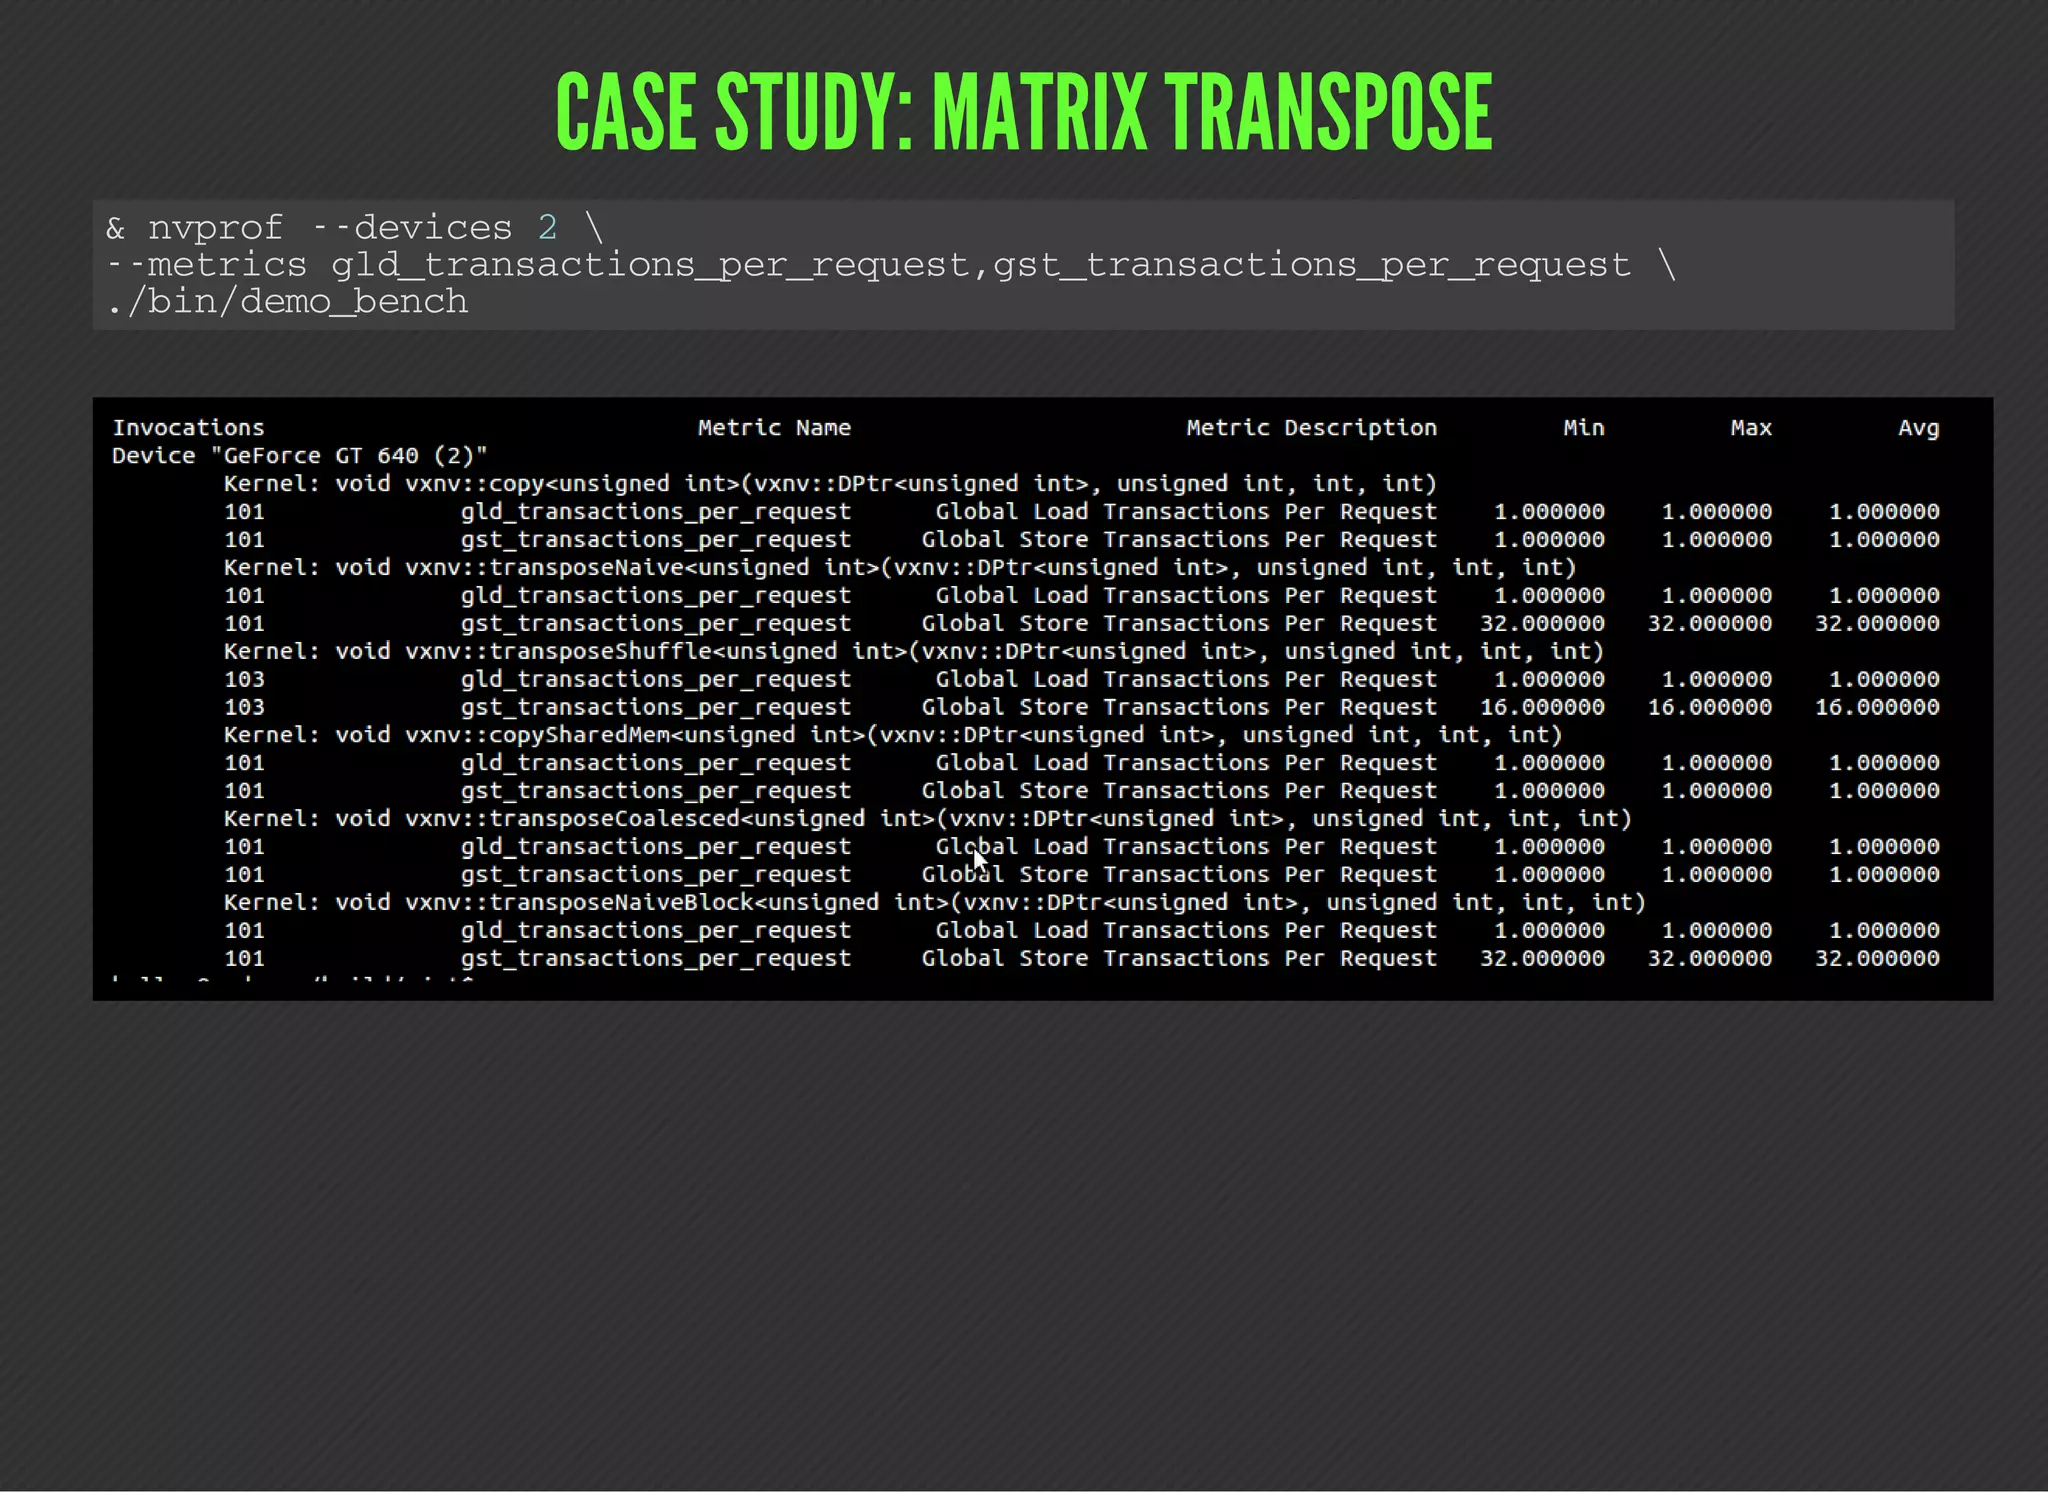
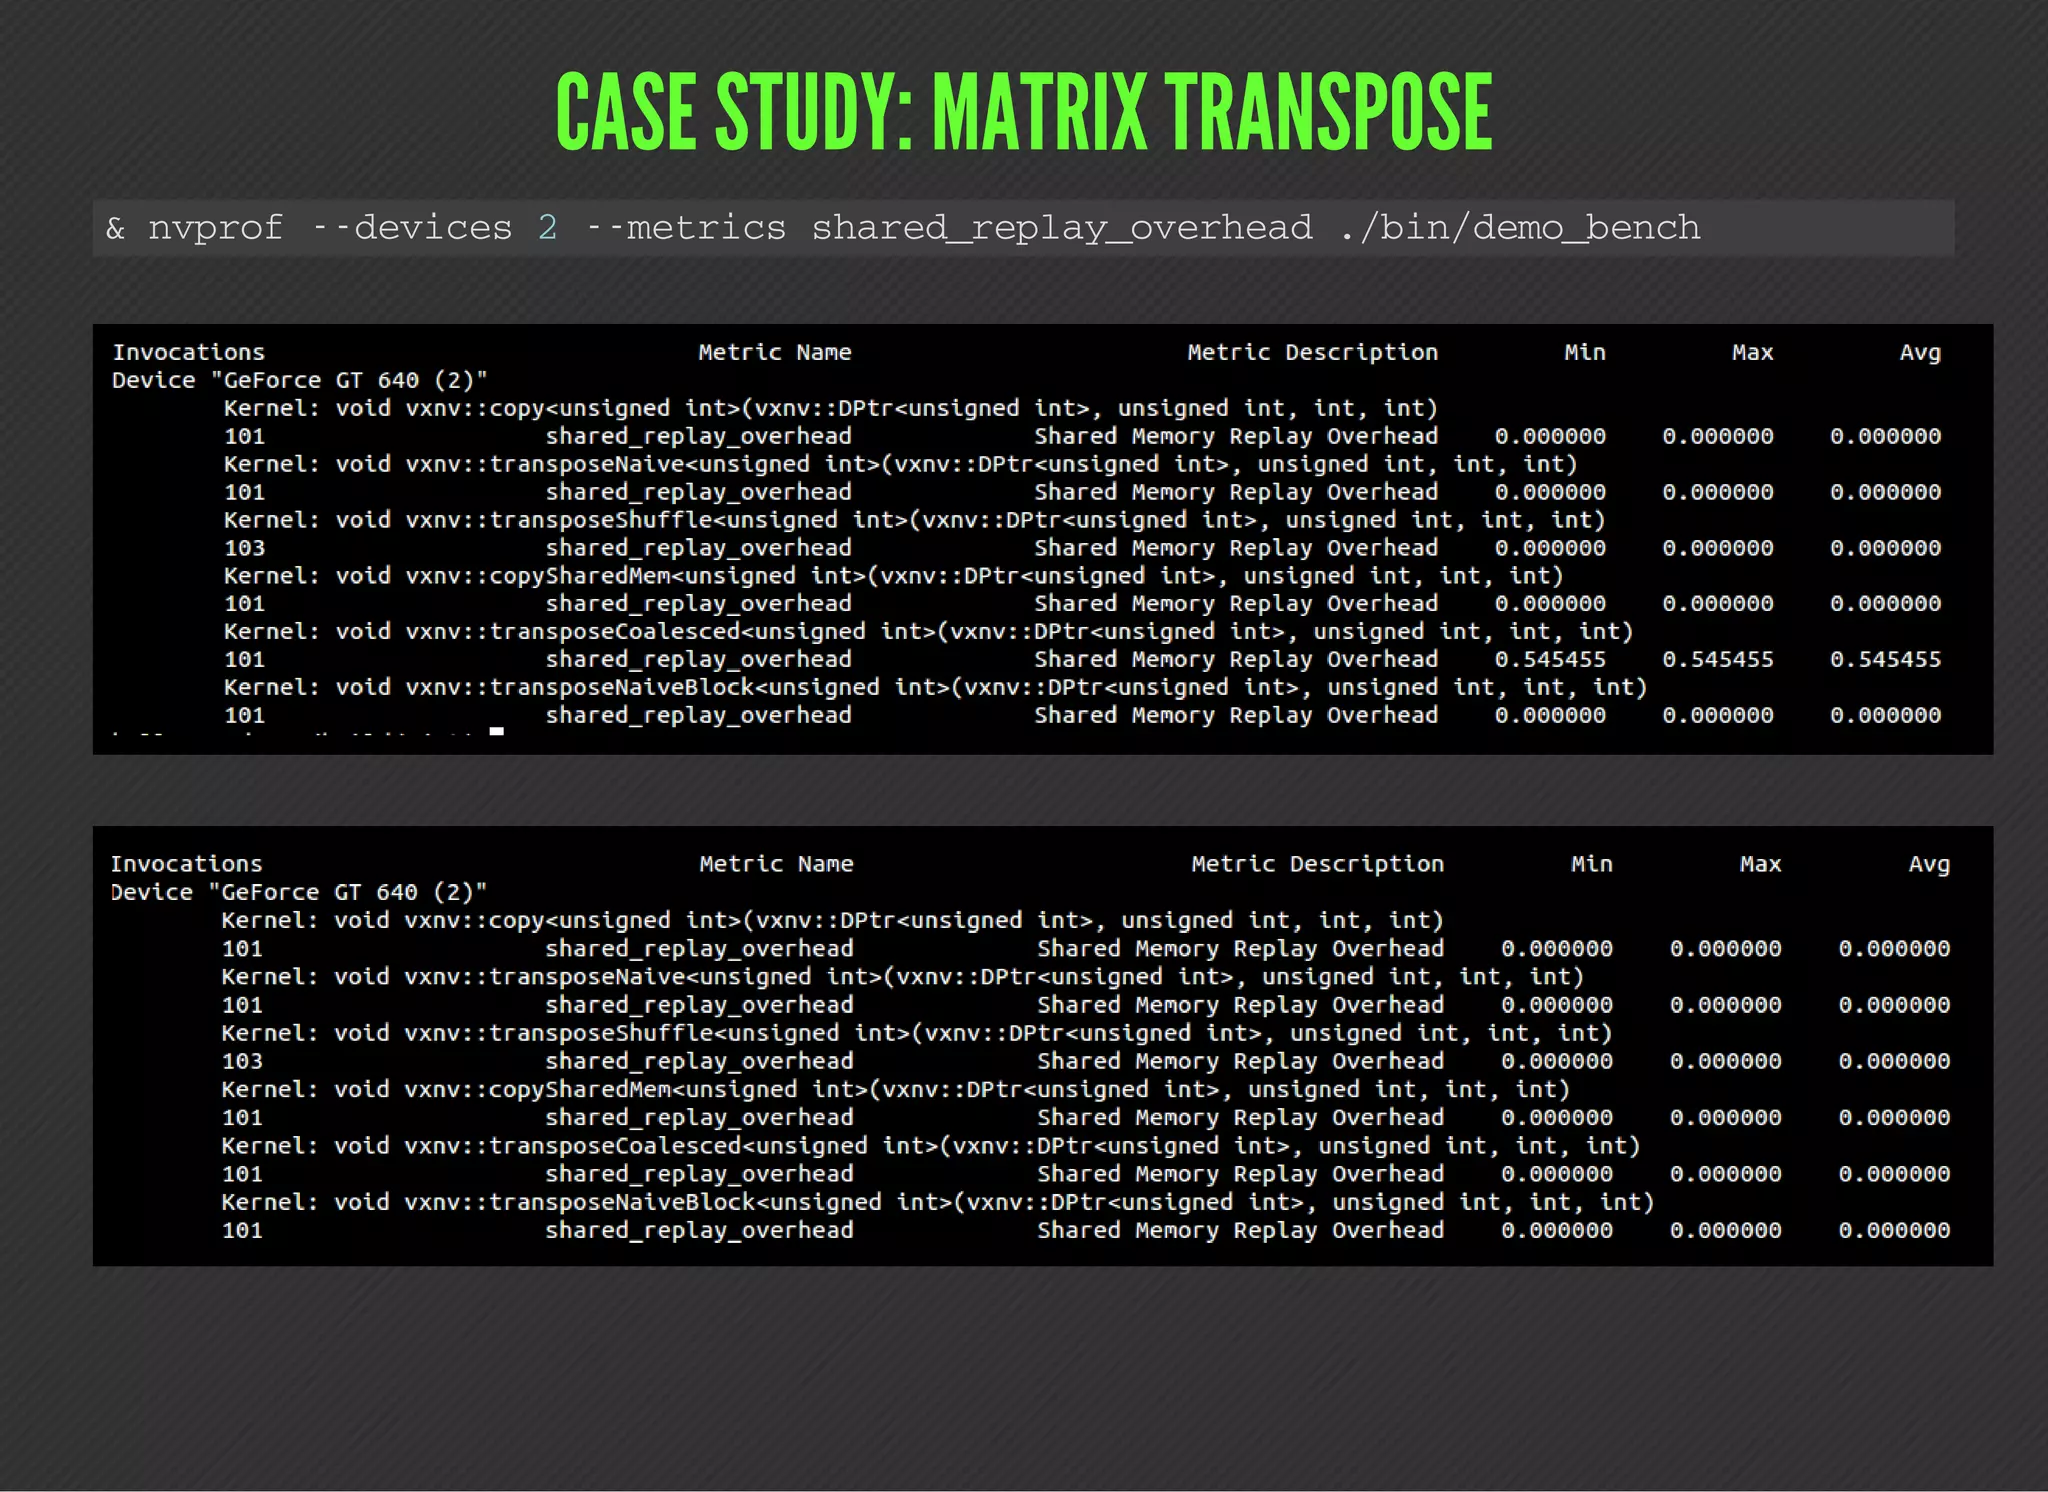
This document discusses various techniques for identifying performance limiters in GPU code using CUDA. It recommends timing different parts of code, profiling to collect metrics and events, prototyping kernel parts separately, and benchmarking hardware characteristics. It provides examples of measuring wall time and GPU time. It also lists common profiling events, metrics, and discusses a case study of profiling a matrix transpose. The document emphasizes that profiling helps verify assumptions and identify bottlenecks, but does not replace optimization work.


![[Harvard CS264] 11b - Analysis-Driven Performance Optimization with CUDA (Cli...](https://cdn.slidesharecdn.com/ss_thumbnails/analysisdrivenoptimization-110407230024-phpapp01-thumbnail.jpg?width=640&height=640&fit=bounds)
![[Harvard CS264] 11a - Programming the Memory Hierarchy with Sequoia (Mike Bau...](https://cdn.slidesharecdn.com/ss_thumbnails/analysisdrivenoptimization-110407225811-phpapp02-thumbnail.jpg?width=640&height=640&fit=bounds)