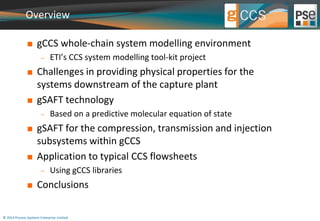
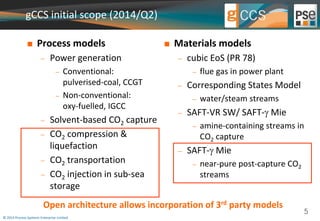
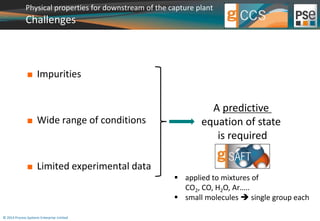
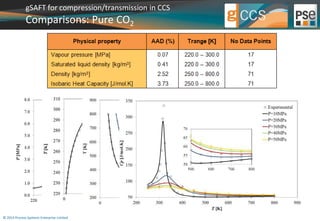
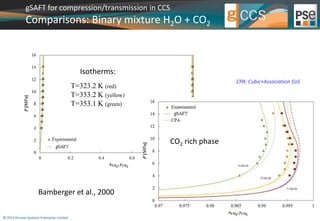
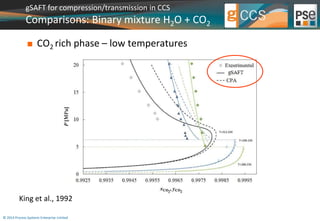
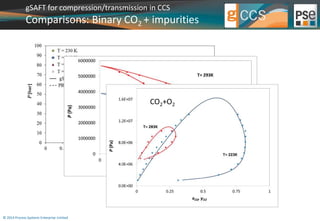
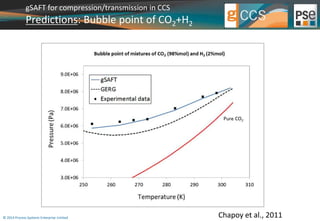
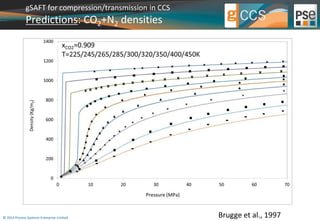
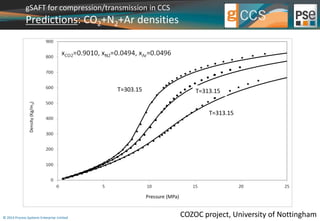
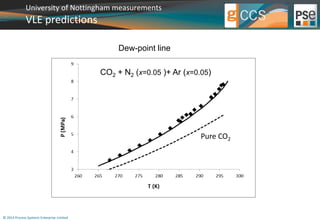
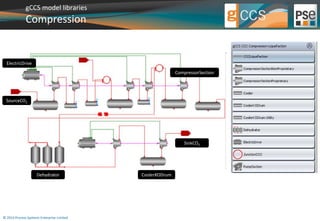
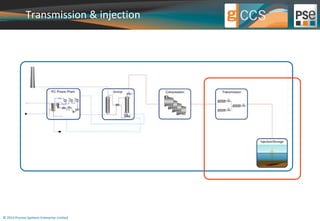
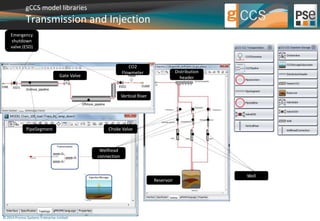
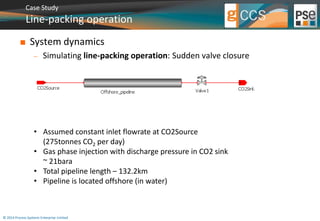
THE ADVANCED PROCESS MODELING COMPANY 
gSAFT: advanced physical properties for carbon 
© 2014 Process Systems Enterprise Limited 
capture and storage system modelling 
J. Rodriguez, M. Calado, E. Dias, A. Lawal, N. Samsatli, A. 
Ramos, T. Lafitte, J. Fuentes, C. Pantelides 
CO2 Properties and EoS for pipeline engineering 
York 
11 November 2014
Overview 
 gCCS whole-chain system modelling environment 
 ETI’s CCS system modelling tool-kit project 
 Challenges in providing physical properties for the 
systems downstream of the capture plant 
 gSAFT technology 
 Based on a predictive molecular equation of state 
 gSAFT for the compression, transmission and injection 
subsystems within gCCS 
 Application to typical CCS flowsheets 
 Using gCCS libraries 
 Conclusions 
© 2014 Process Systems Enterprise Limited
gCCS whole-chain system modelling 
environment 
ETI’s CCS system modelling tool-kit project 
© 2014 Process Systems Enterprise Limited
The CCS System Modelling Tool-kit Project 
2011-2014 
 Energy Technologies Institute (ETI) 
© 2014 Process Systems Enterprise Limited 
gPROMS modelling 
platform & expertise 
Project 
Management 
 ~$5m project commissioned & 
co-funded by the ETI 
 Objective: “end-to-end” CCS modelling tool
gCCS initial scope (2014/Q2) 
 Process models 
 Power generation 
 Conventional: 
pulverised-coal, CCGT 
 Non-conventional: 
oxy-fuelled, IGCC 
 Solvent-based CO2 capture 
 CO2 compression & 
liquefaction 
 CO2 transportation 
 CO2 injection in sub-sea 
storage 
© 2014 Process Systems Enterprise Limited 
 Materials models 
 cubic EoS (PR 78) 
 flue gas in power plant 
 Corresponding States Model 
 water/steam streams 
 SAFT-VR SW/ SAFT- Mie 
 amine-containing streams in 
CO2 capture 
 SAFT- Mie 
 near-pure post-capture CO2 
streams 
Open architecture allows incorporation of 3rd party models 
5
Physical properties for subsystems downstream 
of the capture plant 
Challenges 
© 2014 Process Systems Enterprise Limited
Physical properties for downstream of the capture plant 
CO2 phase diagram 
Best choices for CO2 
transmission 
 liquid-like density 
 gas-like viscosity 
Physical properties for pure CO2 predicted very accurately by Span & Wagner EoS 
Span, Wagner. "A new equation of state for carbon dioxide covering the fluid region from the triple‐point 
© 2014 Process Systems Enterprise Limited 
temperature to 1100 K at pressures up to 800 MPa." 
Journal of physical and chemical reference data 25 (1996): 1509.
Physical properties for downstream of the capture plant 
Challenges I: Impurities 
From post-combustion (dry basis): 
CO2 (>99%), N2 (<0.17%), O2 (<0.01%), SOx (10 ppmv), traces of Ar 
From pre-combustion (dry basis): 
CO2 (>95.6%), H2S (<3.4%), H2 (<3%), N2 (<0.6%), CO (<0.4%), Ar (<0.05%), CH4 (350 
ppmv) 
From oxyfuel (dry basis): 
CO2 (>74.66%), N2 (<15%), Ar (<2.5%), O2 (<6.15%), SOx (<2.5%), traces of CO 
© 2014 Process Systems Enterprise Limited 
…plus H2O 
The presence of impurities significantly affects physical properties 
(densities, phase envelope, critical temperature and pressure,…) 
 impact on compressor/pump power, pipeline capacity, 
potential for hydrate formation & two phase flow, 
distance between booster stations…
Physical properties for downstream of the capture plant 
Challenges II : Wide range of conditions 
 Compression subsystem 
 Pressures 
 Inlet 0.5 to 5 bara 
 Outlet 10 to 200 bara 
 Temperatures 
 Inlet 20-41 °C 
 Outlet 40-130 °C 
 Transmission subsystem 
 Pressures 
 50-200 bara 
 Temperatures 
 -5-40 °C 
© 2014 Process Systems Enterprise Limited 
Compression 
Transmission
Physical properties for downstream of the capture plant 
Challenges III: Limited experimental data 
 Recent literature review of experimental data 
 Li, Hailong, et al. 
"PVTxy properties of CO2 mixtures relevant for CO2 capture, transport and 
storage: Review of available experimental data and theoretical models." 
Applied Energy 88.11 (2011): 3567-3579. 
 Limited range of conditions 
 Gaps for several binary mixtures 
 some mixtures (e.g. CO2-SO2) are very corrosive 
 experimentation problematic 
 Very scarce data for ternaries and beyond 
Working on solving this 
• Release of experimental data from several projects 
• Experimental plan at University of Nottingham for VLE measurements of near-pure 
CO2 mixtures 
© 2014 Process Systems Enterprise Limited
Physical properties for downstream of the capture plant 
Challenges 
© 2014 Process Systems Enterprise Limited 
 applied to mixtures of 
CO2, CO, H2O, Ar….. 
 small molecules  single group each 
 Impurities 
 Wide range of conditions 
 Limited experimental data 
A predictive 
equation of state 
is required
gSAFT 
A commercial implementation of the SAFT-γ Mie 
equation of state 
© 2014 Process Systems Enterprise Limited
gSAFT 
The Statistical Association Fluid Theory I 
 Molecular-based EOS are a very appealing alternative to 
more classical approaches, such as cubic EOS 
 The Statistical Association Fluid Theory (SAFT) is especially 
relevant for its ability to deal with complex fluids 
 SAFT-based EOS are rooted on statistical mechanics, so 
 they involve a limited number of parameters 
 with a clear physical meaning 
 can be fitted to a limited amount of experimental data 
 can predict phase behaviour and physical properties for a wide range of 
conditions, including those far from the ones employed for parameter 
estimation 
© 2014 Process Systems Enterprise Limited
gSAFT 
The Statistical Association Fluid Theory II 
 PSE’s gSAFT is a commercial implementation of one of the 
most advanced SAFT-based EOS 
 SAFT- Mie, developed by Imperial College London 
 SAFT: Chapman, Gubbins, Jackson, Radosz, Ind. Eng. Chem. Res., 29, 1709 (1990) 
 SAFT-VR: Gil-Villegas, Galindo, Whitehead, Mills, Jackson, Burgess, J. Chem. Phys., 106, 4168 
(1997) 
 SAFT-γ: Lymperiadis, Adjiman, Jackson, Galindo, Fluid Phase Equilib., 274, 85 (2008) 
 SAFT-γ Mie: Papaioannou, Lafitte, Avendaño, Adjiman, Jackson, Muller, Galindo, in preparation 
(2014) 
© 2014 Process Systems Enterprise Limited
gSAFT 
SAFT-γ Mie molecular model 
 Molecules are modelled as chains of spheres 
 Interactions 
 dispersion/repulsion (van der Waals) 
forces 
 hydrogen bonding via off-centre 
electron donor/acceptor 
(“association”) sites 
 ionic (coulombic) forces 
© 2014 Process Systems Enterprise Limited 
U ( r ) 
C 
  
   R   A 
 
  
  
         r   r 
   
Mie potential 
Increasing strength
gSAFT 
Transferability of parameter values 
© 2014 Process Systems Enterprise Limited 
The values of the interaction parameters 
are assumed to be constant across 
different molecules and mixtures 
in different phases 
under different temperatures, pressures and compositions 
An approximation 
 based on SAFT- Mie’s fundamental molecular basis 
 supported by practical evidence
gSAFT for near-pure CO2 streams in gCCS 
© 2014 Process Systems Enterprise Limited
gSAFT for compression/transmission in CCS 
The gSAFT Databank 
H2O 
© 2014 Process Systems Enterprise Limited 
H2S 
CO2 
CH3OH 
CH4 
Ar 
H2 
SO2 
O2 
CO N2
gSAFT for compression/transmission in CCS 
Comparisons: Pure CO2 
© 2014 Process Systems Enterprise Limited
gSAFT for compression/transmission in CCS 
Comparisons: Binary mixture H2O + CO2 
© 2014 Process Systems Enterprise Limited 
Isotherms: 
T=323.2 K (red) 
T=333.2 K (yellow) 
T=353.1 K (green) 
CPA: Cubic+Association EoS 
CO2 rich phase 
Bamberger et al., 2000
gSAFT for compression/transmission in CCS 
Comparisons: Binary mixture H2O + CO2 
 CO2 rich phase – low temperatures 
King et al., 1992 
© 2014 Process Systems Enterprise Limited
gSAFT for compression/transmission in CCS 
Comparisons: Binary CO2 + impurities 
CO2+CH4 
© 2014 Process Systems Enterprise Limited 
CO2+H2S 
CO2+O2
gSAFT for compression/transmission in CCS 
Predictions: Bubble point of CO2+H2 
© 2014 Process Systems Enterprise Limited 
Chapoy et al., 2011
gSAFT for compression/transmission in CCS 
Predictions: CO2+N2 densities 
© 2014 Process Systems Enterprise Limited 
Brugge et al., 1997
gSAFT for compression/transmission in CCS 
Predictions: CO2+N2+Ar densities 
 University of Nottingham 
© 2014 Process Systems Enterprise Limited 
T=303.15 T=313.15 
T=313.15 
COZOC project, University of Nottingham
University of Nottingham measurements 
Experimental plan 
Dew-point and bubble-point lines for the following mixtures 
Mixture Name Component 1 Component 2 Component 3 x1 x2 x3 
E1 CO2 N2 Ar 0.90 0.05 0.05 
E2 CO2 N2 Ar 0.98 0.01 0.01 
E3 CO2 Ar H2 0.95 0.02 0.03 
 gSAFT predictive accuracy being tested 
 Specifically two-body interaction assumption 
 gSAFT model parameters will be readjusted if necessary 
© 2014 Process Systems Enterprise Limited
University of Nottingham measurements 
VLE predictions 
© 2014 Process Systems Enterprise Limited 
CO2 + N2 (x=0.05 )+ Ar (x=0.05) 
Pure CO2 
Dew-point line
University of Nottingham measurements 
VLE predictions 
© 2014 Process Systems Enterprise Limited 
Pure CO2 
Dew-point line 
CO2 + N2 (x=0.01 )+ Ar (x=0.01) 
Pure CO2
University of Nottingham measurements 
VLE predictions 
© 2014 Process Systems Enterprise Limited 
Dew-point line 
CO2 + H2 (x=0.03)+ Ar (x=0.02) 
Pure CO2
Application to typical CCS compression, 
transmission and injection flowsheets 
Using gCCS libraries 
© 2014 Process Systems Enterprise Limited
Compression 
© 2014 Process Systems Enterprise Limited
gCCS model libraries 
Compression 
ElectricDrive 
SourceCO2 
© 2014 Process Systems Enterprise Limited 
CompressorSection 
Dehydrator CoolerKODrum 
SinkCO2
Transmission & injection 
© 2014 Process Systems Enterprise Limited
gCCS model libraries 
Transmission and Injection 
Emergency 
shutdown 
valve (ESD) 
© 2014 Process Systems Enterprise Limited 
Well 
PipeSegment 
Gate Valve 
CO2 
Flowmeter 
Vertical Riser 
Distribution 
header 
Choke Valve 
Reservoir 
Wellhead 
connection
Case Study 
Line-packing operation 
 System dynamics 
 Simulating line-packing operation: Sudden valve closure 
• Assumed constant inlet flowrate at CO2Source 
(275tonnes CO2 per day) 
• Gas phase injection with discharge pressure in CO2 sink 
~ 21bara 
• Total pipeline length – 132.2km 
• Pipeline is located offshore (in water) 
© 2014 Process Systems Enterprise Limited
Case Study 
Line-packing operation 
 System dynamics 
 Simulating line-packing operation: Sudden valve closure 
© 2014 Process Systems Enterprise Limited 
Warning: Phase 
change identified!
Conclusions 
© 2014 Process Systems Enterprise Limited
Conclusions 
 Providing physical properties for a modelling tool for the 
systems downstream of the capture plant is challenging 
 Experimental data are limited 
 gSAFT is an implementation of a SAFT equation of state, 
perfectly suited to address these challenges 
 a parameter databank for the relevant components has been 
developed 
 excellent correlations and predictions have been demonstrated 
 gSAFT physical properties are already available within gCCS, 
an “end-to-end” modelling tool for CCS 
 for the simulation of compression/transmission/injection 
flowsheets 
© 2014 Process Systems Enterprise Limited
Acknowledgements 
 ETI Tool-kit development consortium 
 Energy Technologies Institute 
 E.On 
 EdF 
 Rolls-Royce 
 CO2DeepStore 
 E4Tech 
© 2014 Process Systems Enterprise Limited
PSE’s CCS Technology Team 
 Gerardo Sanchis 
 Power plant 
 Mário Calado 
 Compression Systems 
 Capture processes 
 Dr Adekola Lawal 
 Capture processes 
 Transmission & injection 
 Dr Javier Rodríguez 
 Capture processes 
 Physical properties (gSAFT) 
 Dr Tom Laffite 
 Physical properties (gSAFT) 
© 2014 Process Systems Enterprise Limited 
 Dr Nouri Samsatli 
 Power plant 
 Product development 
 Dr Javier Fuentes 
 Software development 
 Alfredo Ramos 
 Technology Manager 
 Mark Matzopoulos 
 Marketing & Business 
Development 
 Prof Costas Pantelides 
 Chief Technologist
World leaders in … 
© 2014 Process Systems Enterprise Limited 
Advanced Process Modelling 
Software & services

gSAFT: advanced physical properties for carbon capture and storage system modelling, Javier Rodriguez, Process Systems Enterprise Ltd. Presented at CO2 Properties and EoS for Pipeline Engineering, 11th November 2014

  • 1.
    THE ADVANCED PROCESSMODELING COMPANY gSAFT: advanced physical properties for carbon © 2014 Process Systems Enterprise Limited capture and storage system modelling J. Rodriguez, M. Calado, E. Dias, A. Lawal, N. Samsatli, A. Ramos, T. Lafitte, J. Fuentes, C. Pantelides CO2 Properties and EoS for pipeline engineering York 11 November 2014
  • 2.
    Overview  gCCSwhole-chain system modelling environment  ETI’s CCS system modelling tool-kit project  Challenges in providing physical properties for the systems downstream of the capture plant  gSAFT technology  Based on a predictive molecular equation of state  gSAFT for the compression, transmission and injection subsystems within gCCS  Application to typical CCS flowsheets  Using gCCS libraries  Conclusions © 2014 Process Systems Enterprise Limited
  • 3.
    gCCS whole-chain systemmodelling environment ETI’s CCS system modelling tool-kit project © 2014 Process Systems Enterprise Limited
  • 4.
    The CCS SystemModelling Tool-kit Project 2011-2014  Energy Technologies Institute (ETI) © 2014 Process Systems Enterprise Limited gPROMS modelling platform & expertise Project Management  ~$5m project commissioned & co-funded by the ETI  Objective: “end-to-end” CCS modelling tool
  • 5.
    gCCS initial scope(2014/Q2)  Process models  Power generation  Conventional: pulverised-coal, CCGT  Non-conventional: oxy-fuelled, IGCC  Solvent-based CO2 capture  CO2 compression & liquefaction  CO2 transportation  CO2 injection in sub-sea storage © 2014 Process Systems Enterprise Limited  Materials models  cubic EoS (PR 78)  flue gas in power plant  Corresponding States Model  water/steam streams  SAFT-VR SW/ SAFT- Mie  amine-containing streams in CO2 capture  SAFT- Mie  near-pure post-capture CO2 streams Open architecture allows incorporation of 3rd party models 5
  • 6.
    Physical properties forsubsystems downstream of the capture plant Challenges © 2014 Process Systems Enterprise Limited
  • 7.
    Physical properties fordownstream of the capture plant CO2 phase diagram Best choices for CO2 transmission  liquid-like density  gas-like viscosity Physical properties for pure CO2 predicted very accurately by Span & Wagner EoS Span, Wagner. "A new equation of state for carbon dioxide covering the fluid region from the triple‐point © 2014 Process Systems Enterprise Limited temperature to 1100 K at pressures up to 800 MPa." Journal of physical and chemical reference data 25 (1996): 1509.
  • 8.
    Physical properties fordownstream of the capture plant Challenges I: Impurities From post-combustion (dry basis): CO2 (>99%), N2 (<0.17%), O2 (<0.01%), SOx (10 ppmv), traces of Ar From pre-combustion (dry basis): CO2 (>95.6%), H2S (<3.4%), H2 (<3%), N2 (<0.6%), CO (<0.4%), Ar (<0.05%), CH4 (350 ppmv) From oxyfuel (dry basis): CO2 (>74.66%), N2 (<15%), Ar (<2.5%), O2 (<6.15%), SOx (<2.5%), traces of CO © 2014 Process Systems Enterprise Limited …plus H2O The presence of impurities significantly affects physical properties (densities, phase envelope, critical temperature and pressure,…)  impact on compressor/pump power, pipeline capacity, potential for hydrate formation & two phase flow, distance between booster stations…
  • 9.
    Physical properties fordownstream of the capture plant Challenges II : Wide range of conditions  Compression subsystem  Pressures  Inlet 0.5 to 5 bara  Outlet 10 to 200 bara  Temperatures  Inlet 20-41 °C  Outlet 40-130 °C  Transmission subsystem  Pressures  50-200 bara  Temperatures  -5-40 °C © 2014 Process Systems Enterprise Limited Compression Transmission
  • 10.
    Physical properties fordownstream of the capture plant Challenges III: Limited experimental data  Recent literature review of experimental data  Li, Hailong, et al. "PVTxy properties of CO2 mixtures relevant for CO2 capture, transport and storage: Review of available experimental data and theoretical models." Applied Energy 88.11 (2011): 3567-3579.  Limited range of conditions  Gaps for several binary mixtures  some mixtures (e.g. CO2-SO2) are very corrosive  experimentation problematic  Very scarce data for ternaries and beyond Working on solving this • Release of experimental data from several projects • Experimental plan at University of Nottingham for VLE measurements of near-pure CO2 mixtures © 2014 Process Systems Enterprise Limited
  • 11.
    Physical properties fordownstream of the capture plant Challenges © 2014 Process Systems Enterprise Limited  applied to mixtures of CO2, CO, H2O, Ar…..  small molecules  single group each  Impurities  Wide range of conditions  Limited experimental data A predictive equation of state is required
  • 12.
    gSAFT A commercialimplementation of the SAFT-γ Mie equation of state © 2014 Process Systems Enterprise Limited
  • 13.
    gSAFT The StatisticalAssociation Fluid Theory I  Molecular-based EOS are a very appealing alternative to more classical approaches, such as cubic EOS  The Statistical Association Fluid Theory (SAFT) is especially relevant for its ability to deal with complex fluids  SAFT-based EOS are rooted on statistical mechanics, so  they involve a limited number of parameters  with a clear physical meaning  can be fitted to a limited amount of experimental data  can predict phase behaviour and physical properties for a wide range of conditions, including those far from the ones employed for parameter estimation © 2014 Process Systems Enterprise Limited
  • 14.
    gSAFT The StatisticalAssociation Fluid Theory II  PSE’s gSAFT is a commercial implementation of one of the most advanced SAFT-based EOS  SAFT- Mie, developed by Imperial College London  SAFT: Chapman, Gubbins, Jackson, Radosz, Ind. Eng. Chem. Res., 29, 1709 (1990)  SAFT-VR: Gil-Villegas, Galindo, Whitehead, Mills, Jackson, Burgess, J. Chem. Phys., 106, 4168 (1997)  SAFT-γ: Lymperiadis, Adjiman, Jackson, Galindo, Fluid Phase Equilib., 274, 85 (2008)  SAFT-γ Mie: Papaioannou, Lafitte, Avendaño, Adjiman, Jackson, Muller, Galindo, in preparation (2014) © 2014 Process Systems Enterprise Limited
  • 15.
    gSAFT SAFT-γ Miemolecular model  Molecules are modelled as chains of spheres  Interactions  dispersion/repulsion (van der Waals) forces  hydrogen bonding via off-centre electron donor/acceptor (“association”) sites  ionic (coulombic) forces © 2014 Process Systems Enterprise Limited U ( r ) C      R   A               r   r    Mie potential Increasing strength
  • 16.
    gSAFT Transferability ofparameter values © 2014 Process Systems Enterprise Limited The values of the interaction parameters are assumed to be constant across different molecules and mixtures in different phases under different temperatures, pressures and compositions An approximation  based on SAFT- Mie’s fundamental molecular basis  supported by practical evidence
  • 17.
    gSAFT for near-pureCO2 streams in gCCS © 2014 Process Systems Enterprise Limited
  • 18.
    gSAFT for compression/transmissionin CCS The gSAFT Databank H2O © 2014 Process Systems Enterprise Limited H2S CO2 CH3OH CH4 Ar H2 SO2 O2 CO N2
  • 19.
    gSAFT for compression/transmissionin CCS Comparisons: Pure CO2 © 2014 Process Systems Enterprise Limited
  • 20.
    gSAFT for compression/transmissionin CCS Comparisons: Binary mixture H2O + CO2 © 2014 Process Systems Enterprise Limited Isotherms: T=323.2 K (red) T=333.2 K (yellow) T=353.1 K (green) CPA: Cubic+Association EoS CO2 rich phase Bamberger et al., 2000
  • 21.
    gSAFT for compression/transmissionin CCS Comparisons: Binary mixture H2O + CO2  CO2 rich phase – low temperatures King et al., 1992 © 2014 Process Systems Enterprise Limited
  • 22.
    gSAFT for compression/transmissionin CCS Comparisons: Binary CO2 + impurities CO2+CH4 © 2014 Process Systems Enterprise Limited CO2+H2S CO2+O2
  • 23.
    gSAFT for compression/transmissionin CCS Predictions: Bubble point of CO2+H2 © 2014 Process Systems Enterprise Limited Chapoy et al., 2011
  • 24.
    gSAFT for compression/transmissionin CCS Predictions: CO2+N2 densities © 2014 Process Systems Enterprise Limited Brugge et al., 1997
  • 25.
    gSAFT for compression/transmissionin CCS Predictions: CO2+N2+Ar densities  University of Nottingham © 2014 Process Systems Enterprise Limited T=303.15 T=313.15 T=313.15 COZOC project, University of Nottingham
  • 26.
    University of Nottinghammeasurements Experimental plan Dew-point and bubble-point lines for the following mixtures Mixture Name Component 1 Component 2 Component 3 x1 x2 x3 E1 CO2 N2 Ar 0.90 0.05 0.05 E2 CO2 N2 Ar 0.98 0.01 0.01 E3 CO2 Ar H2 0.95 0.02 0.03  gSAFT predictive accuracy being tested  Specifically two-body interaction assumption  gSAFT model parameters will be readjusted if necessary © 2014 Process Systems Enterprise Limited
  • 27.
    University of Nottinghammeasurements VLE predictions © 2014 Process Systems Enterprise Limited CO2 + N2 (x=0.05 )+ Ar (x=0.05) Pure CO2 Dew-point line
  • 28.
    University of Nottinghammeasurements VLE predictions © 2014 Process Systems Enterprise Limited Pure CO2 Dew-point line CO2 + N2 (x=0.01 )+ Ar (x=0.01) Pure CO2
  • 29.
    University of Nottinghammeasurements VLE predictions © 2014 Process Systems Enterprise Limited Dew-point line CO2 + H2 (x=0.03)+ Ar (x=0.02) Pure CO2
  • 30.
    Application to typicalCCS compression, transmission and injection flowsheets Using gCCS libraries © 2014 Process Systems Enterprise Limited
  • 31.
    Compression © 2014Process Systems Enterprise Limited
  • 32.
    gCCS model libraries Compression ElectricDrive SourceCO2 © 2014 Process Systems Enterprise Limited CompressorSection Dehydrator CoolerKODrum SinkCO2
  • 33.
    Transmission & injection © 2014 Process Systems Enterprise Limited
  • 34.
    gCCS model libraries Transmission and Injection Emergency shutdown valve (ESD) © 2014 Process Systems Enterprise Limited Well PipeSegment Gate Valve CO2 Flowmeter Vertical Riser Distribution header Choke Valve Reservoir Wellhead connection
  • 35.
    Case Study Line-packingoperation  System dynamics  Simulating line-packing operation: Sudden valve closure • Assumed constant inlet flowrate at CO2Source (275tonnes CO2 per day) • Gas phase injection with discharge pressure in CO2 sink ~ 21bara • Total pipeline length – 132.2km • Pipeline is located offshore (in water) © 2014 Process Systems Enterprise Limited
  • 36.
    Case Study Line-packingoperation  System dynamics  Simulating line-packing operation: Sudden valve closure © 2014 Process Systems Enterprise Limited Warning: Phase change identified!
  • 37.
    Conclusions © 2014Process Systems Enterprise Limited
  • 38.
    Conclusions  Providingphysical properties for a modelling tool for the systems downstream of the capture plant is challenging  Experimental data are limited  gSAFT is an implementation of a SAFT equation of state, perfectly suited to address these challenges  a parameter databank for the relevant components has been developed  excellent correlations and predictions have been demonstrated  gSAFT physical properties are already available within gCCS, an “end-to-end” modelling tool for CCS  for the simulation of compression/transmission/injection flowsheets © 2014 Process Systems Enterprise Limited
  • 39.
    Acknowledgements  ETITool-kit development consortium  Energy Technologies Institute  E.On  EdF  Rolls-Royce  CO2DeepStore  E4Tech © 2014 Process Systems Enterprise Limited
  • 40.
    PSE’s CCS TechnologyTeam  Gerardo Sanchis  Power plant  Mário Calado  Compression Systems  Capture processes  Dr Adekola Lawal  Capture processes  Transmission & injection  Dr Javier Rodríguez  Capture processes  Physical properties (gSAFT)  Dr Tom Laffite  Physical properties (gSAFT) © 2014 Process Systems Enterprise Limited  Dr Nouri Samsatli  Power plant  Product development  Dr Javier Fuentes  Software development  Alfredo Ramos  Technology Manager  Mark Matzopoulos  Marketing & Business Development  Prof Costas Pantelides  Chief Technologist
  • 41.
    World leaders in… © 2014 Process Systems Enterprise Limited Advanced Process Modelling Software & services