Downloaded 39 times


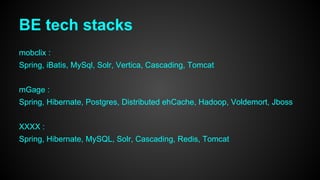

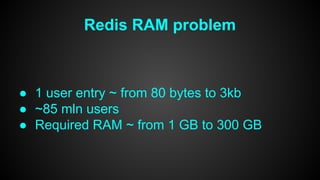
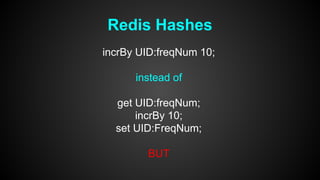
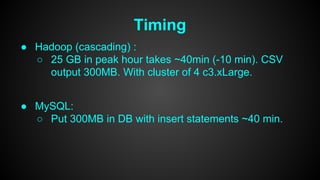
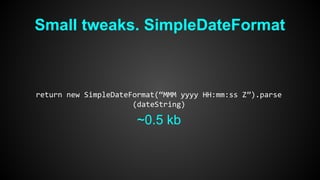
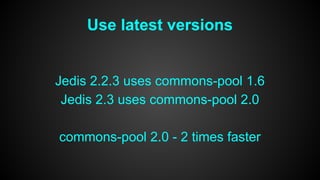
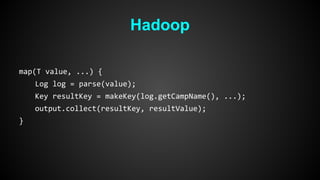
![“Simple” query
"-(-connectionTypes:"+"""+getConnectionType()+"""+" AND connectionTypes:[* TO
*]) AND "+"-connectionTypeExcludes:"+"""+getConnectionType()+"""+" AND " + "-(-
OSes:"+"(""+osQuery+"" OR ""+getOS()+"")"+" AND OSes:[* TO *]) AND " + "-
osExcludes:"+"(""+osQuery+"" OR ""+getOS()+"")" "AND (runOfNetwork:T OR
appIncludes:"+getAppId()+" OR pubIncludes:"+getPubId()+" OR categories:
("+categoryList+"))" +" AND -appExcludes:"+getAppId()+" AND -pubExcludes:"
+getPubId()+" AND -categoryExcludes:("+categoryList+") AND " + keywordQuery+" AND
" + "-(-devices:"+"""+getHandsetNormalized()+"""+" AND devices:[* TO *]) AND " +
"-deviceExcludes:"+"""+getHandsetNormalized()+"""+" AND " + "-(-carriers:"+"""
+getCarrier()+"""+" AND carriers:[* TO *]) AND " + "-carrierExcludes:"+"""
+getCarrier()+"""+" AND " + "-(-locales:"+"(""+locale+"" OR ""+langOnly+"")"
+" AND locales:[* TO *]) AND " + "-localeExcludes:"+"(""+locale+"" OR ""
+langOnly+"") AND " + "-(-segments:("+segmentQuery+") AND segments:[* TO *]) AND
" + "-segmentExcludes:("+segmentQuery+")" + " AND -(-geos:"+geoQuery+" AND geos:[*
TO *]) AND " + "-geosExcludes:"+geoQuery](https://image.slidesharecdn.com/javaevening-140410062254-phpapp02/85/Tweaking-performance-on-high-load-projects-17-320.jpg)

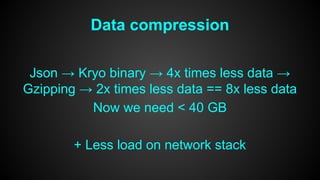
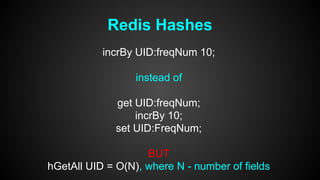
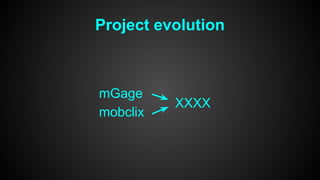
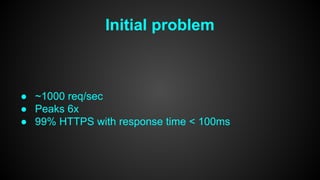
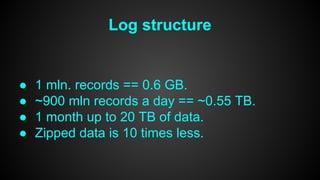
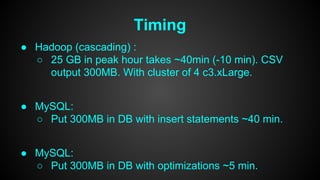
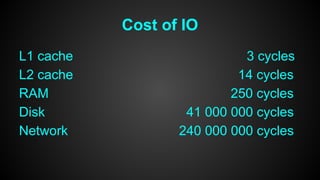
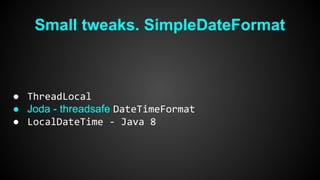
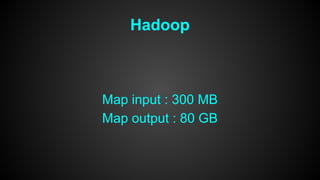
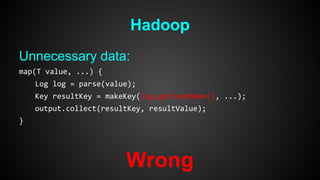
![Log structure
{ "uid":"test",
"platform":"android",
"app":"xxx",
"ts":1375952275223,
"pid":1,
"education":"Some-Highschool-or-less",
"type":"new",
"sh":1280,
"appver":"6.4.34",
"country":"AU",
"time":"Sat, 03 August 2013 10:30:39 +0200",
"deviceGroup":7,
"rid":"fc389d966438478e9554ed15d27713f51",
"responseCode":200,
"event":"ad",
"device":"N95",
"sw":768,
"ageGroup":"18-24",
"preferences":["beer","girls"] }](https://image.slidesharecdn.com/javaevening-140410062254-phpapp02/85/Tweaking-performance-on-high-load-projects-35-320.jpg)


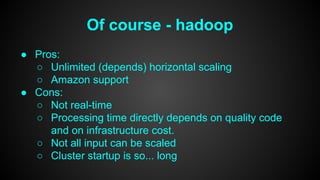

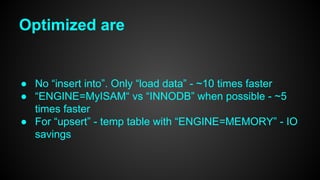

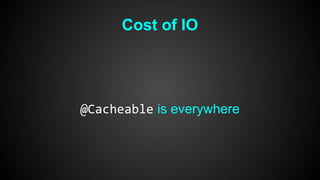
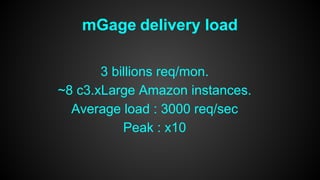
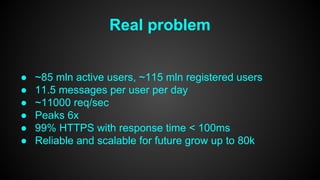
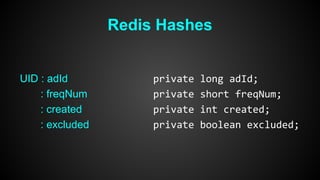
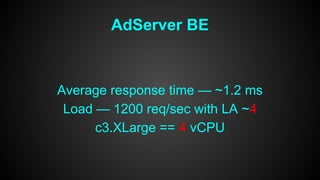
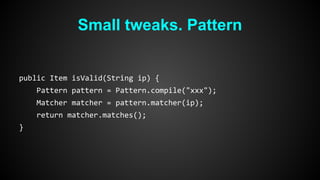
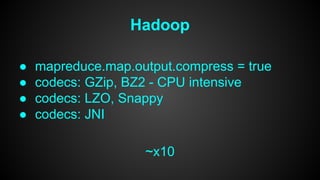
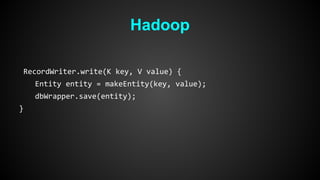
![Java 7. Less garbage
new ArrayList():
this.elementData = {};
insteadOf
this.elementData = new Object
[10];
new HashMap():
Entry<K,V>[] table = {};
insteadOf
this.table = new Entry[16];](https://image.slidesharecdn.com/javaevening-140410062254-phpapp02/85/Tweaking-performance-on-high-load-projects-54-320.jpg)
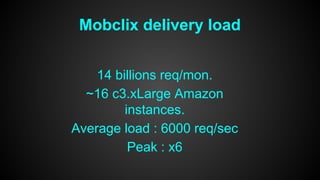
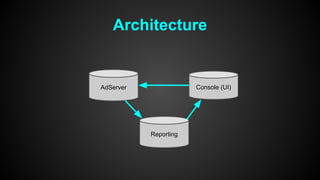
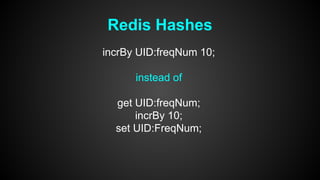
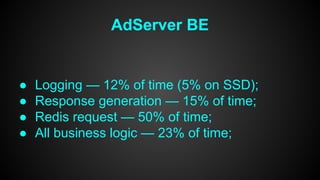
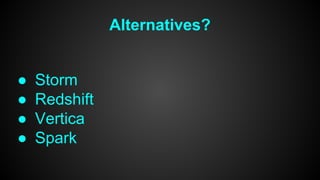
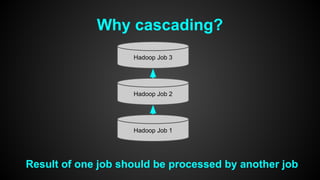
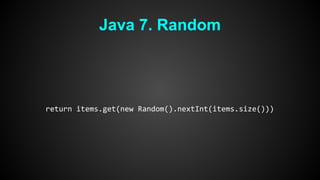
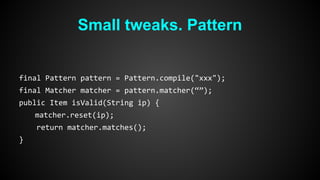
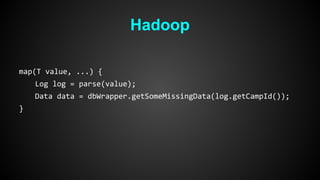
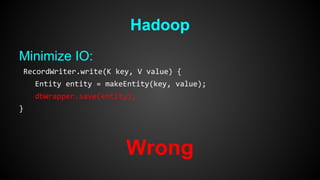
![Java 7. Less garbage
Before:
class String {
int offset;
int count;
char value[];
int hash;
}
After:
class String {
char value[];
int hash;
}](https://image.slidesharecdn.com/javaevening-140410062254-phpapp02/85/Tweaking-performance-on-high-load-projects-55-320.jpg)
![Small tweaks. String.split
item.getPreferences().split(“[_,;,-]”);](https://image.slidesharecdn.com/javaevening-140410062254-phpapp02/85/Tweaking-performance-on-high-load-projects-63-320.jpg)
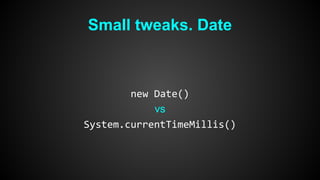
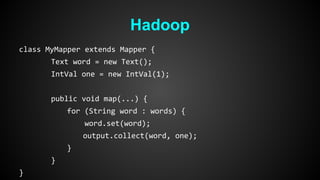
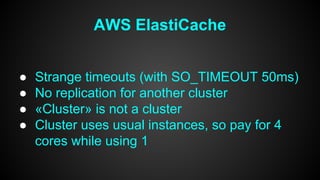
![Small tweaks. String.split
item.getPreferences().split(“[_,;,-]”);
vs
static final Pattern PATTERN = Pattern.compile("[_,;,-]");
PATTERN.split(item.getPreferences()) - ~2x faster
vs
custom code - up to 5x faster](https://image.slidesharecdn.com/javaevening-140410062254-phpapp02/85/Tweaking-performance-on-high-load-projects-64-320.jpg)

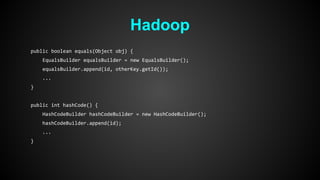

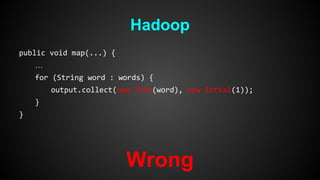


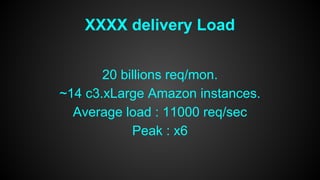
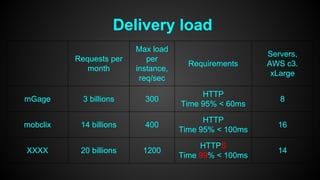
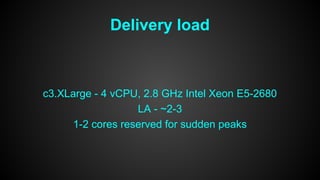
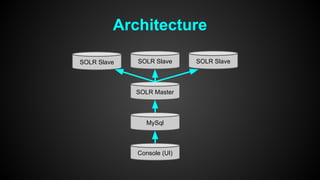
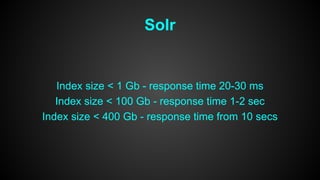
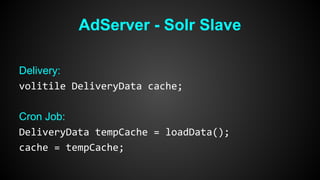
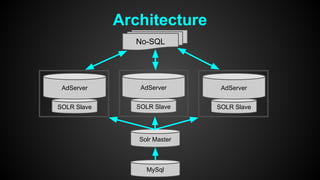
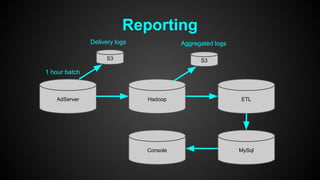
This document discusses optimizing performance for high-load projects. It summarizes the delivery loads and technologies used for several projects including mGage, mobclix and XXXX. It then discusses optimizations made to improve performance, including using Solr for search, Redis for real-time data, Hadoop for reporting, and various Java optimizations in moving to Java 7. Specific optimizations discussed include reducing garbage collection, improving random number generation, and minimizing I/O operations.