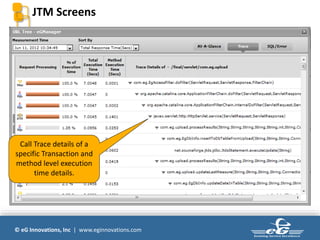
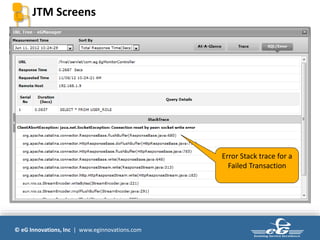
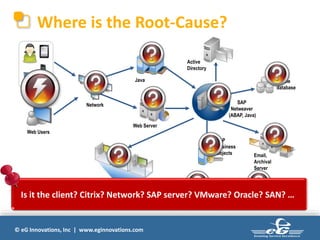
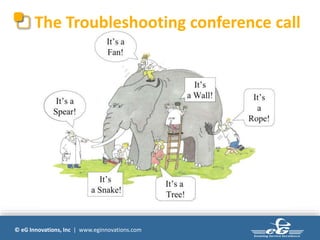
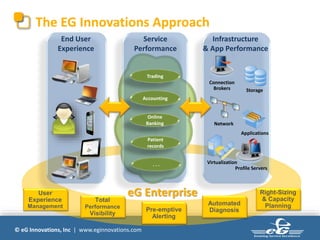
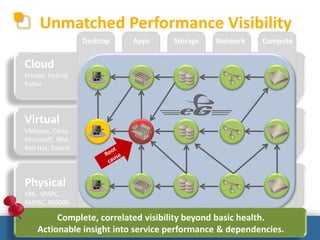
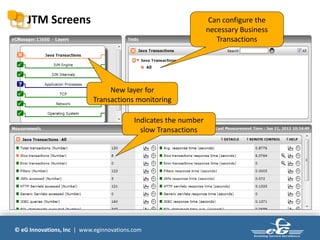
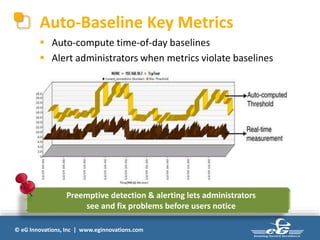
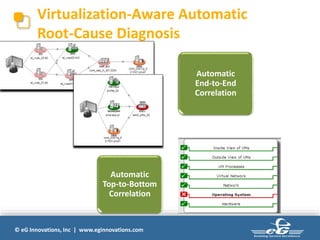
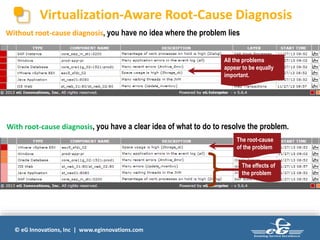
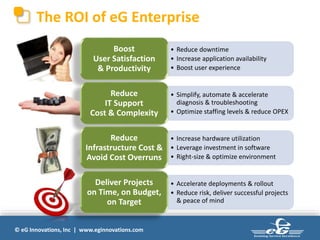
Java Application 
Performance & Analytics 
A Product Tour 
Presenter 
Bala Vaidhinathan | CTO | eG Innovations
Java Performance Challenges 
© eG Innovations, Inc | www.eginnovations.com
Where is the Root-Cause? 
Web Users 
Network 
Web Server 
© eG Innovations, Inc | www.eginnovations.com 
SAP 
Netweaver 
(ABAP, Java) 
Active 
Directory 
Oracle 
database 
vSphere Server SAN Switch 
SAN 
Storage 
SAP 
Business 
Objects 
Citrix Users 
Java 
Email, 
Archival 
Server 
Is it the client? Citrix? Network? SAP server? VMware? Oracle? SAN? …
Java Monitoring Today 
© eG Innovations, Inc | www.eginnovations.com
The Troubleshooting conference call 
© eG Innovations, Inc | www.eginnovations.com
How Can eG Innovations Help – 
Live Tour 
© eG Innovations, Inc | www.eginnovations.com
The EG Innovations Approach 
End User 
Experience 
© eG Innovations, Inc | www.eginnovations.com 
Infrastructure 
& App Performance 
Automated 
Diagnosis 
User 
Experience 
Management 
Right-Sizing 
& Capacity 
Planning 
Trading 
Accounting 
Pre-emptive 
Alerting 
Total 
Performance 
Visibility 
Storage 
Connection 
Brokers 
Profile Servers 
Network 
Applications 
Virtualization 
Service 
Performance 
Online 
Banking 
Patient 
records 
. . . 
eG Enterprise
Unmatched Performance Visibility 
Cloud 
Private, Hybrid, 
Public 
Virtual 
VMware, Citrix, 
Microsoft, IBM, 
Red Hat, Solaris 
Physical 
X86, SPARC, 
PARISC, RS6000 
Desktop Apps Storage Network Compute 
! 
Complete, correlated visibility beyond basic health. 
Actionable insight into service performance & dependencies. 
© eG Innovations, Inc | www.eginnovations.com
Java Transactions 
© eG Innovations, Inc | www.eginnovations.com
JTM Screens 
New layer for 
Transactions monitoring 
Indicates the number 
slow Transactions 
© eG Innovations, Inc | www.eginnovations.com 
Can configure the 
necessary Business 
Transactions
JTM Screens 
Transaction details 
© eG Innovations, Inc | www.eginnovations.com 
Sub Component level 
Response time details
JTM Screens 
List of Transaction in the 
measurement period 
© eG Innovations, Inc | www.eginnovations.com 
Specific Transaction 
details 
Method level details of a 
specific Transaction
JTM Screens 
J2EE Component level 
Response time breakup 
© eG Innovations, Inc | www.eginnovations.com
JTM Screens 
List of Queries executed 
in a specific Transaction 
and its Response time 
breakup 
© eG Innovations, Inc | www.eginnovations.com
JTM Screens 
Call Trace details of a 
specific Transaction and 
method level execution 
time details. 
© eG Innovations, Inc | www.eginnovations.com
JTM Screens 
© eG Innovations, Inc | www.eginnovations.com 
Error Stack trace for a 
Failed Transaction
eG’s Key Technologies 
© eG Innovations, Inc | www.eginnovations.com
The eG Universal Monitor 
•A single agent license for Microsoft, Linux, 
Sun Solaris, HPUX,IBM AIX, VMware, Tru64 
•A single price, regardless of OS or server 
configuration - 2, 4, 8, 16 CPUs 
•A single agent for monitoring any 
application 
© eG Innovations, Inc | www.eginnovations.com 
•A single price to manage multiple 
applications on the same server 
•Auto-upgradeable 
•Agentless monitoring option 
•100% web-based – HTTP/HTTPS
Auto-Baseline Key Metrics 
 Auto-compute time-of-day baselines 
 Alert administrators when metrics violate baselines 
Preemptive detection & alerting lets administrators 
see and fix problems before users notice 
© eG Innovations, Inc | www.eginnovations.com
Virtualization-Aware Automatic 
Root-Cause Diagnosis 
© eG Innovations, Inc | www.eginnovations.com 
Automatic 
End-to-End 
Correlation 
Automatic 
Top-to-Bottom 
Correlation
Virtualization-Aware Root-Cause Diagnosis 
Without root-cause diagnosis, you have no idea where the problem lies 
With root-cause diagnosis, you have a clear idea of what to do to resolve the problem. 
© eG Innovations, Inc | www.eginnovations.com 
All the problems 
appear to be equally 
important. 
The root-cause 
of the problem 
The effects of 
the problem
The ROI of eG Enterprise 
© eG Innovations, Inc | www.eginnovations.com 
• Reduce downtime 
• Increase application availability 
• Boost user experience 
Boost 
User Satisfaction 
& Productivity 
• Simplify, automate & accelerate 
diagnosis & troubleshooting 
• Optimize staffing levels & reduce OPEX 
Reduce 
IT Support 
Cost & Complexity 
• Increase hardware utilization 
• Leverage investment in software 
• Right-size & optimize environment 
Reduce 
Infrastructure Cost & 
Avoid Cost Overruns 
• Accelerate deployments & rollout 
• Reduce risk, deliver successful projects 
& peace of mind 
Deliver Projects 
on Time, on Budget, 
on Target
&
Next Steps 
More details 
http://www.eginnovations.com/freetrial 
 Send an Email 
info@eginnovations.com 
 Call Us +1 (866) 526 6700 
© eG Innovations, Inc | www.eginnovations.com

Java Application Performance and Analytics

  • 1.
    Java Application Performance& Analytics A Product Tour Presenter Bala Vaidhinathan | CTO | eG Innovations
  • 2.
    Java Performance Challenges © eG Innovations, Inc | www.eginnovations.com
  • 3.
    Where is theRoot-Cause? Web Users Network Web Server © eG Innovations, Inc | www.eginnovations.com SAP Netweaver (ABAP, Java) Active Directory Oracle database vSphere Server SAN Switch SAN Storage SAP Business Objects Citrix Users Java Email, Archival Server Is it the client? Citrix? Network? SAP server? VMware? Oracle? SAN? …
  • 4.
    Java Monitoring Today © eG Innovations, Inc | www.eginnovations.com
  • 5.
    The Troubleshooting conferencecall © eG Innovations, Inc | www.eginnovations.com
  • 6.
    How Can eGInnovations Help – Live Tour © eG Innovations, Inc | www.eginnovations.com
  • 7.
    The EG InnovationsApproach End User Experience © eG Innovations, Inc | www.eginnovations.com Infrastructure & App Performance Automated Diagnosis User Experience Management Right-Sizing & Capacity Planning Trading Accounting Pre-emptive Alerting Total Performance Visibility Storage Connection Brokers Profile Servers Network Applications Virtualization Service Performance Online Banking Patient records . . . eG Enterprise
  • 8.
    Unmatched Performance Visibility Cloud Private, Hybrid, Public Virtual VMware, Citrix, Microsoft, IBM, Red Hat, Solaris Physical X86, SPARC, PARISC, RS6000 Desktop Apps Storage Network Compute ! Complete, correlated visibility beyond basic health. Actionable insight into service performance & dependencies. © eG Innovations, Inc | www.eginnovations.com
  • 9.
    Java Transactions ©eG Innovations, Inc | www.eginnovations.com
  • 10.
    JTM Screens Newlayer for Transactions monitoring Indicates the number slow Transactions © eG Innovations, Inc | www.eginnovations.com Can configure the necessary Business Transactions
  • 11.
    JTM Screens Transactiondetails © eG Innovations, Inc | www.eginnovations.com Sub Component level Response time details
  • 12.
    JTM Screens Listof Transaction in the measurement period © eG Innovations, Inc | www.eginnovations.com Specific Transaction details Method level details of a specific Transaction
  • 13.
    JTM Screens J2EEComponent level Response time breakup © eG Innovations, Inc | www.eginnovations.com
  • 14.
    JTM Screens Listof Queries executed in a specific Transaction and its Response time breakup © eG Innovations, Inc | www.eginnovations.com
  • 15.
    JTM Screens CallTrace details of a specific Transaction and method level execution time details. © eG Innovations, Inc | www.eginnovations.com
  • 16.
    JTM Screens ©eG Innovations, Inc | www.eginnovations.com Error Stack trace for a Failed Transaction
  • 17.
    eG’s Key Technologies © eG Innovations, Inc | www.eginnovations.com
  • 18.
    The eG UniversalMonitor •A single agent license for Microsoft, Linux, Sun Solaris, HPUX,IBM AIX, VMware, Tru64 •A single price, regardless of OS or server configuration - 2, 4, 8, 16 CPUs •A single agent for monitoring any application © eG Innovations, Inc | www.eginnovations.com •A single price to manage multiple applications on the same server •Auto-upgradeable •Agentless monitoring option •100% web-based – HTTP/HTTPS
  • 19.
    Auto-Baseline Key Metrics  Auto-compute time-of-day baselines  Alert administrators when metrics violate baselines Preemptive detection & alerting lets administrators see and fix problems before users notice © eG Innovations, Inc | www.eginnovations.com
  • 20.
    Virtualization-Aware Automatic Root-CauseDiagnosis © eG Innovations, Inc | www.eginnovations.com Automatic End-to-End Correlation Automatic Top-to-Bottom Correlation
  • 21.
    Virtualization-Aware Root-Cause Diagnosis Without root-cause diagnosis, you have no idea where the problem lies With root-cause diagnosis, you have a clear idea of what to do to resolve the problem. © eG Innovations, Inc | www.eginnovations.com All the problems appear to be equally important. The root-cause of the problem The effects of the problem
  • 22.
    The ROI ofeG Enterprise © eG Innovations, Inc | www.eginnovations.com • Reduce downtime • Increase application availability • Boost user experience Boost User Satisfaction & Productivity • Simplify, automate & accelerate diagnosis & troubleshooting • Optimize staffing levels & reduce OPEX Reduce IT Support Cost & Complexity • Increase hardware utilization • Leverage investment in software • Right-size & optimize environment Reduce Infrastructure Cost & Avoid Cost Overruns • Accelerate deployments & rollout • Reduce risk, deliver successful projects & peace of mind Deliver Projects on Time, on Budget, on Target
  • 23.
  • 24.
    Next Steps Moredetails http://www.eginnovations.com/freetrial  Send an Email info@eginnovations.com  Call Us +1 (866) 526 6700 © eG Innovations, Inc | www.eginnovations.com

Editor's Notes

  • #9 Unmatched performance visibility & auto-correlation across all domains that impact user experience – from the desktop and applications to the virtualization layer and underlying infrastructure.