Download as PDF, PPTX

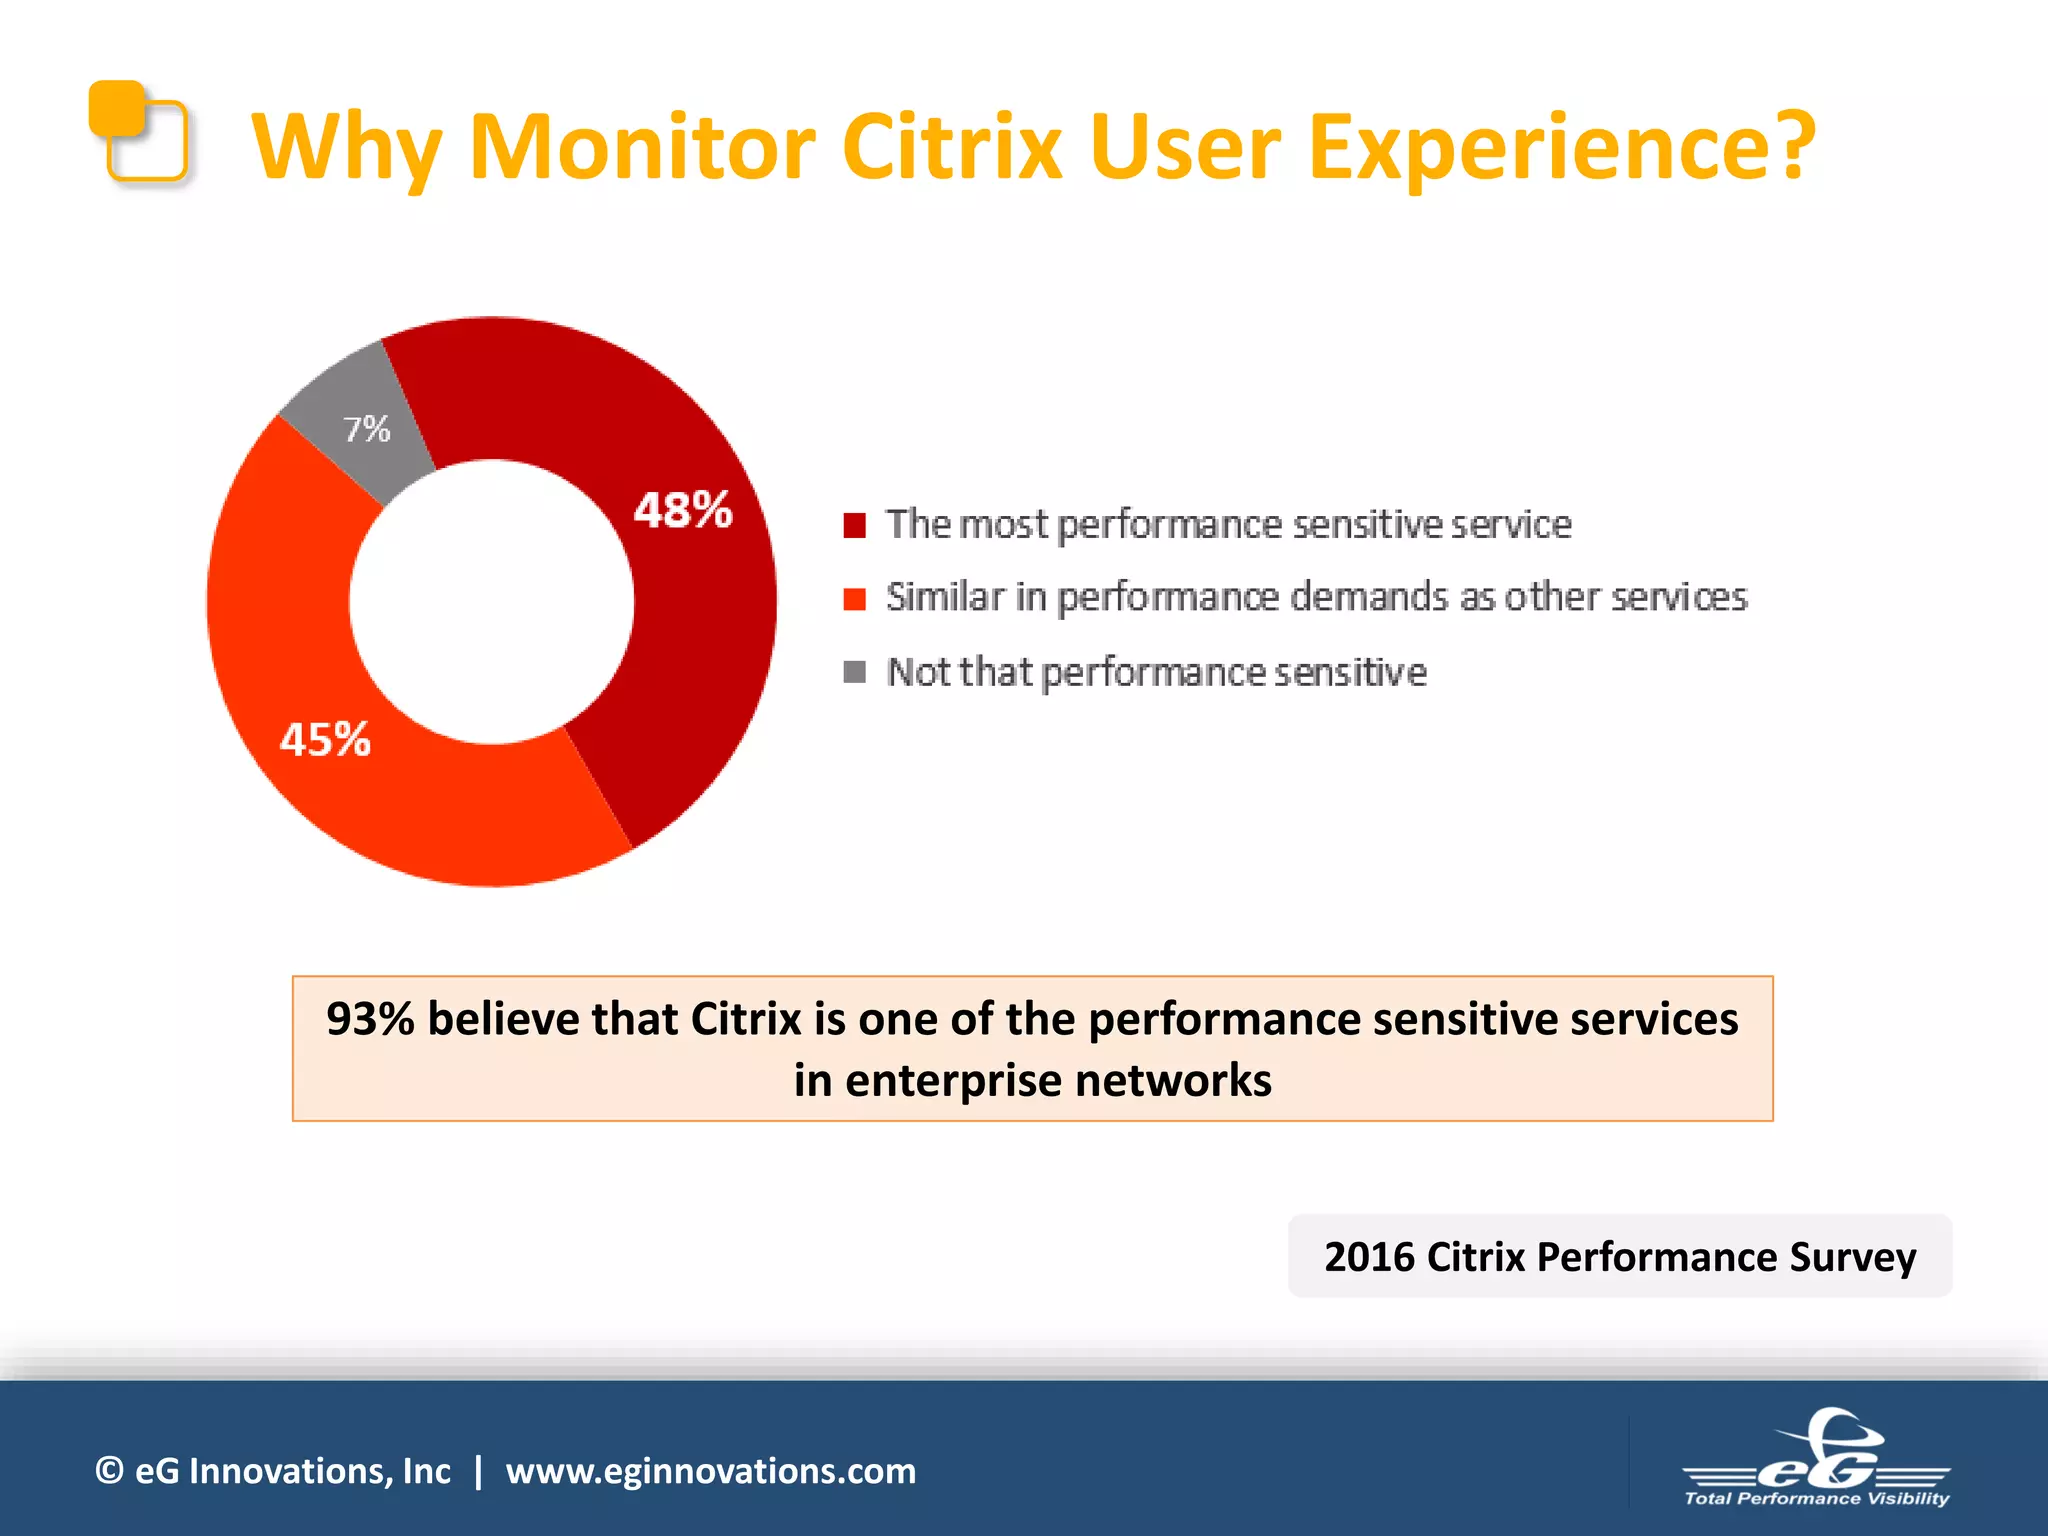
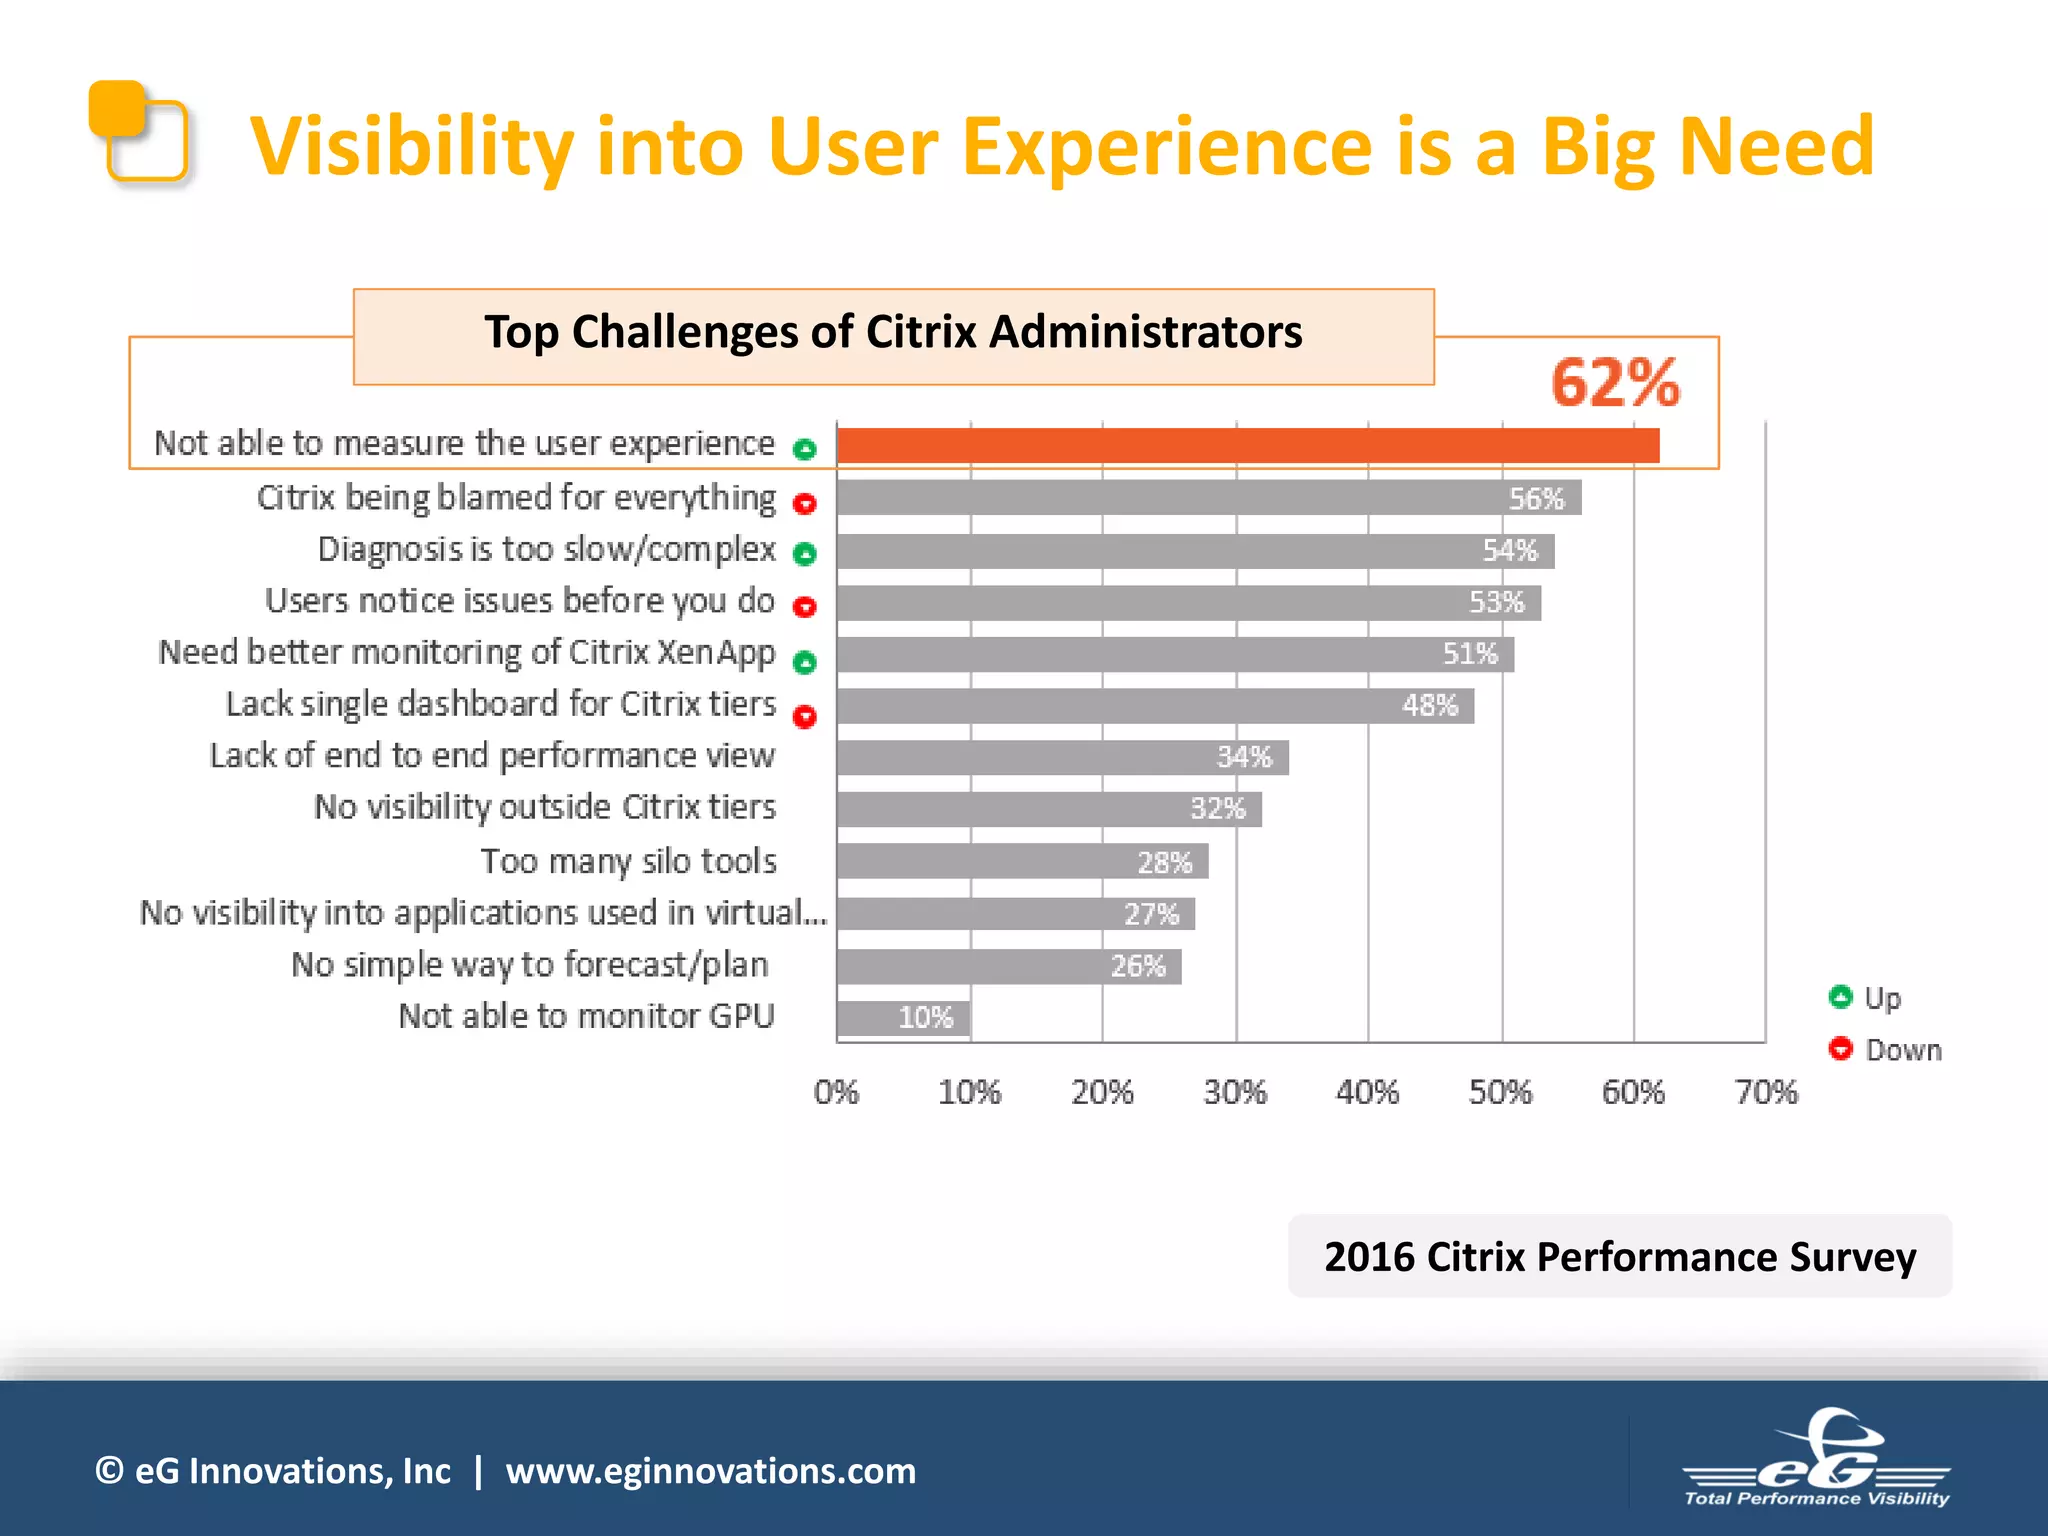
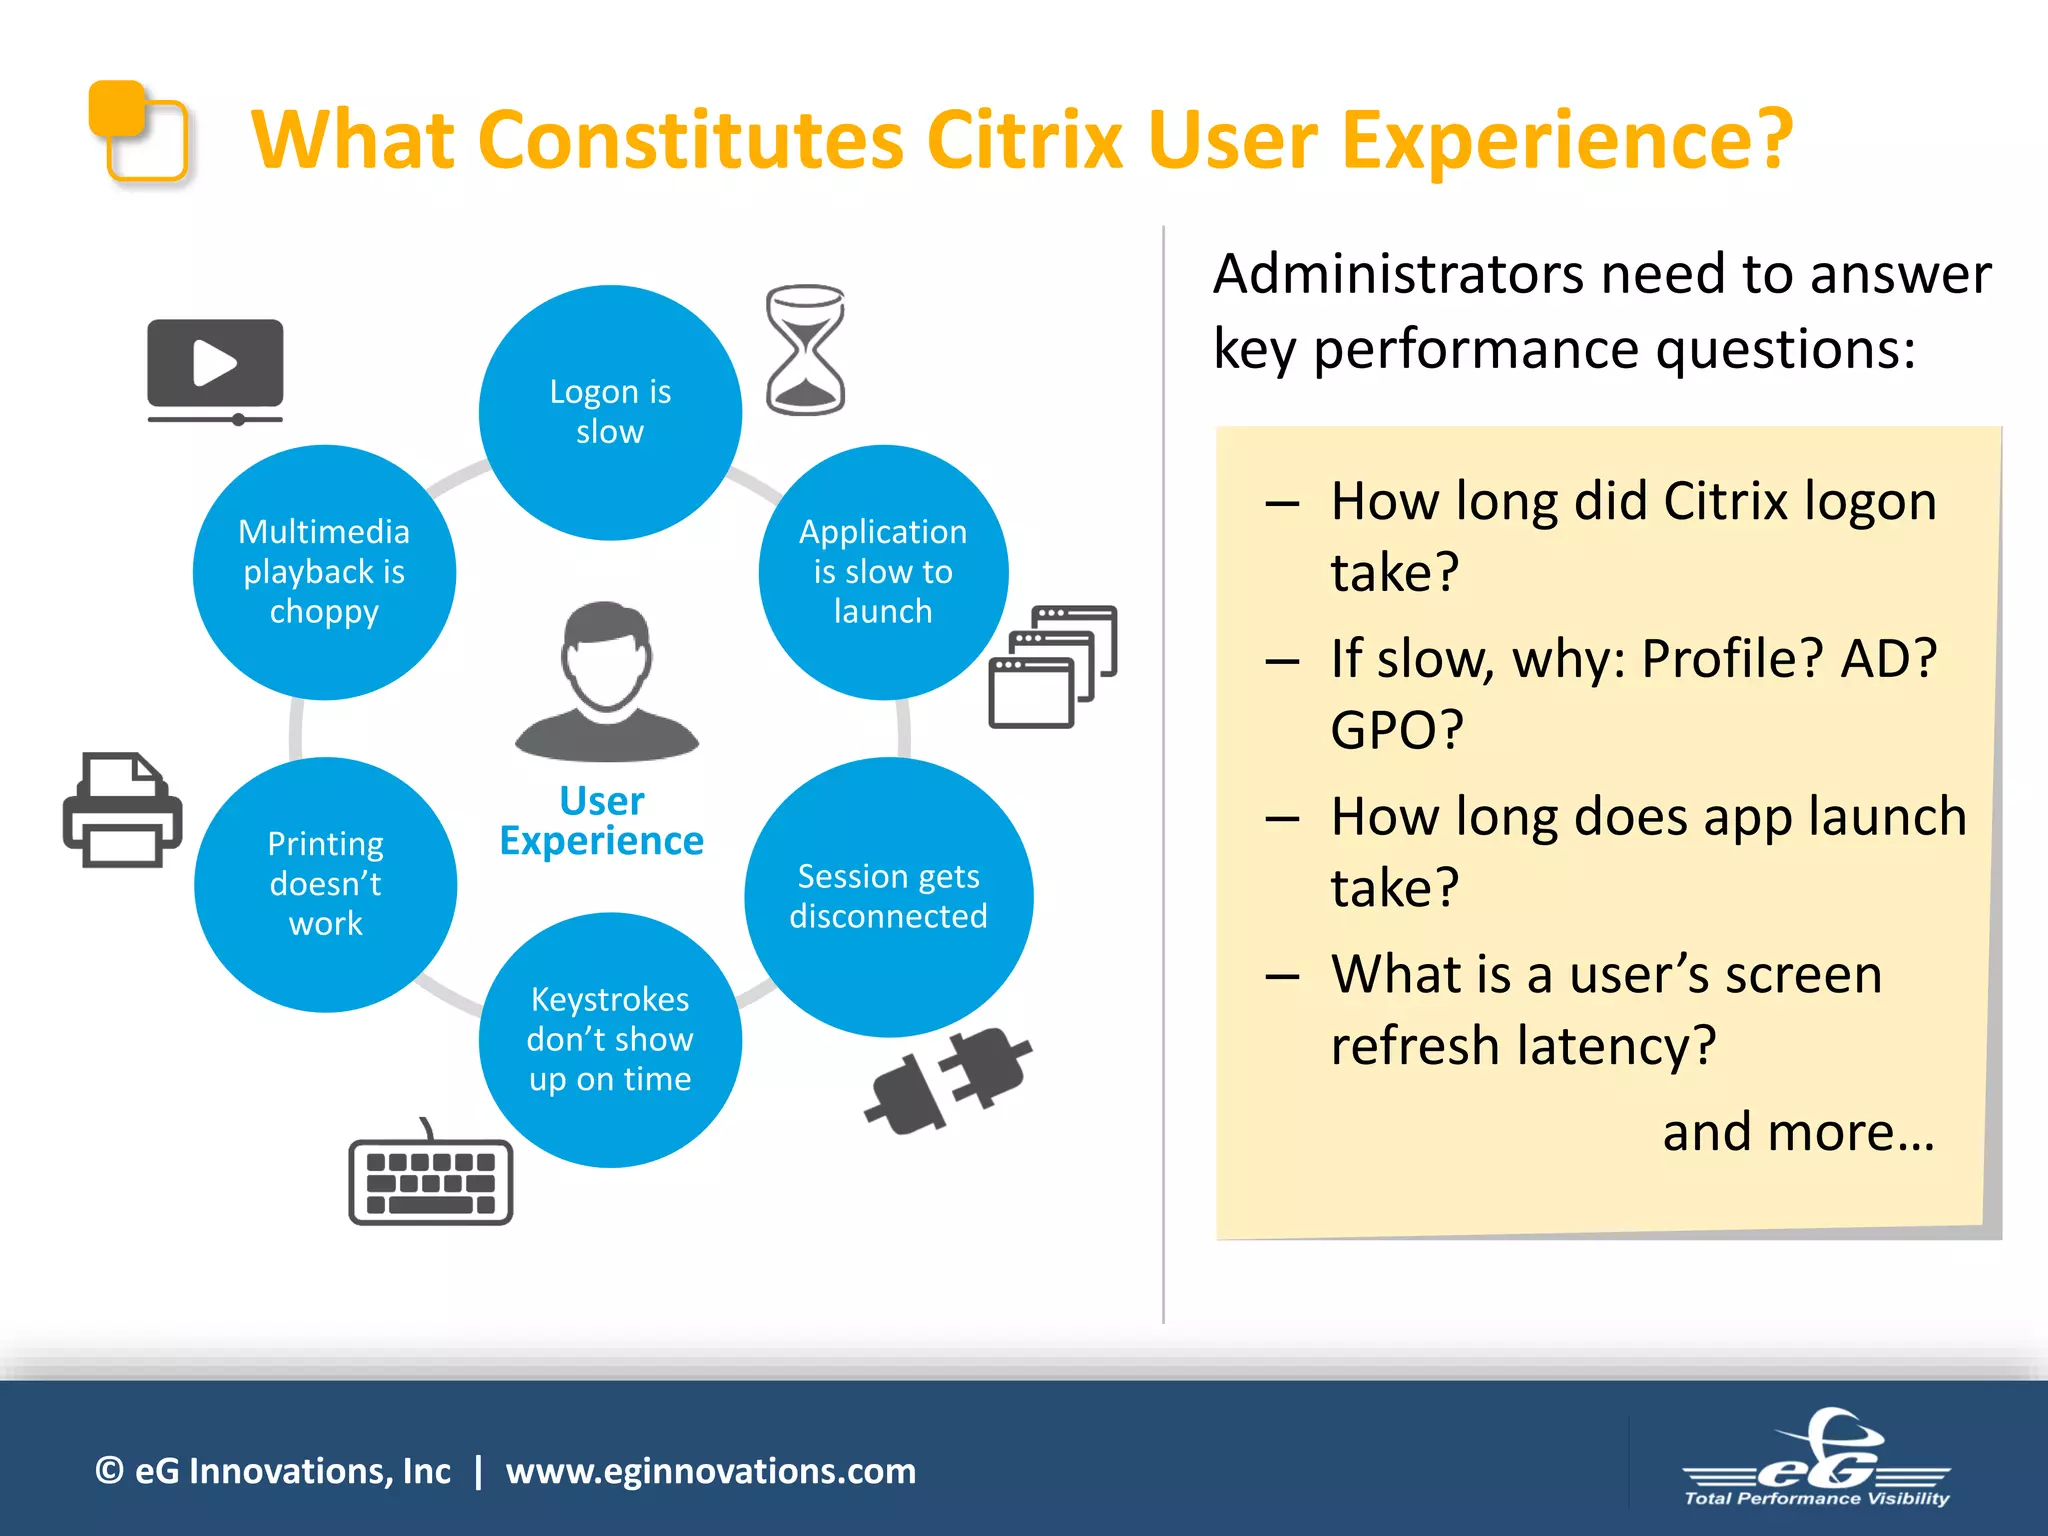
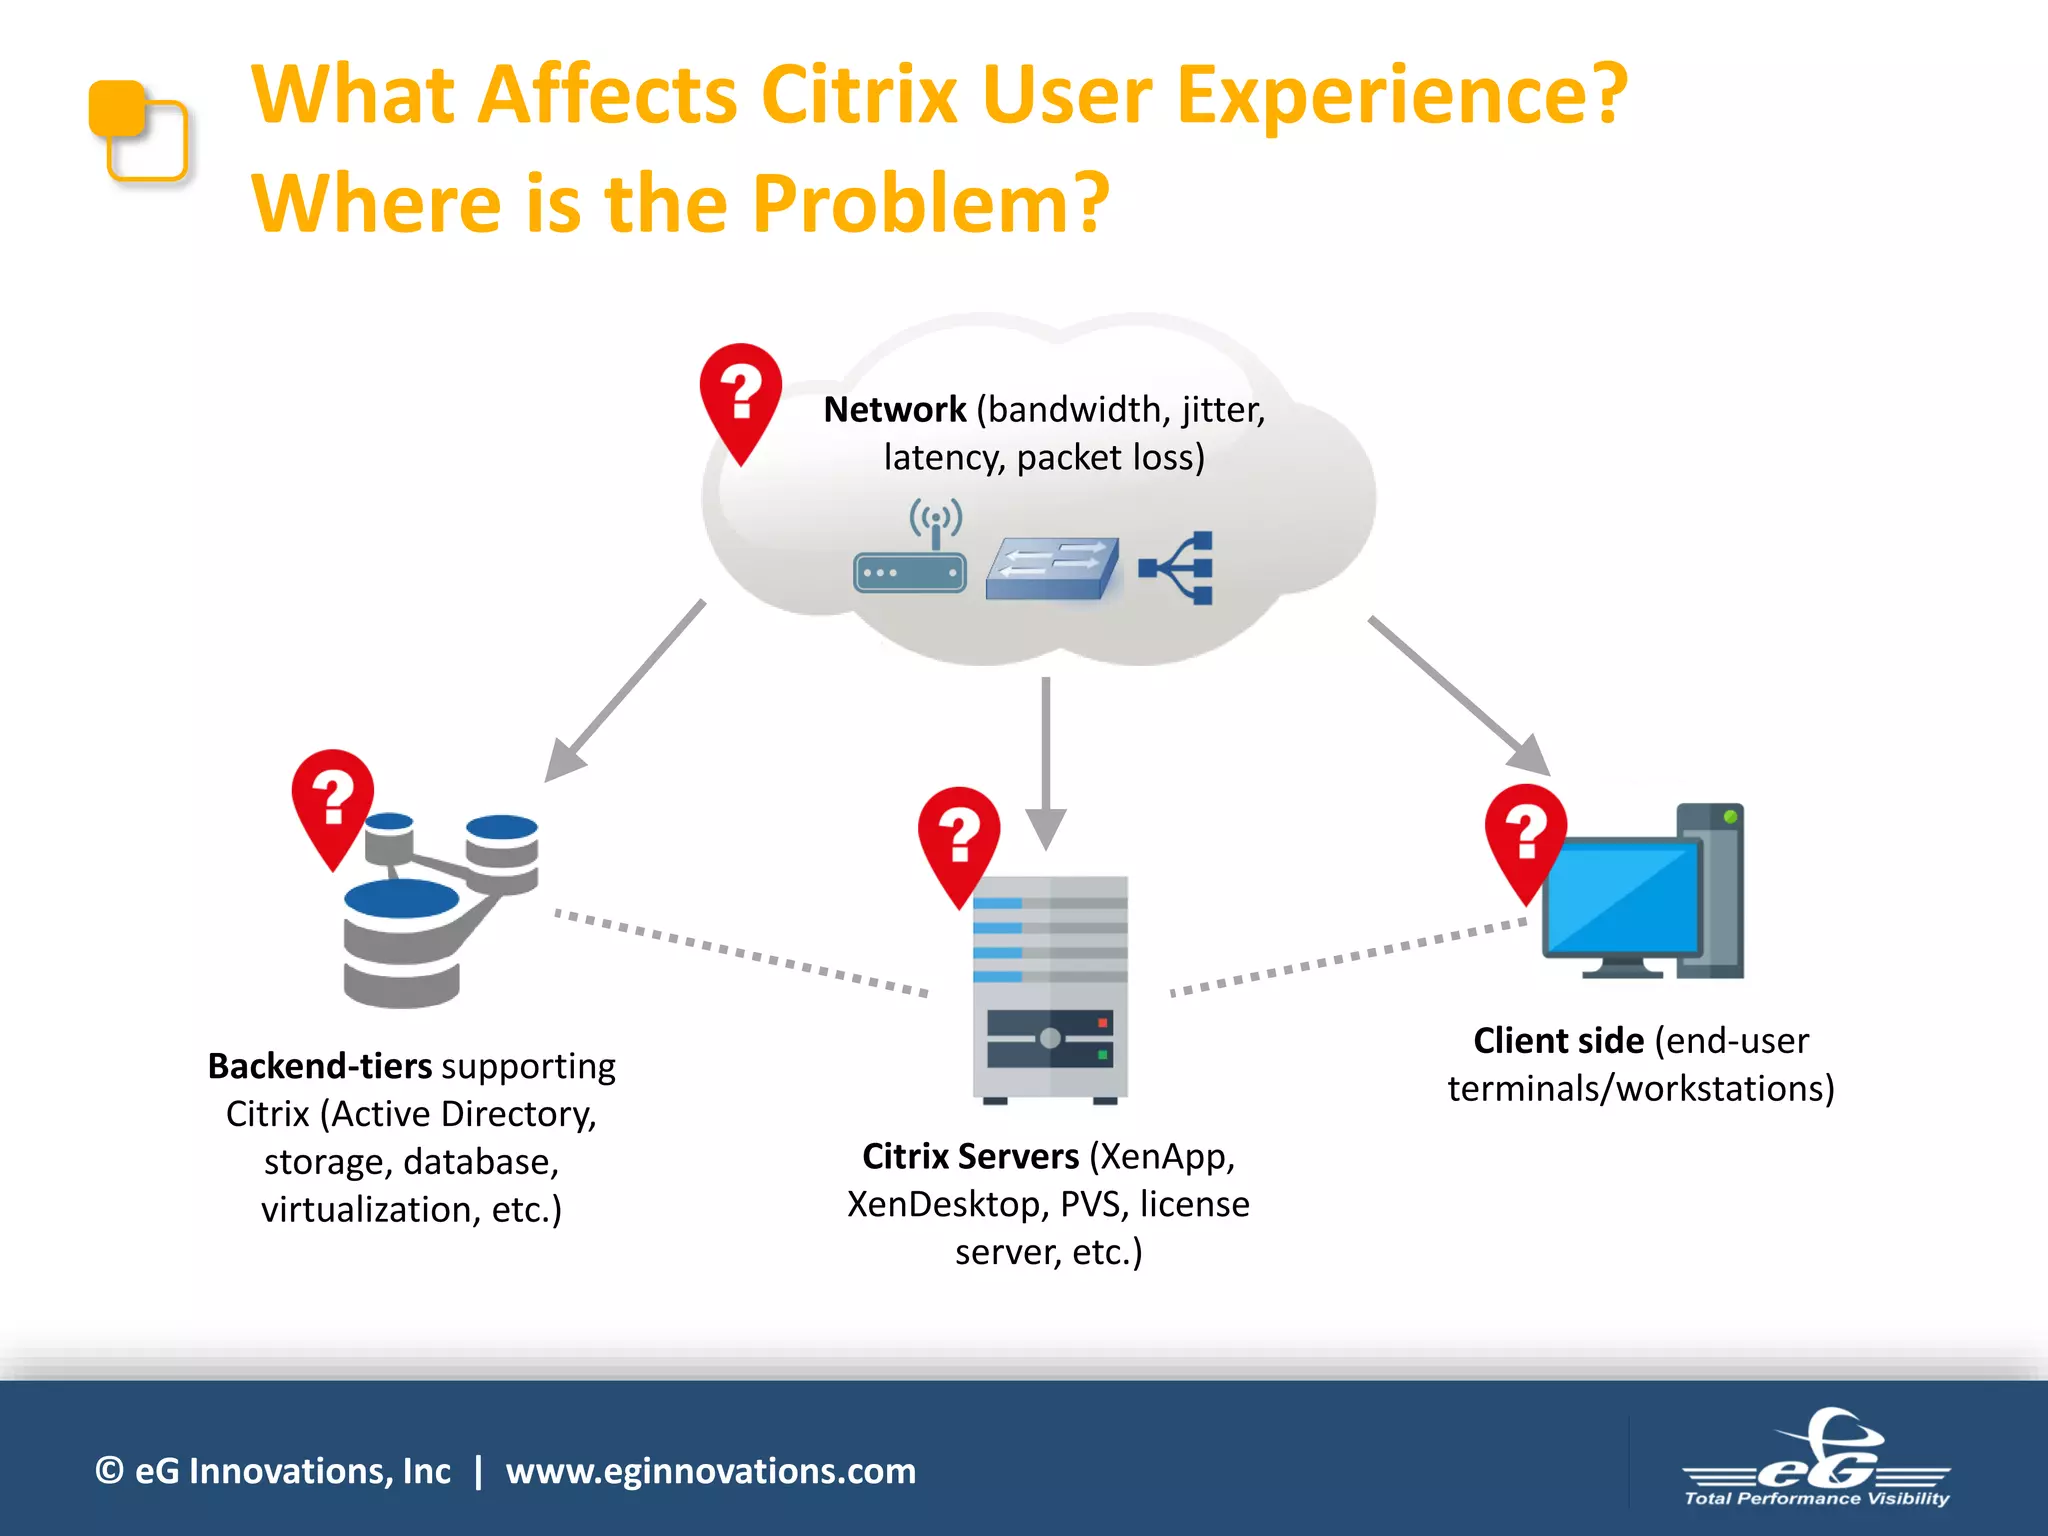
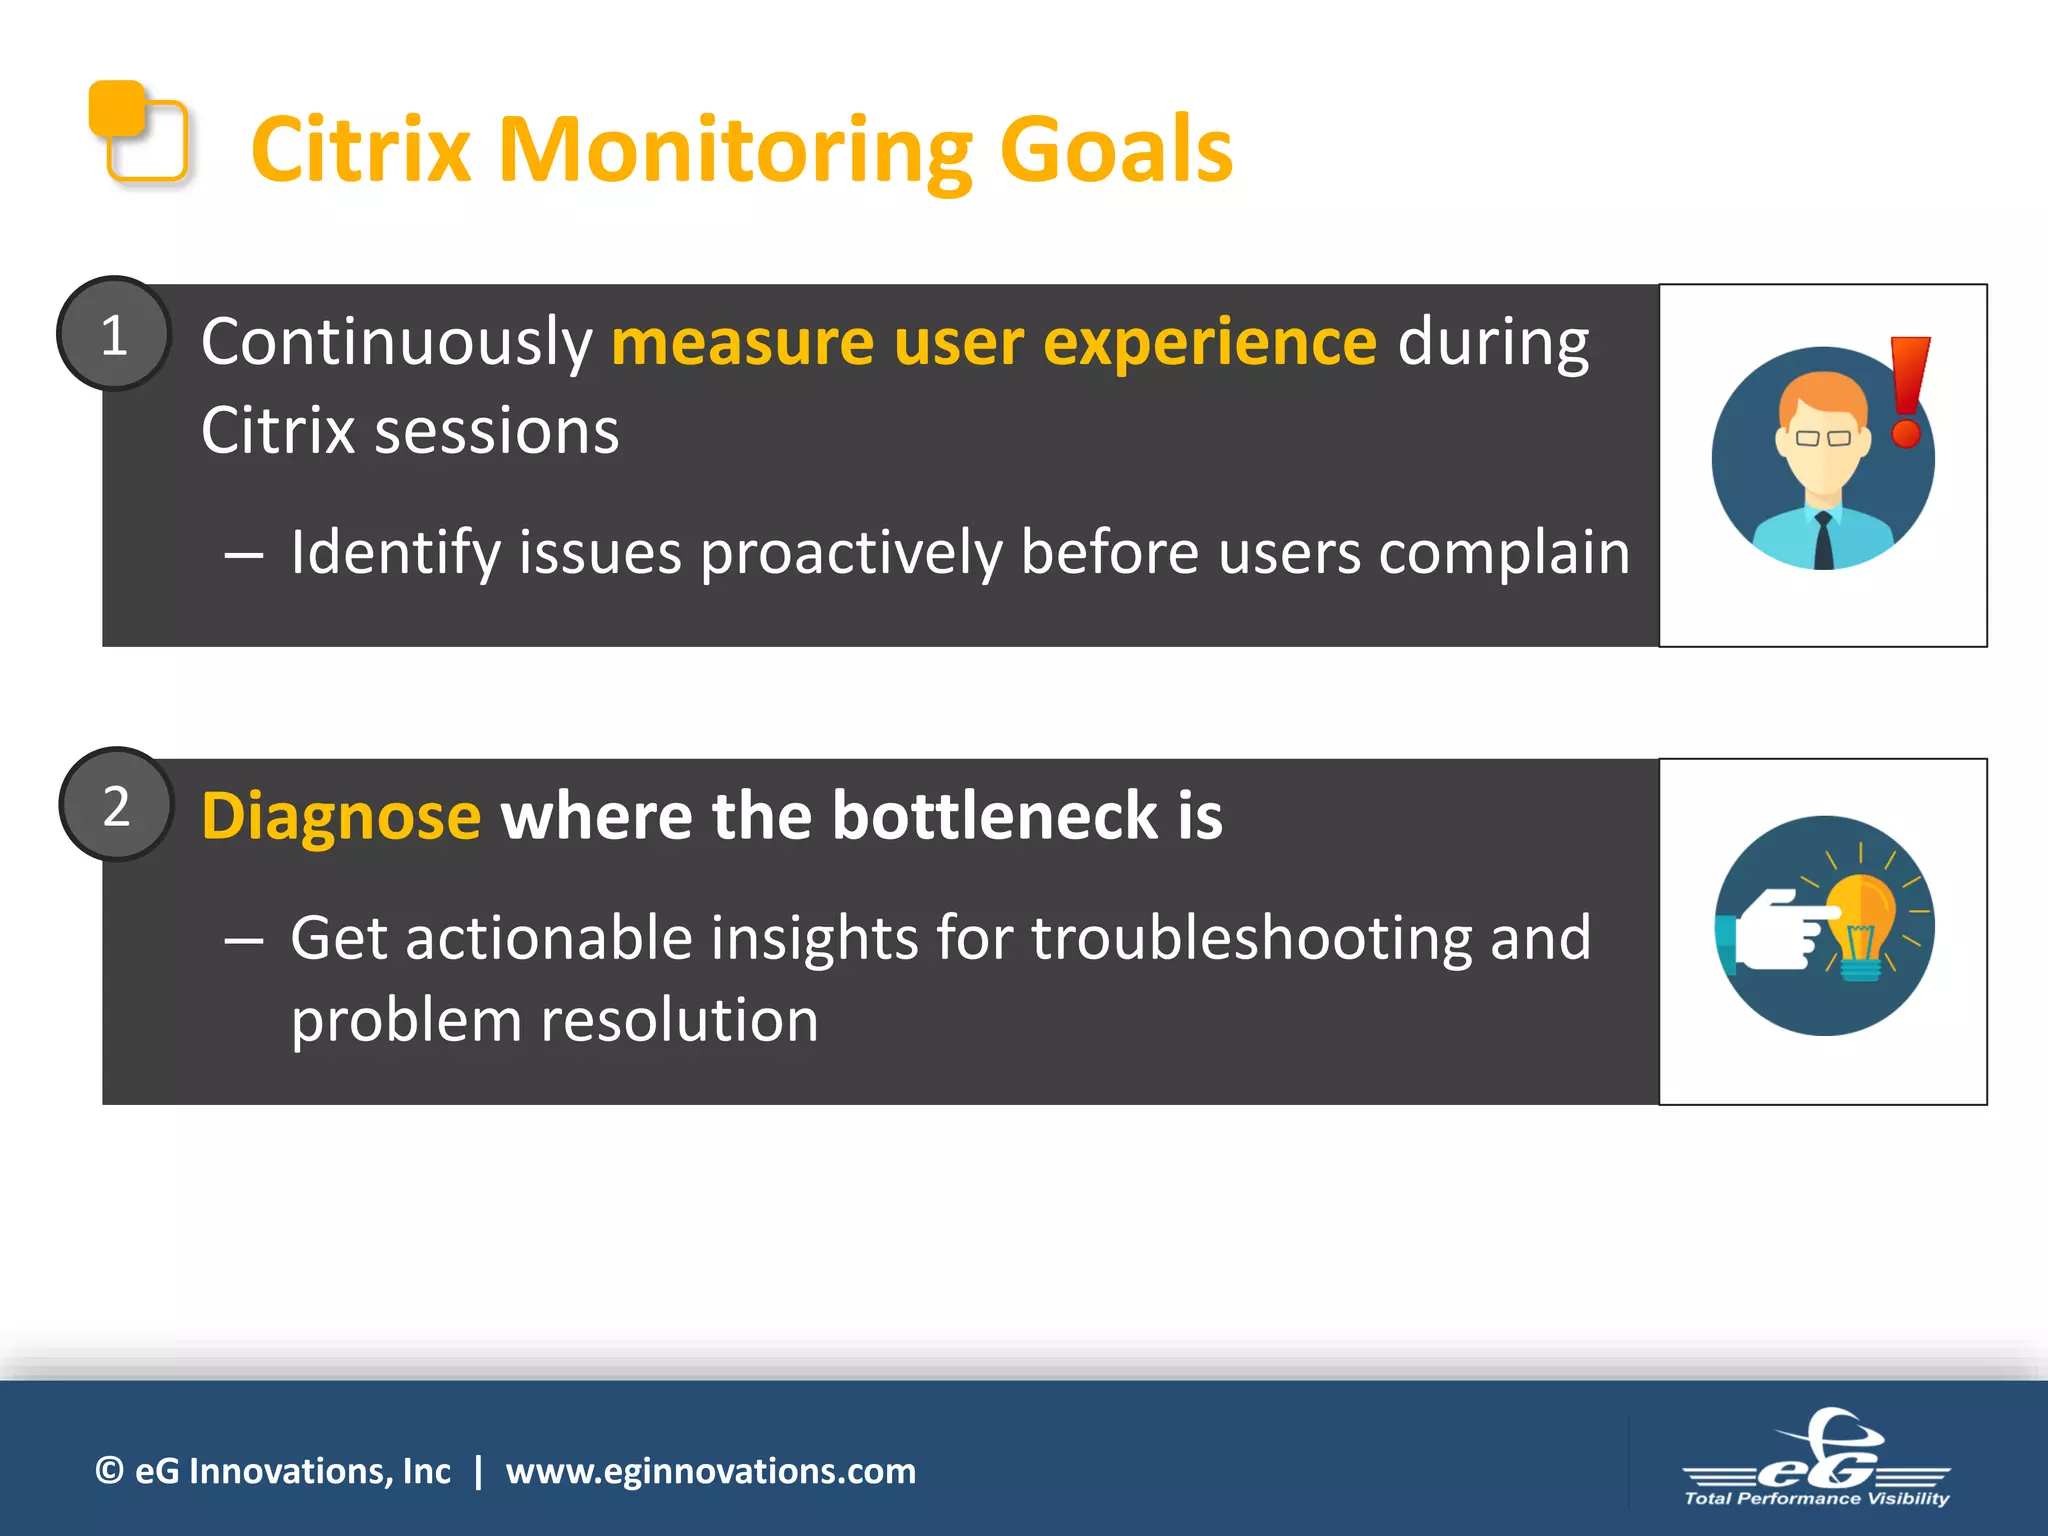
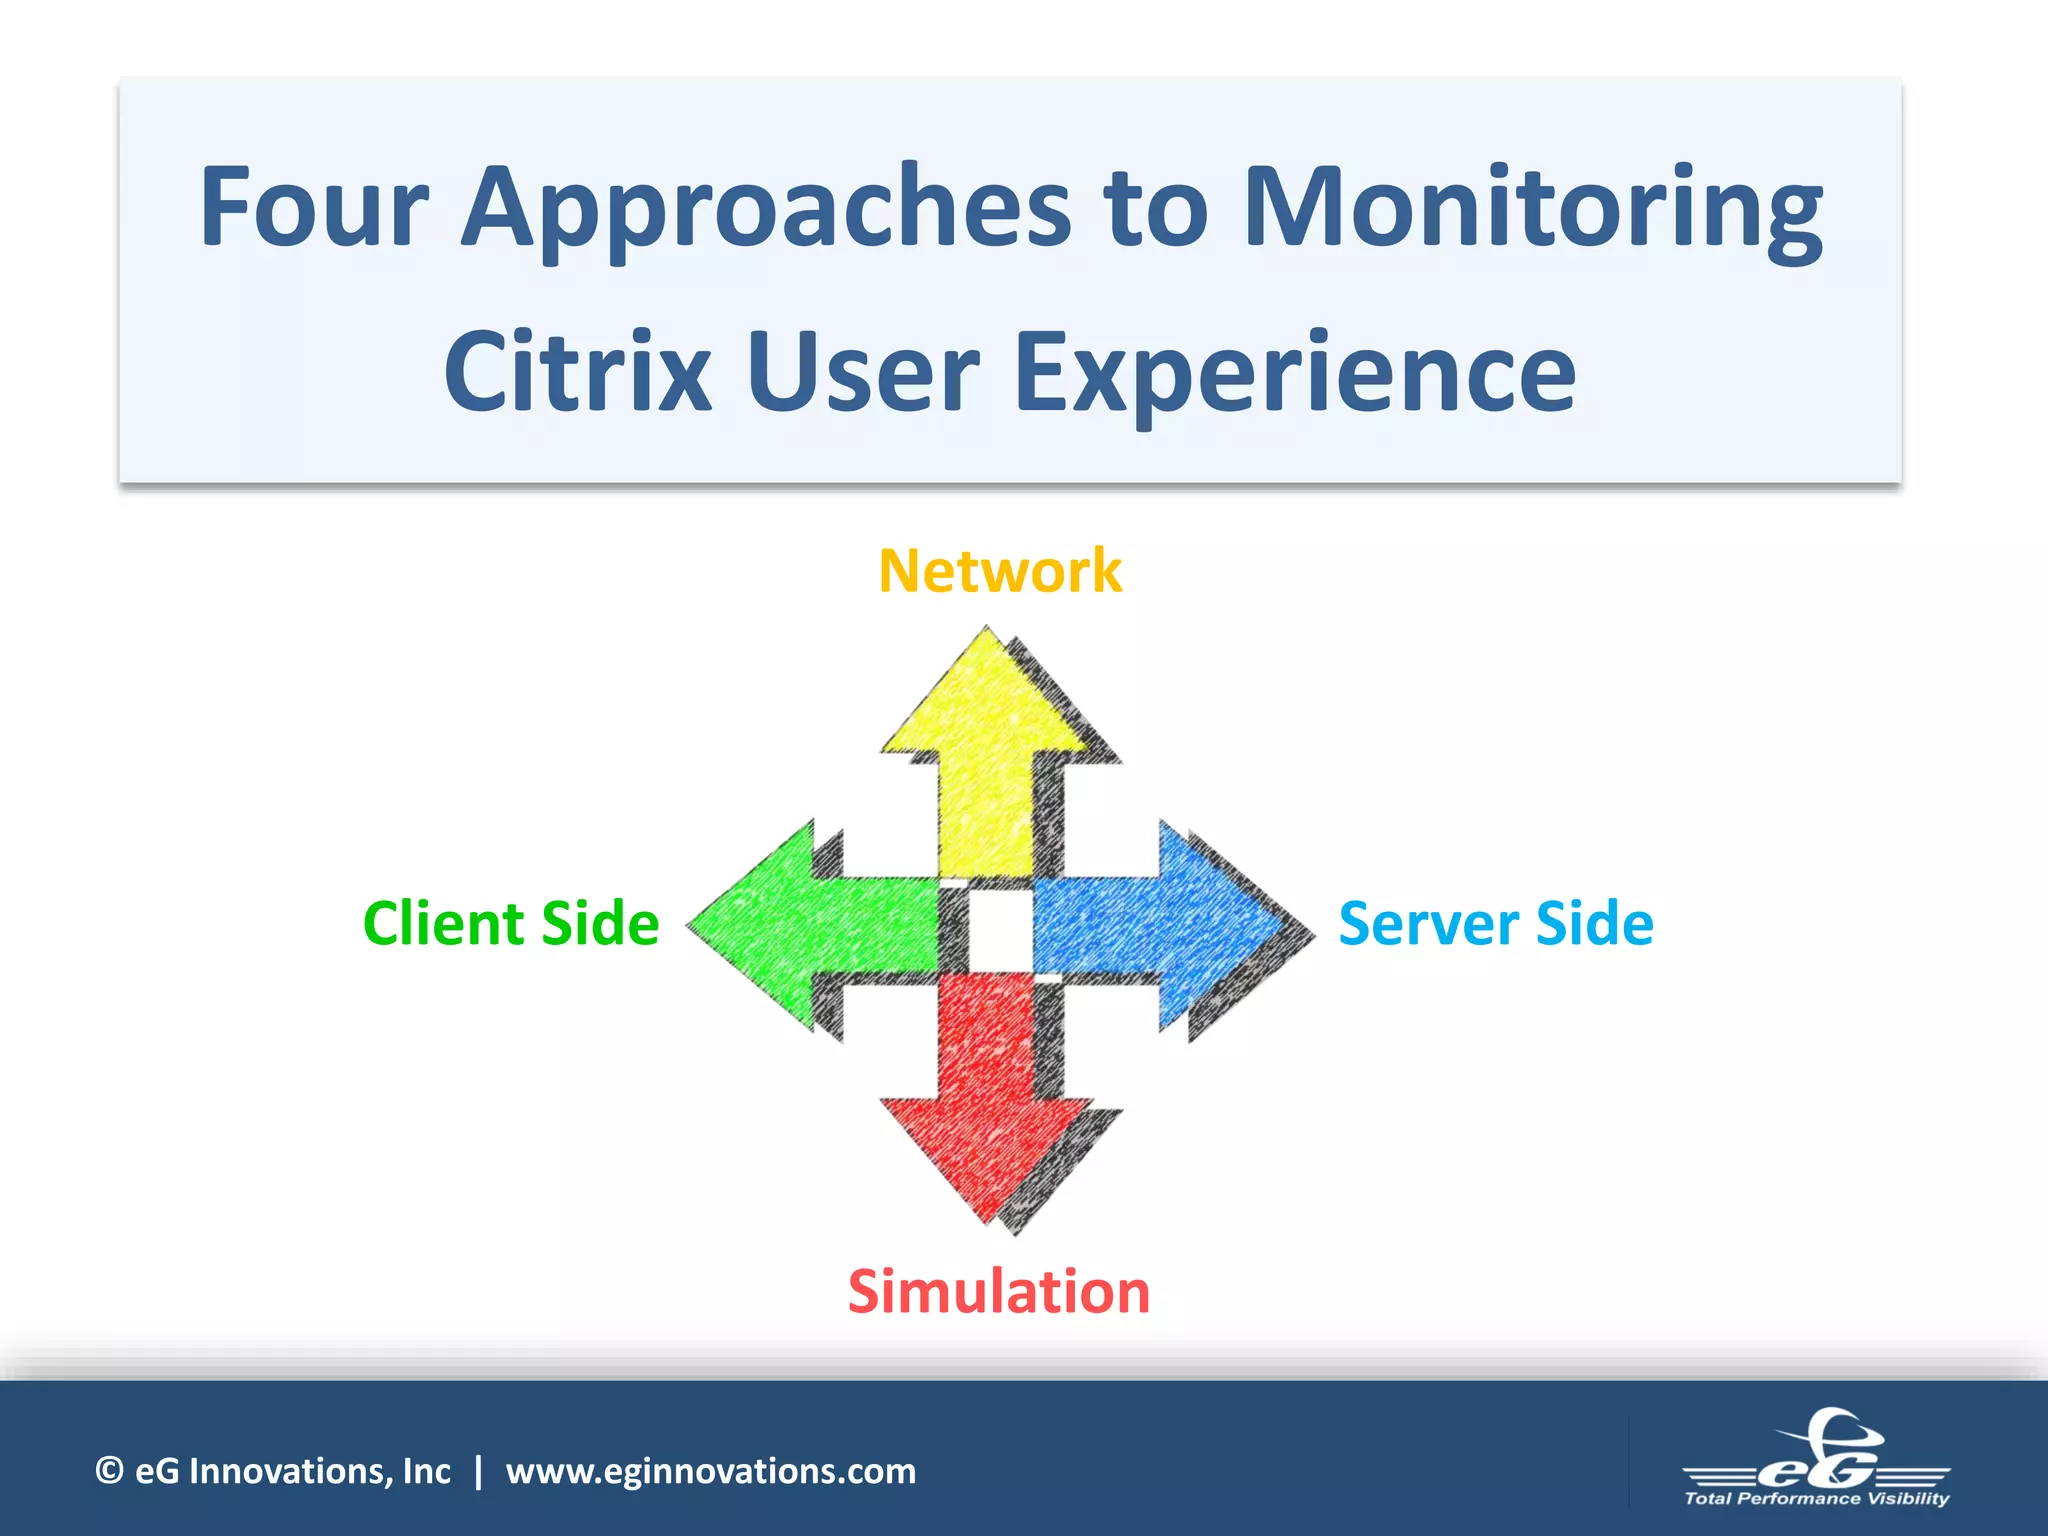
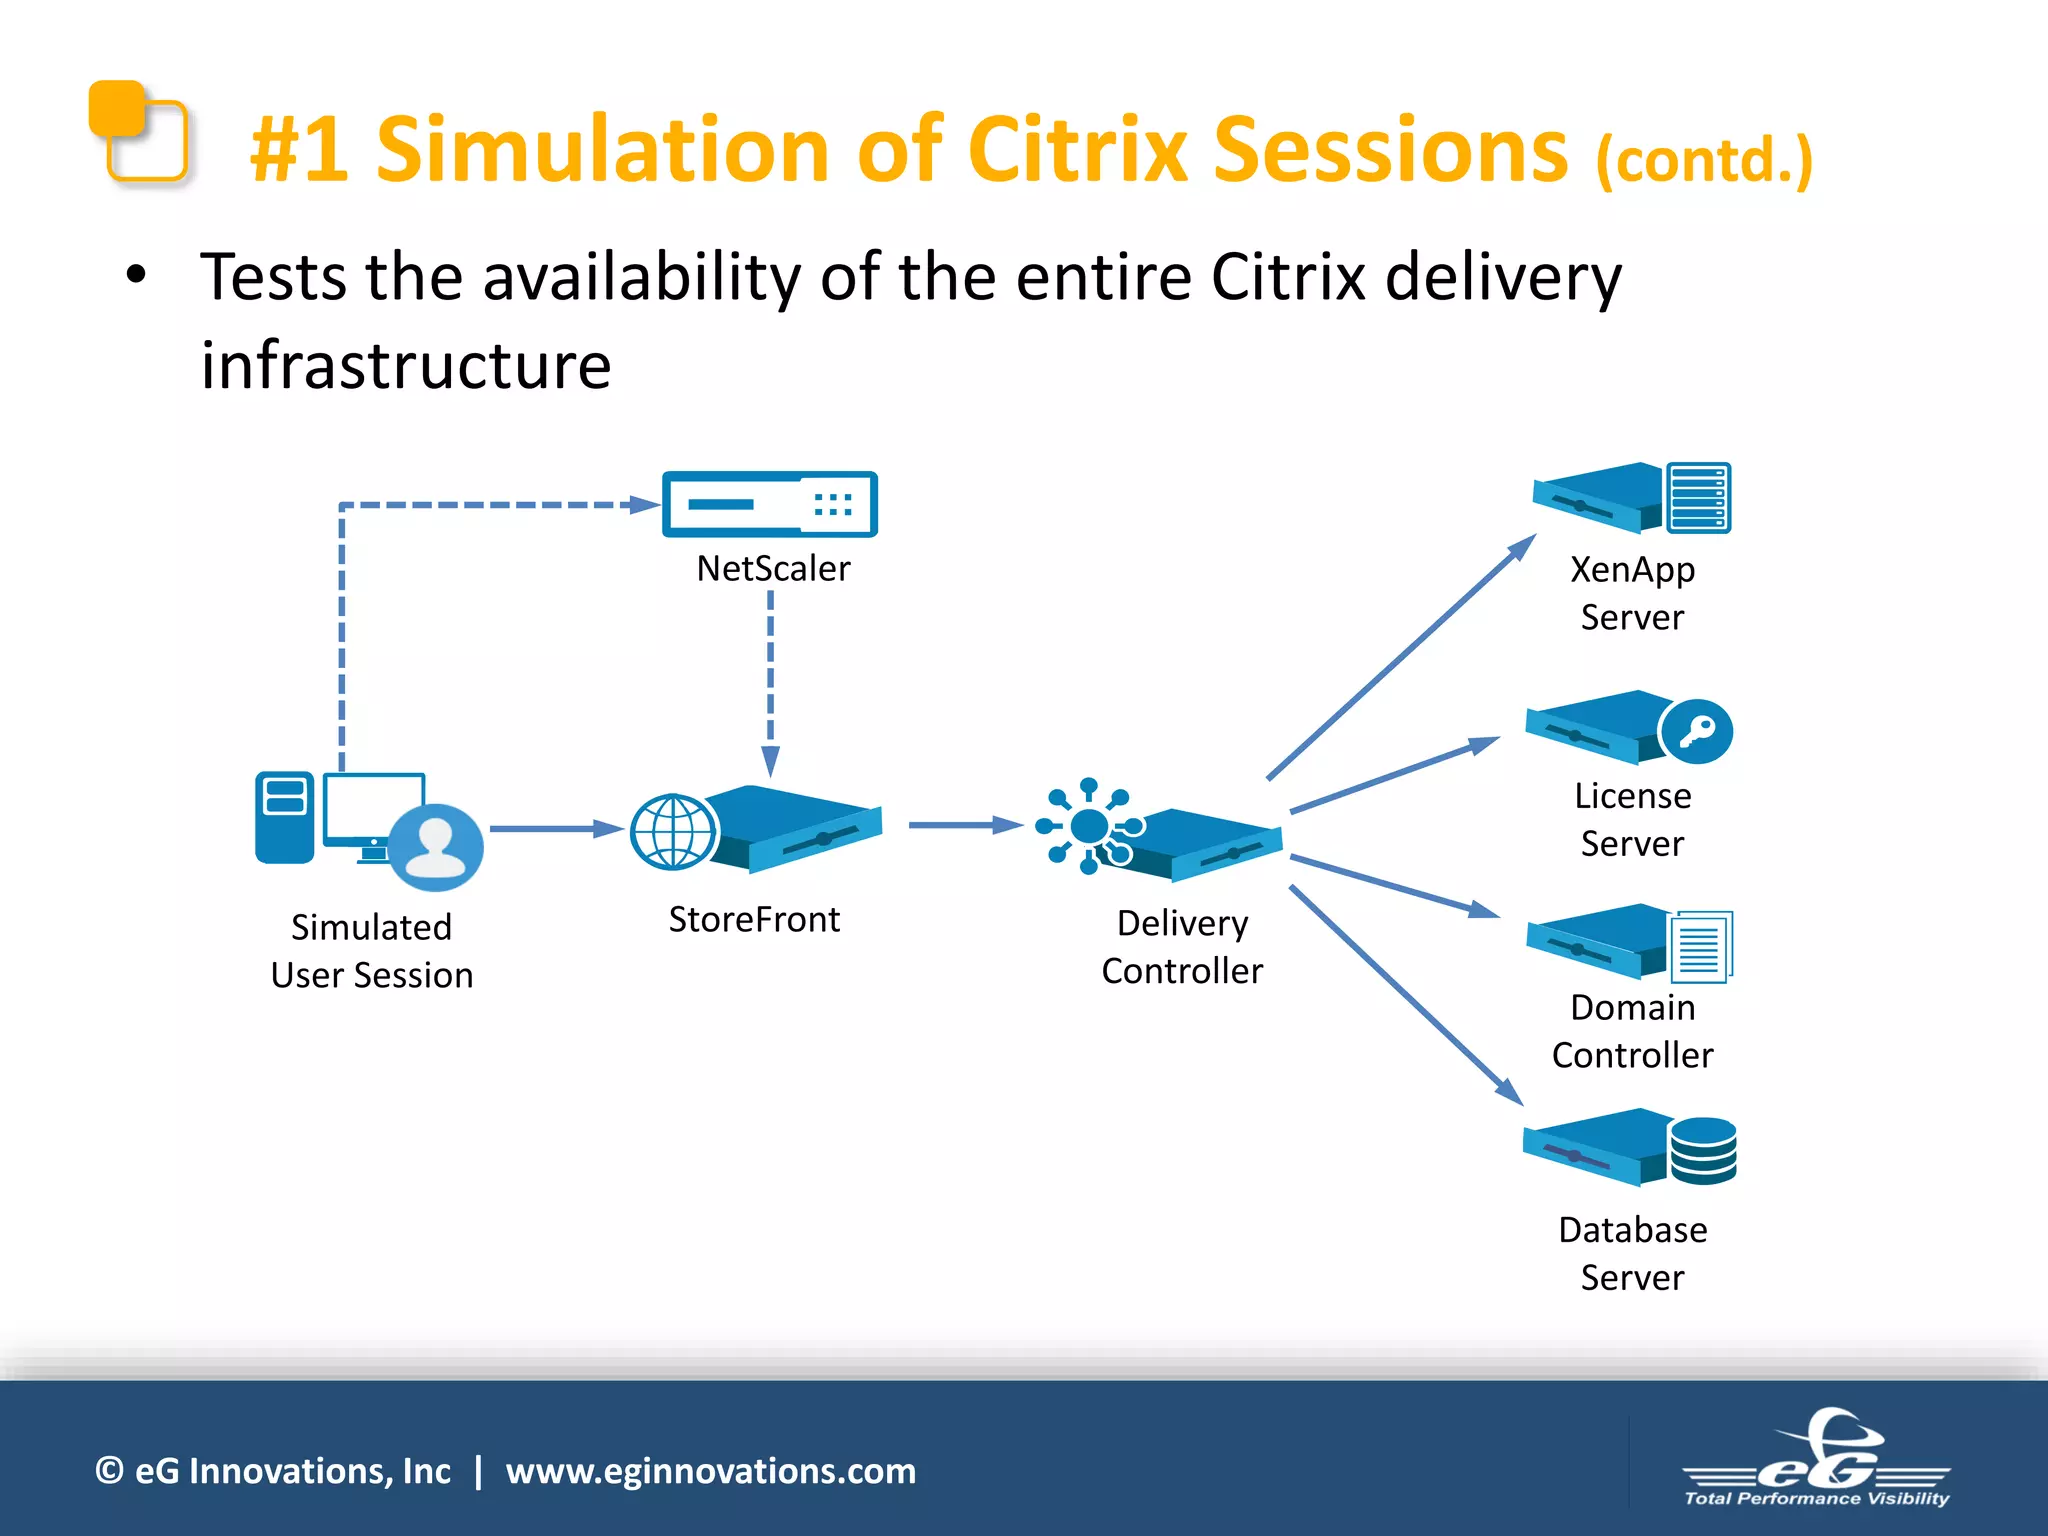
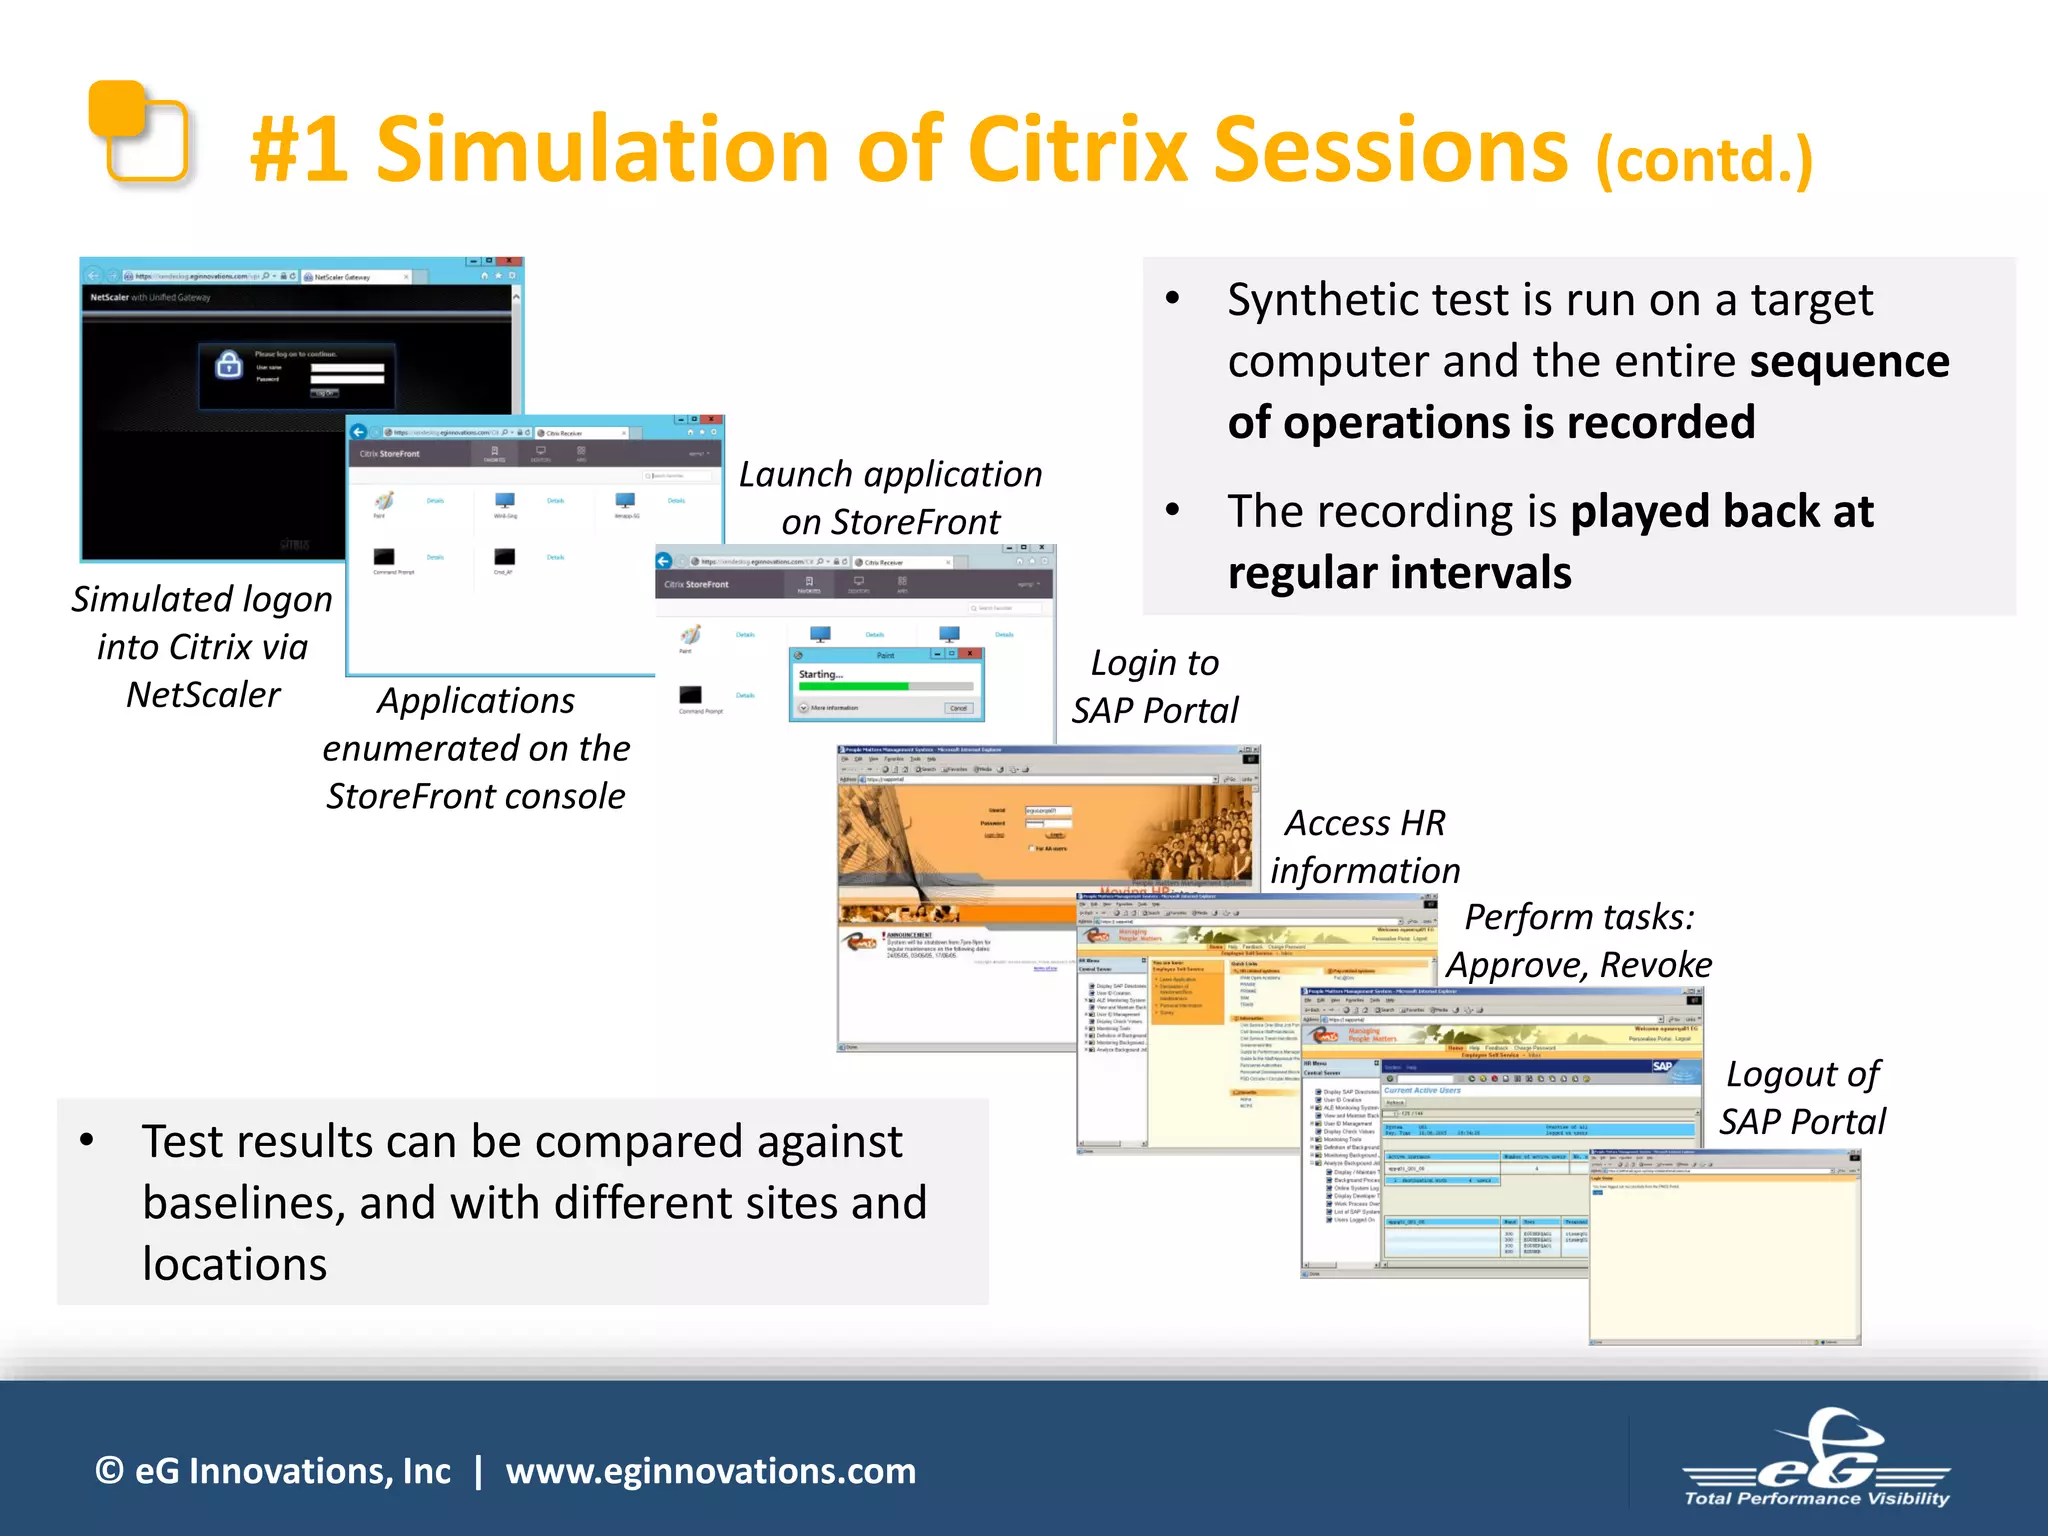
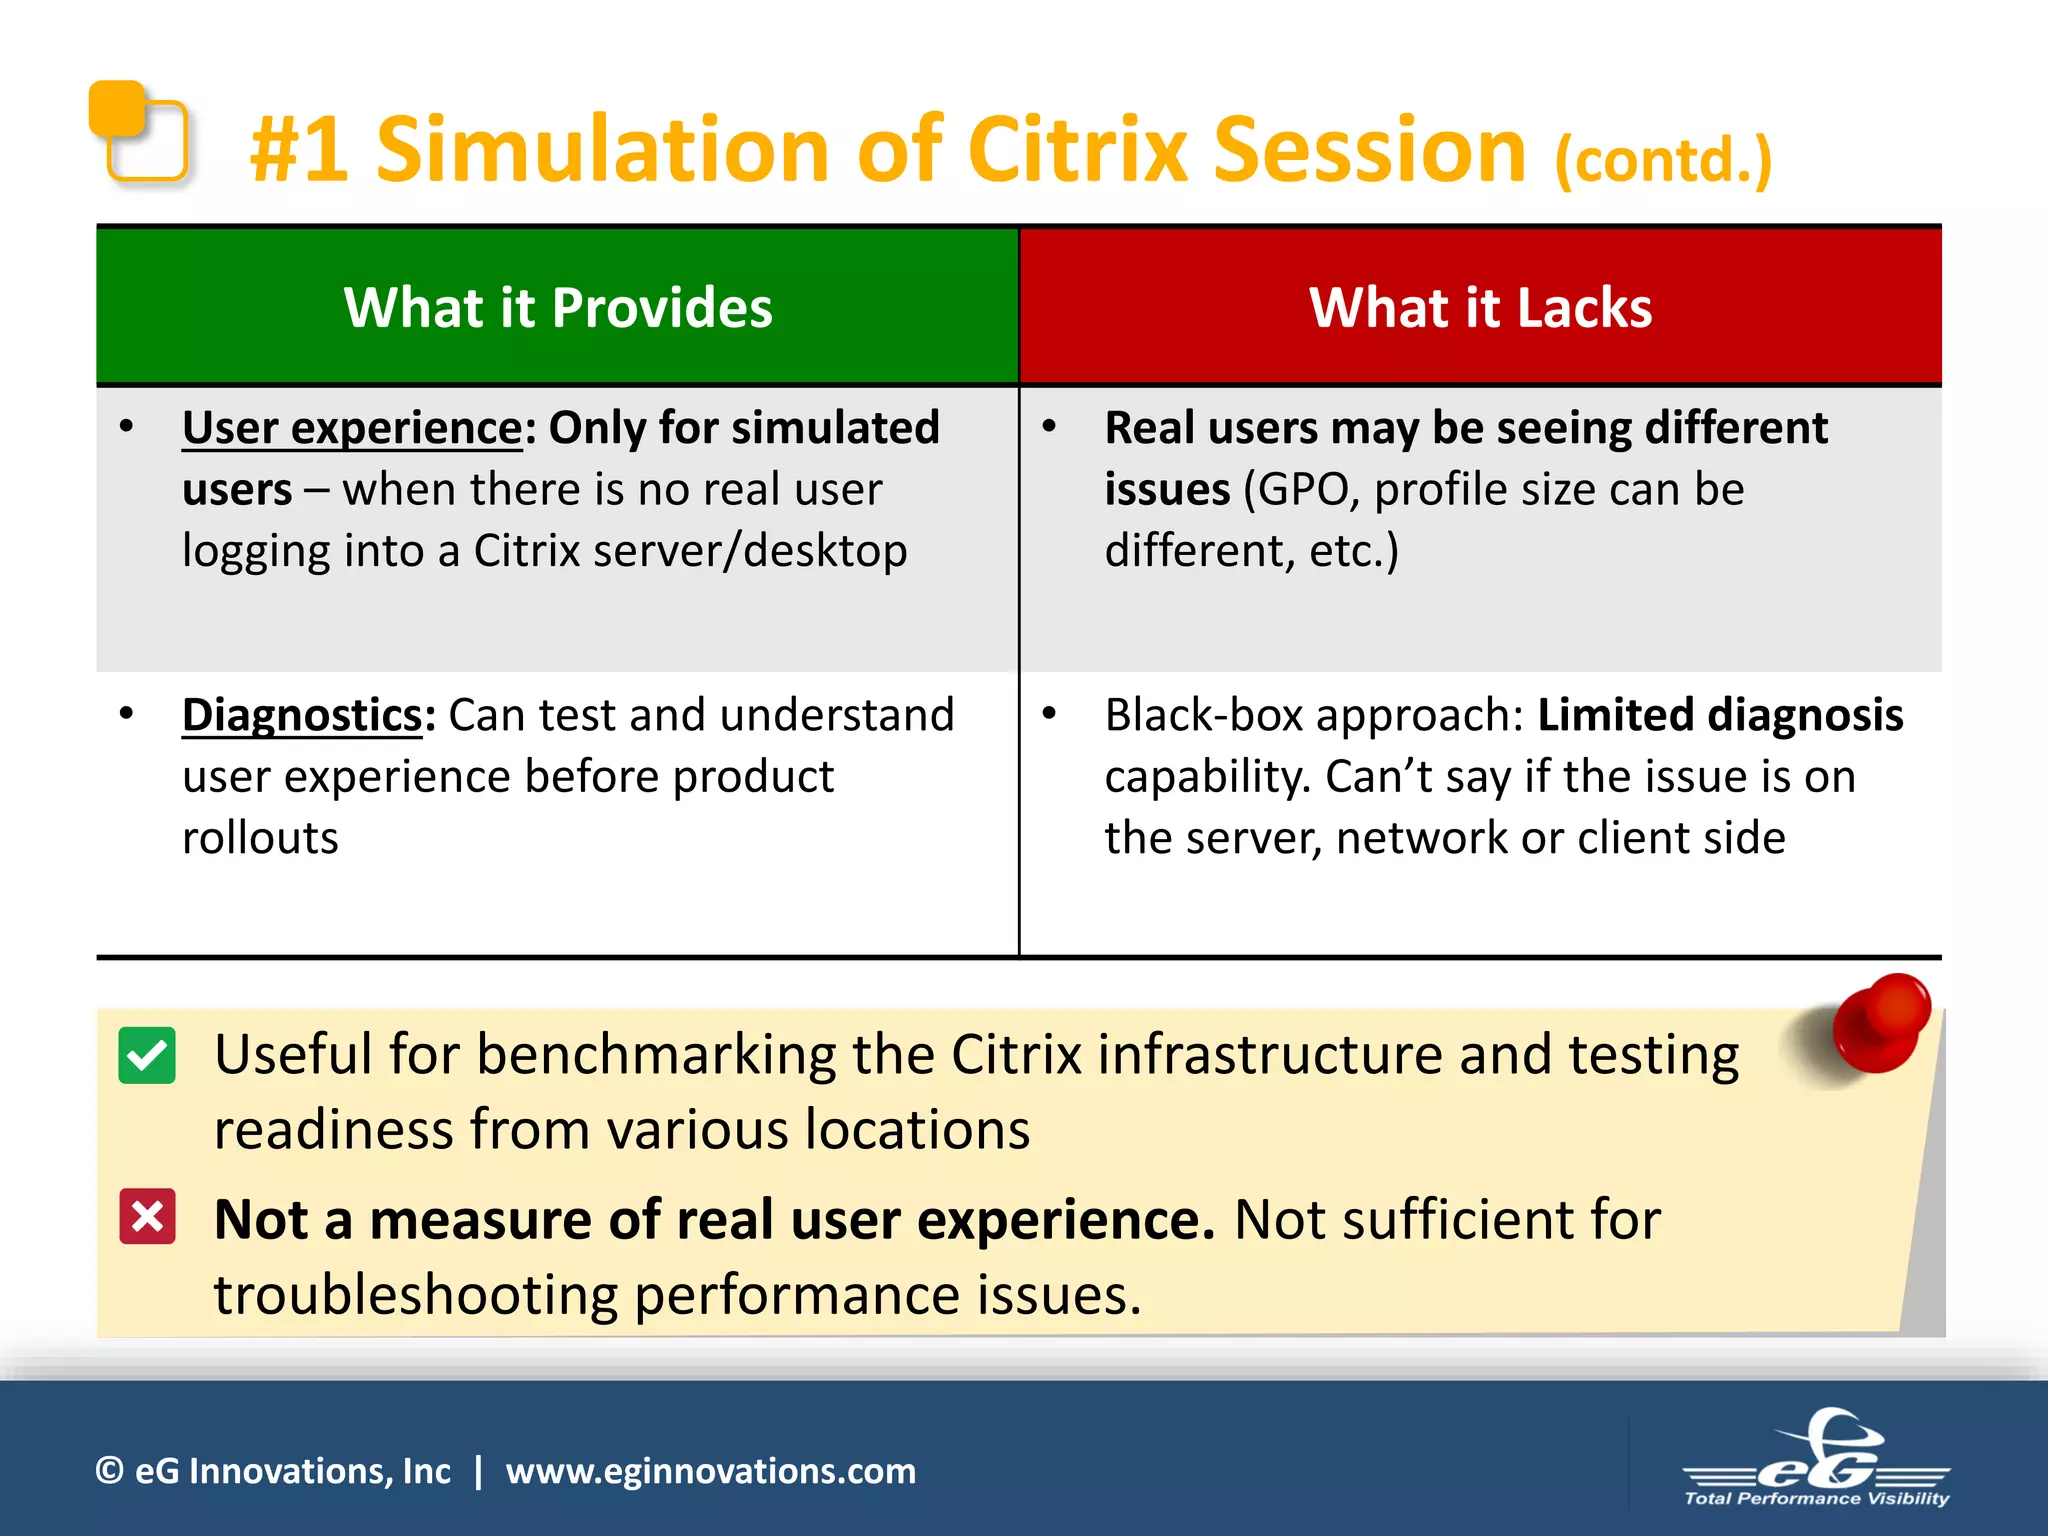
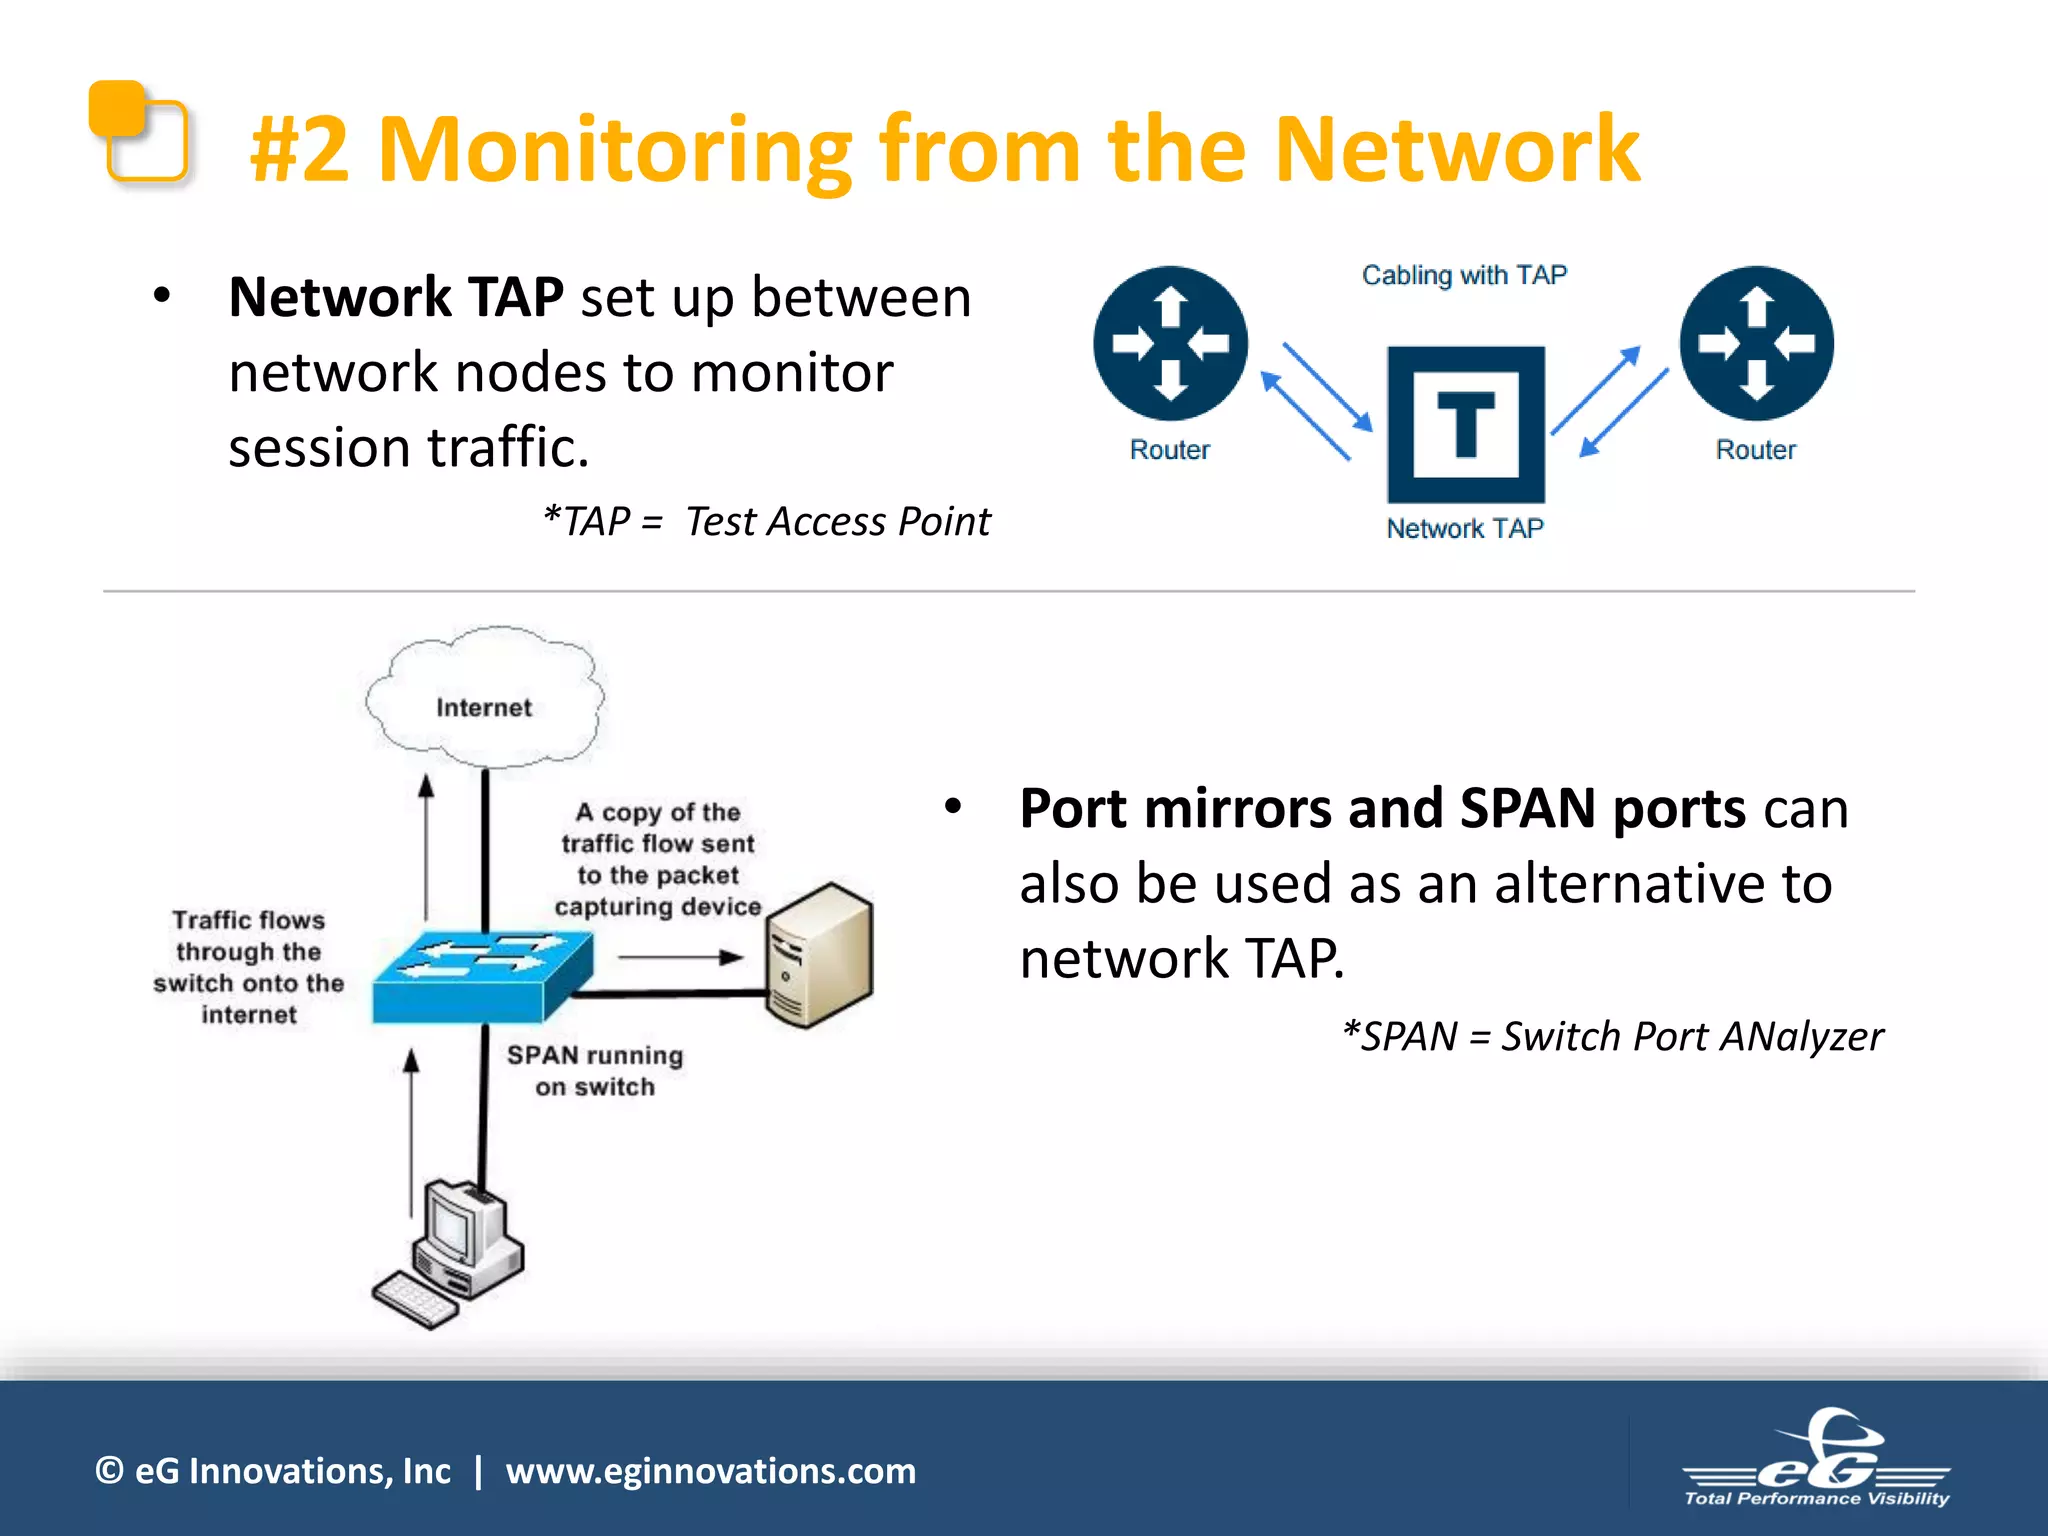
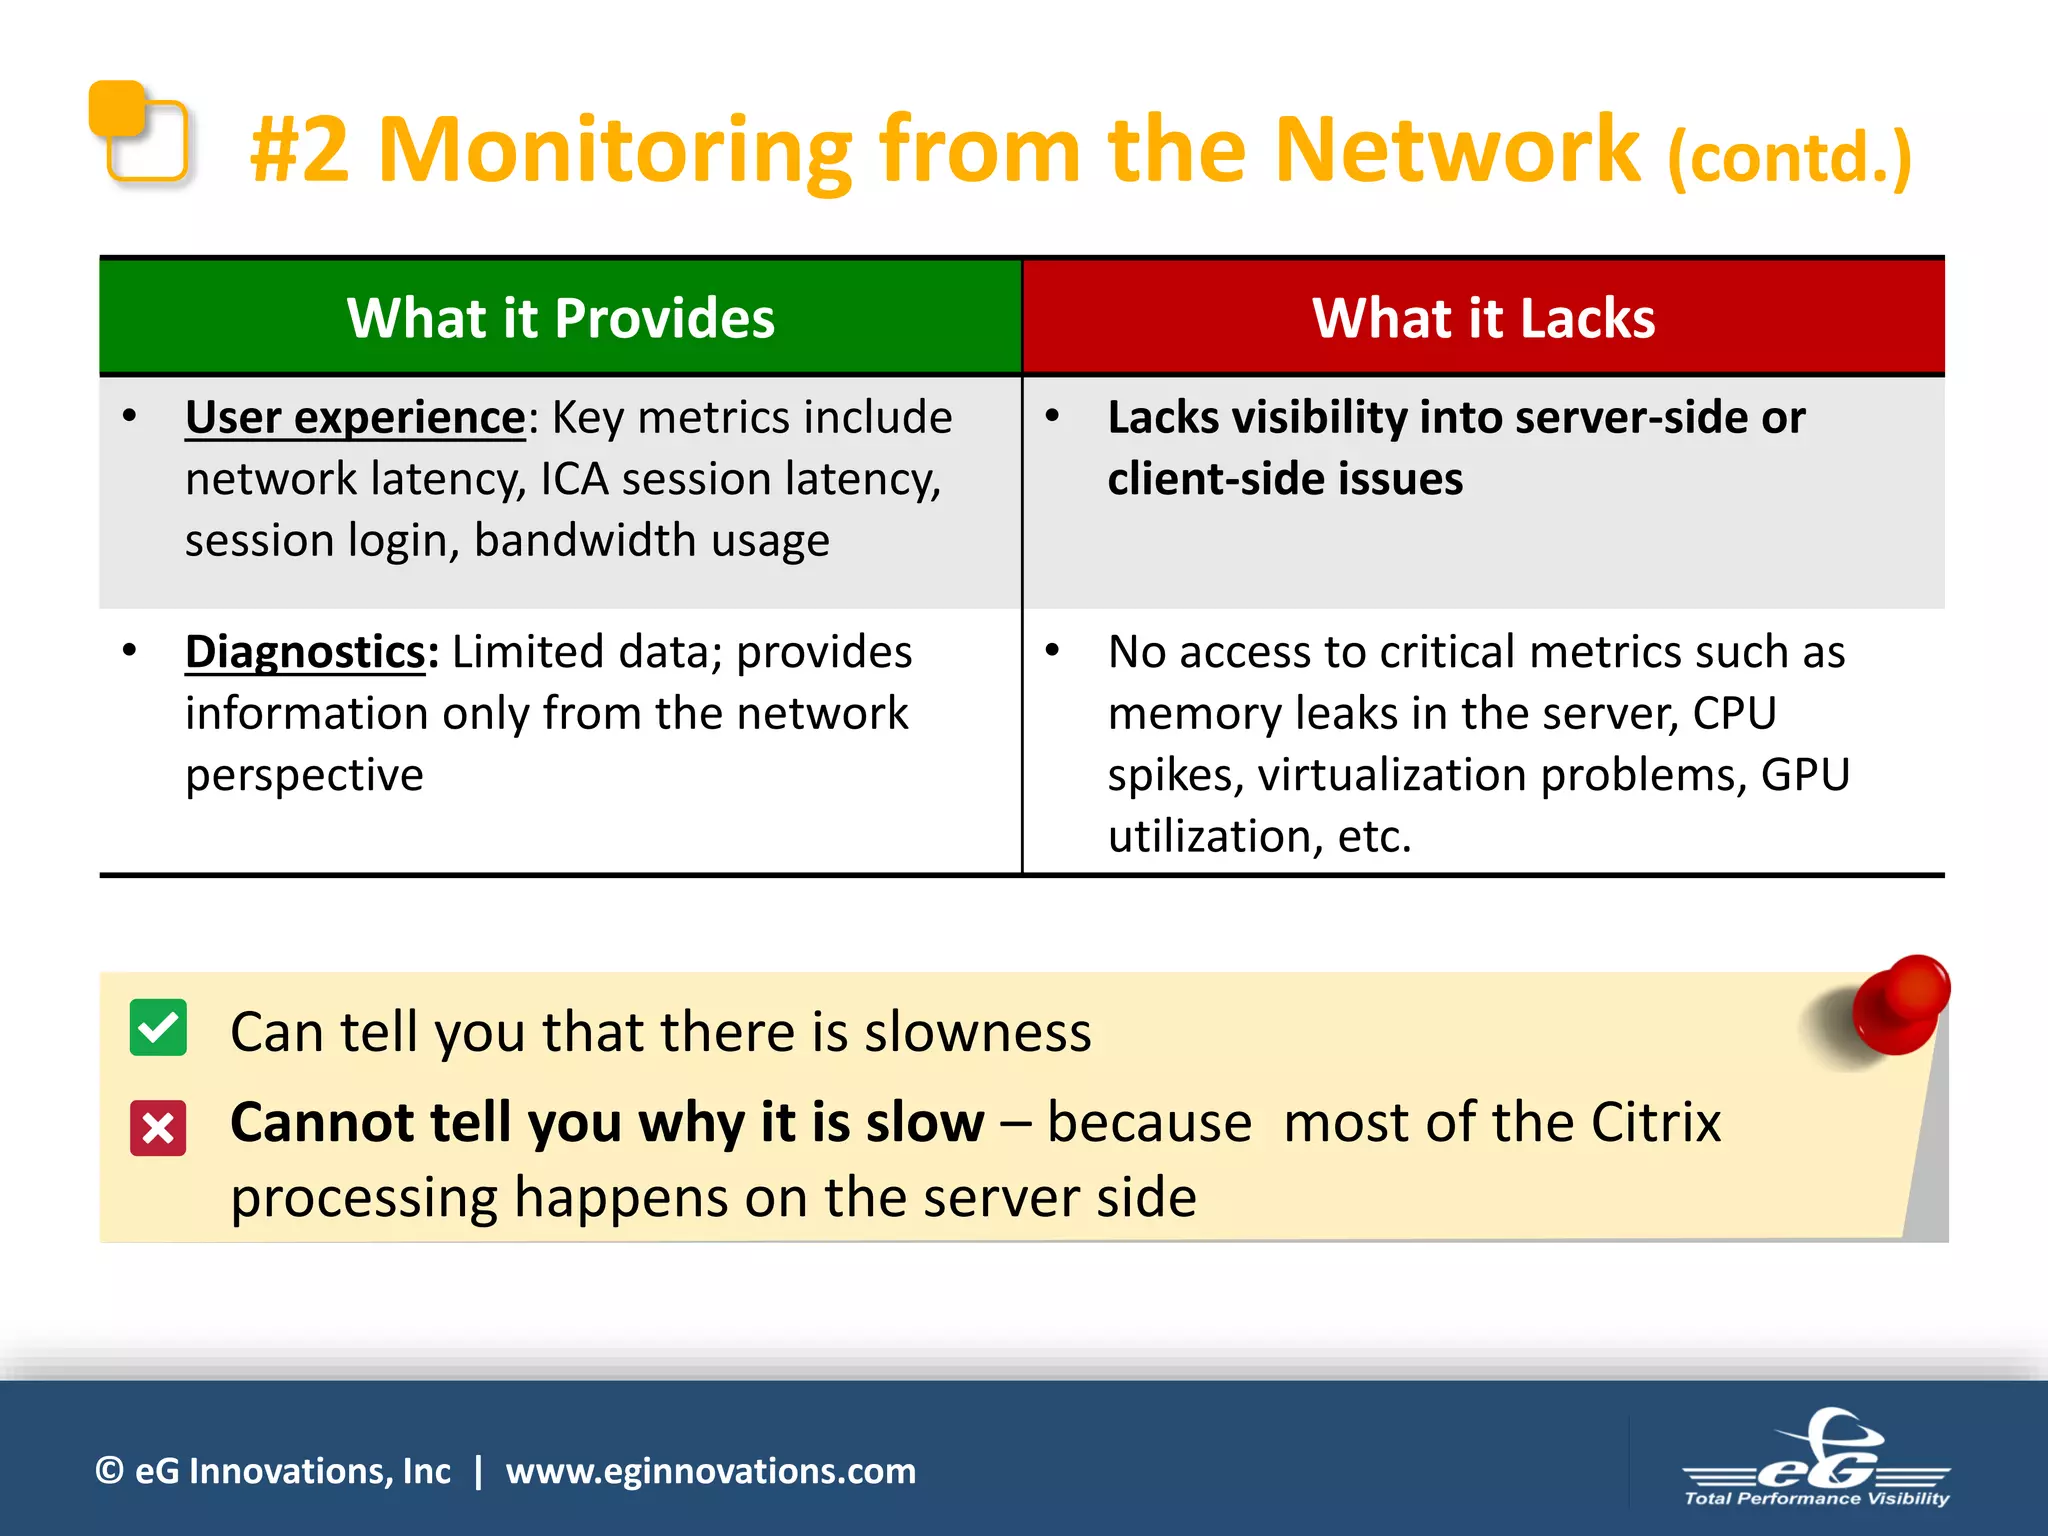
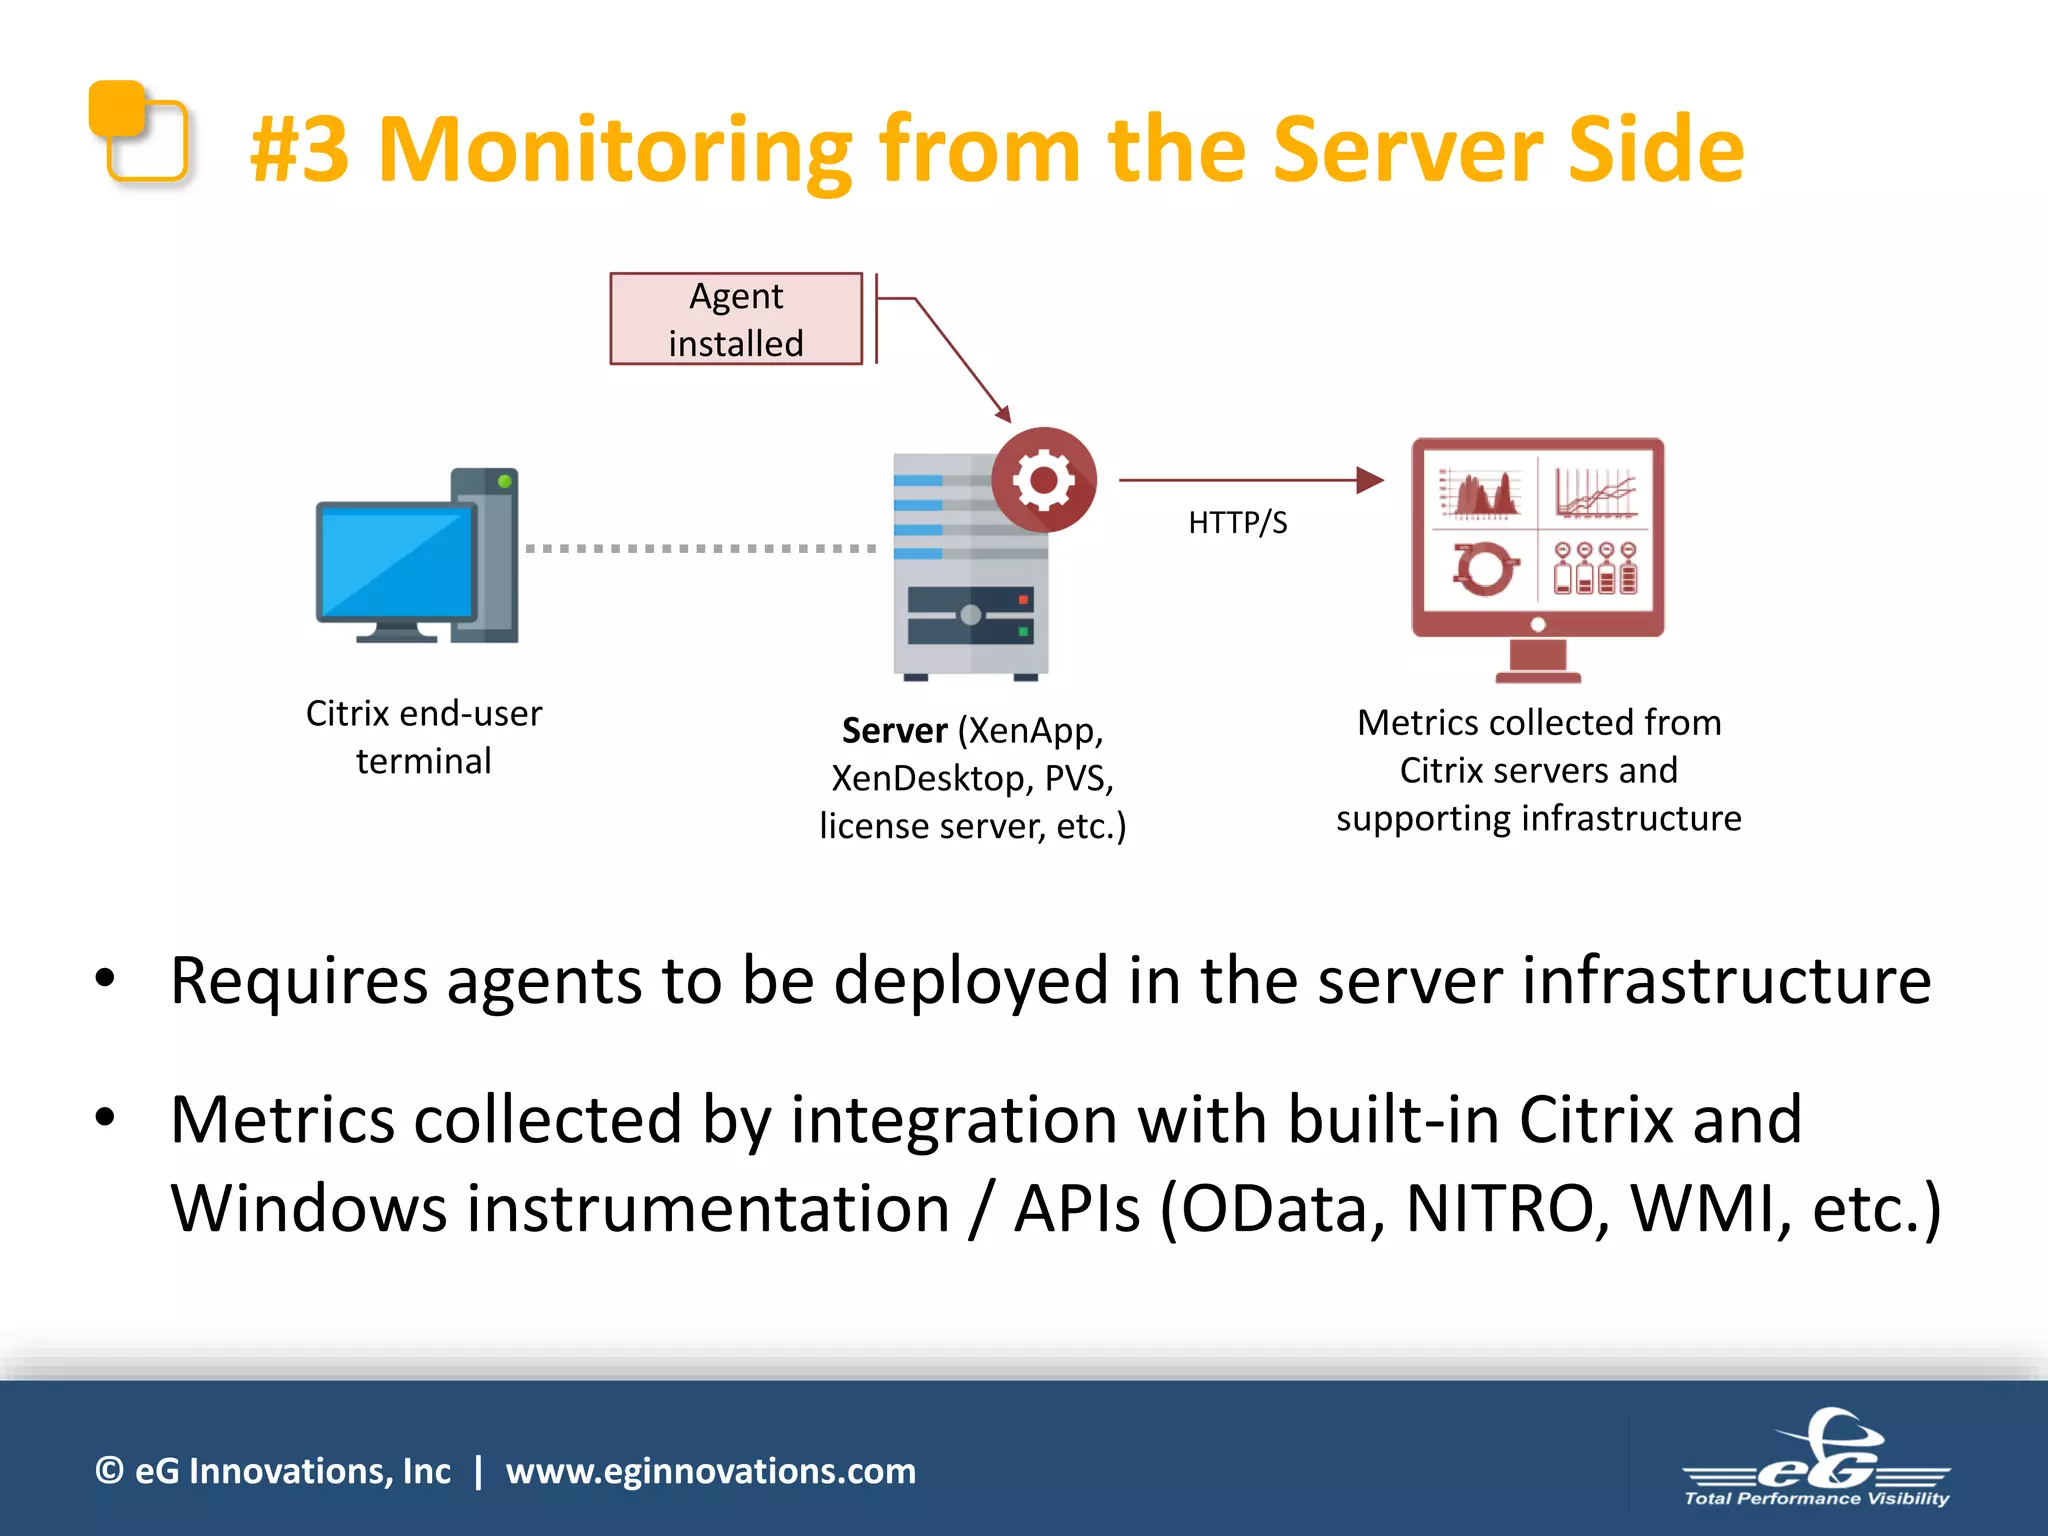
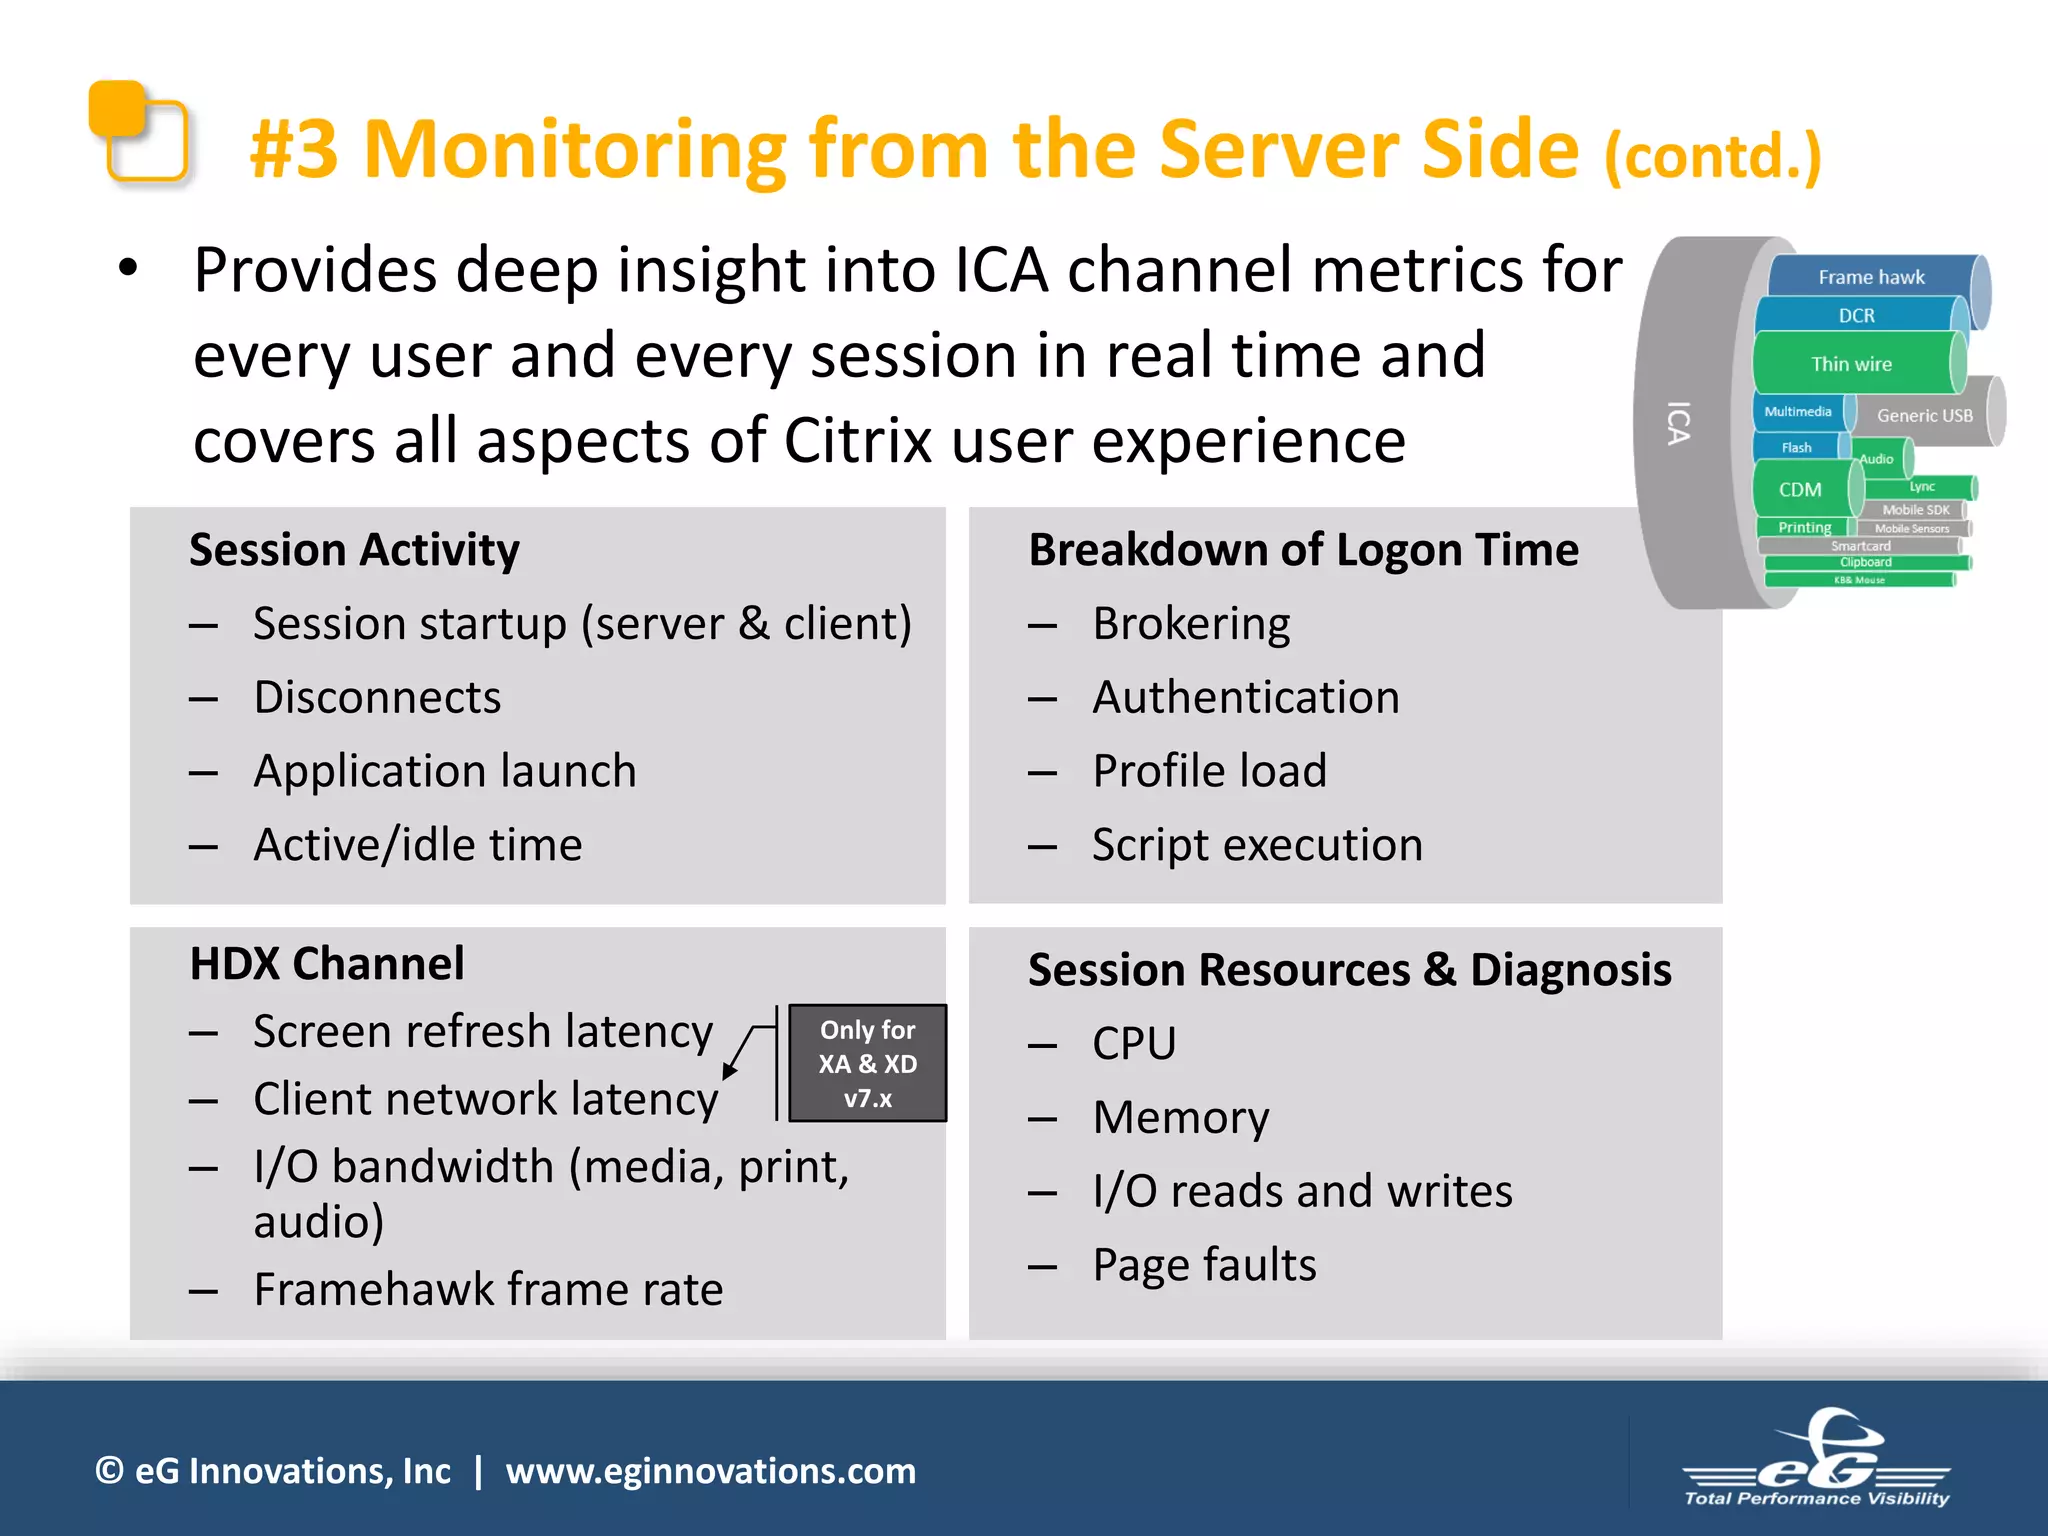
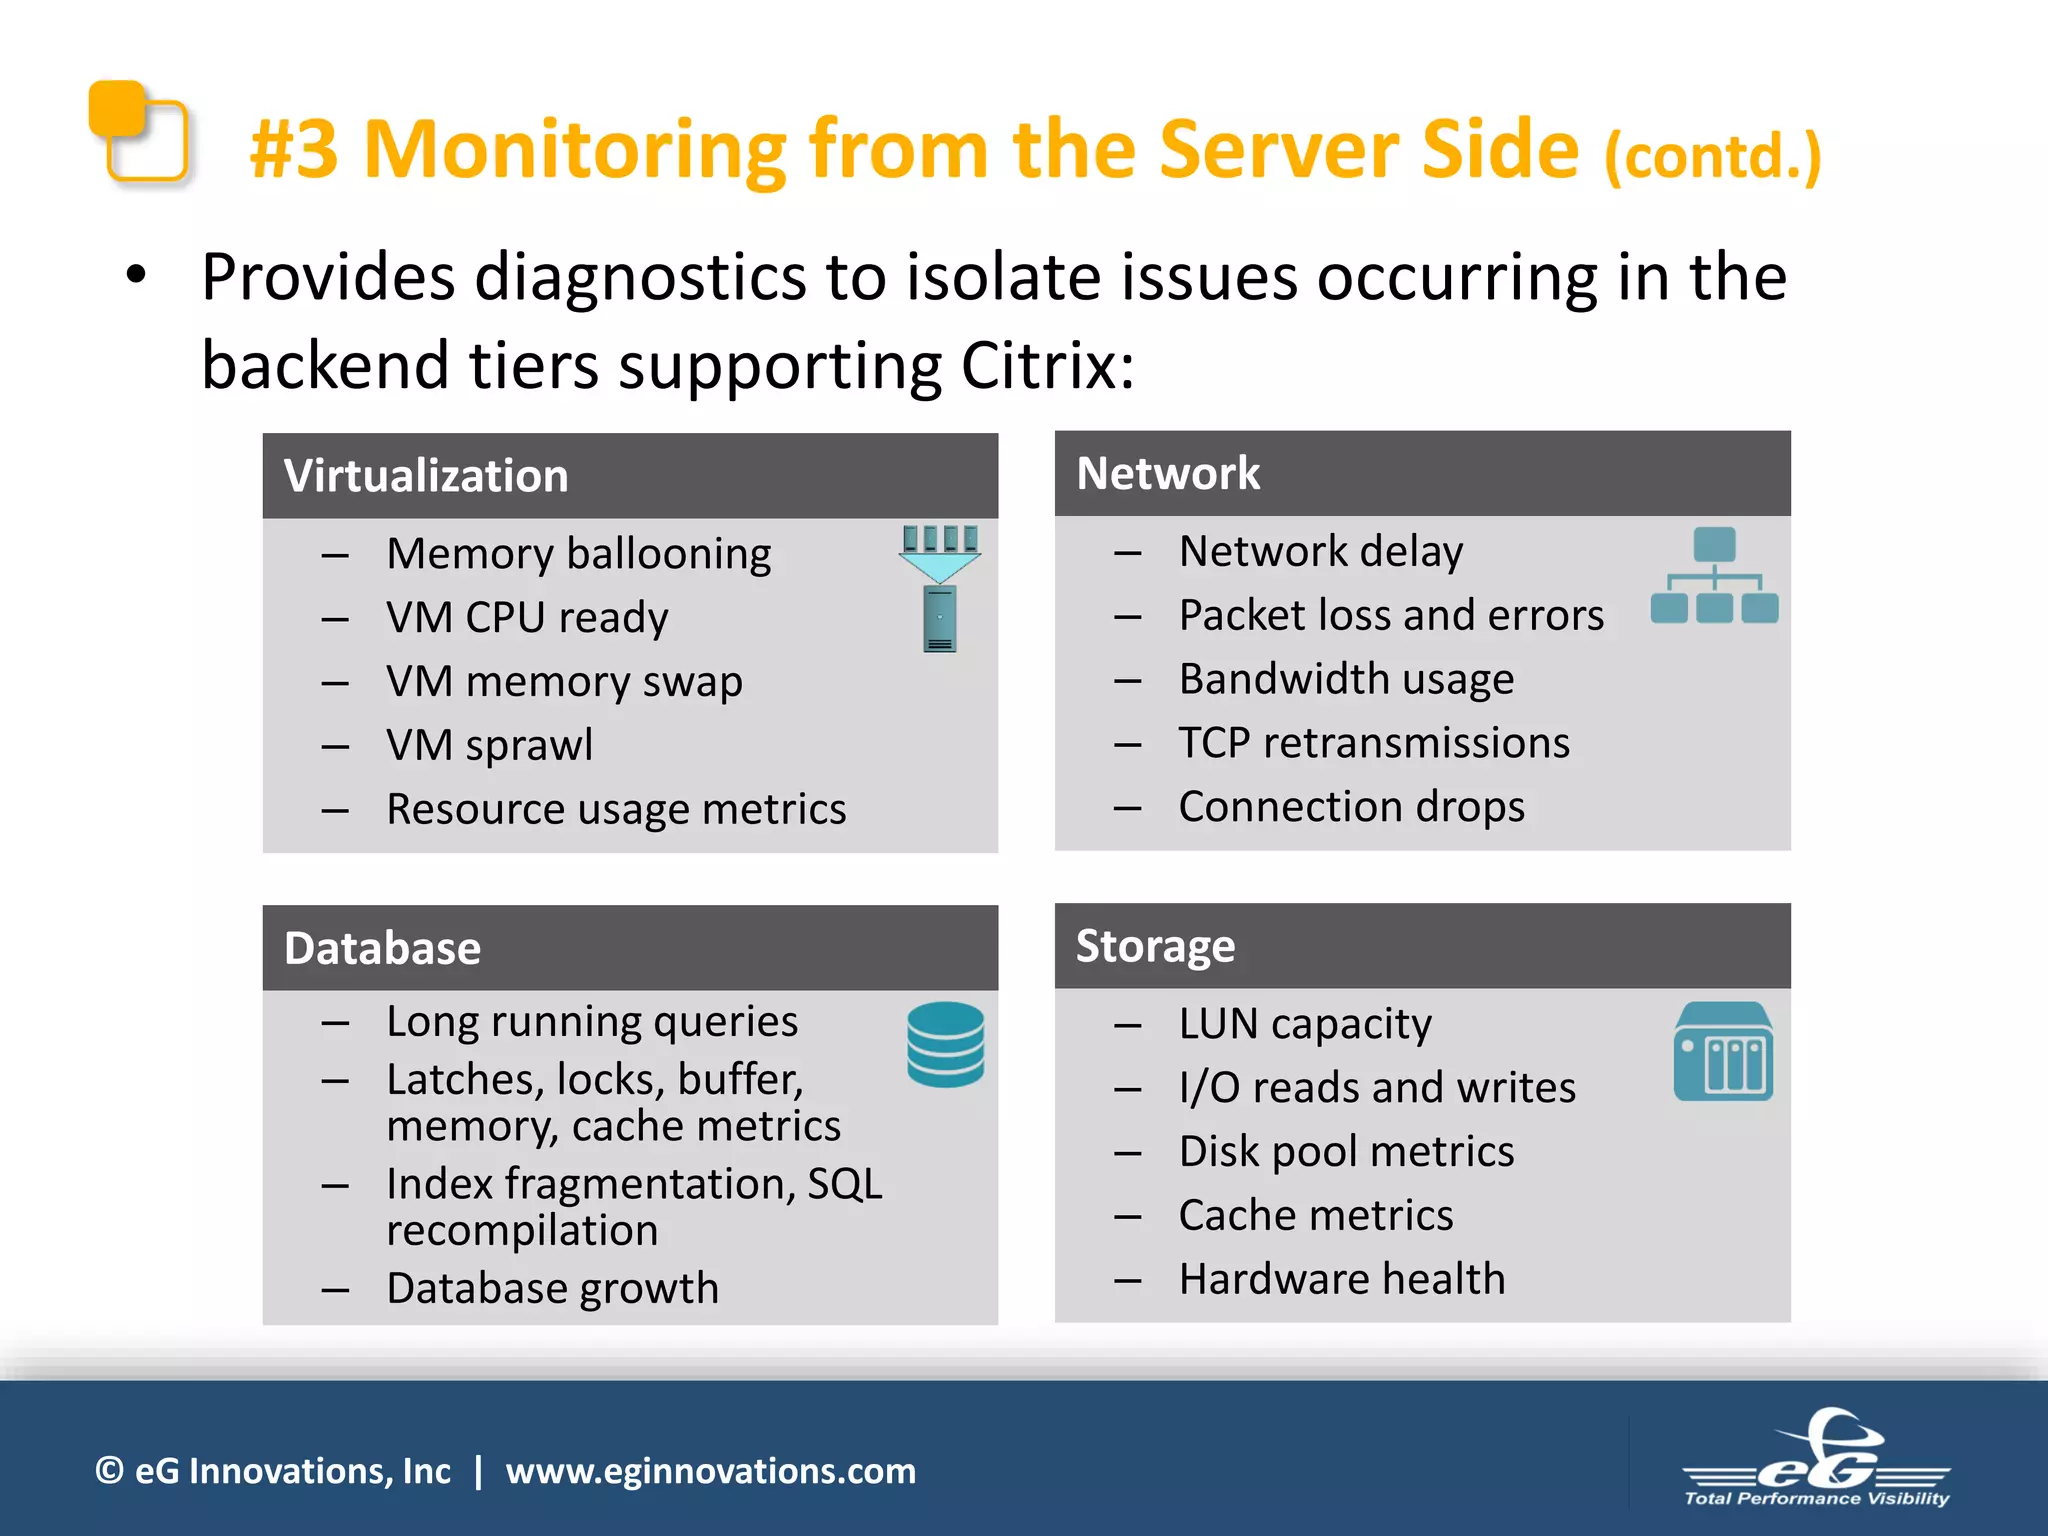
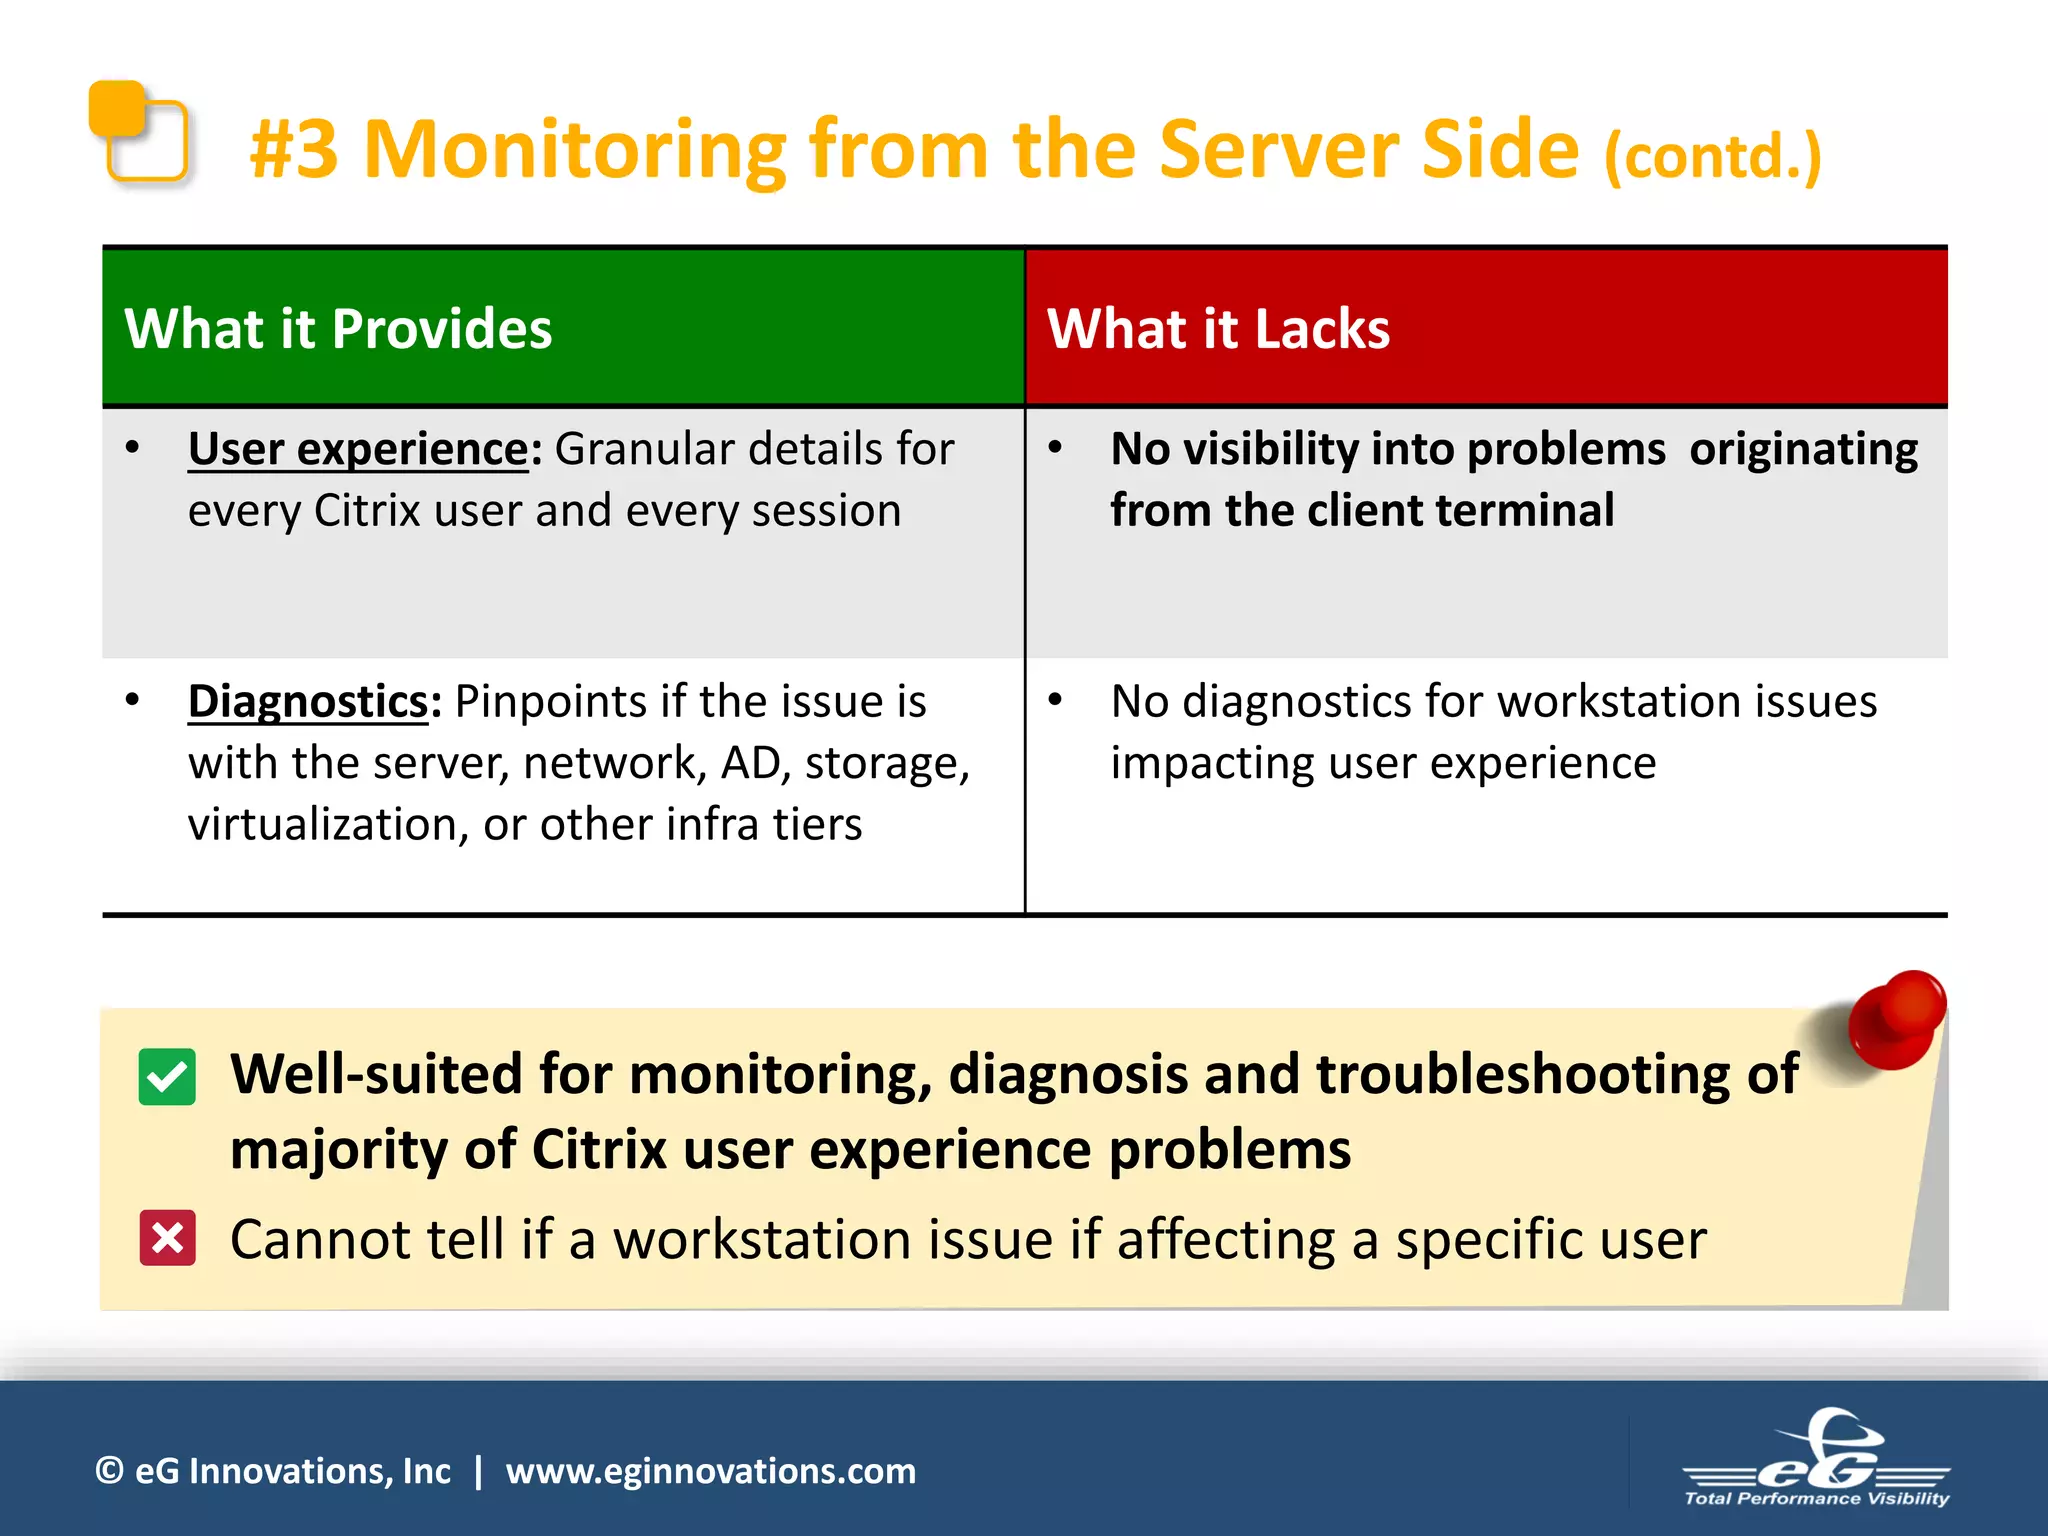
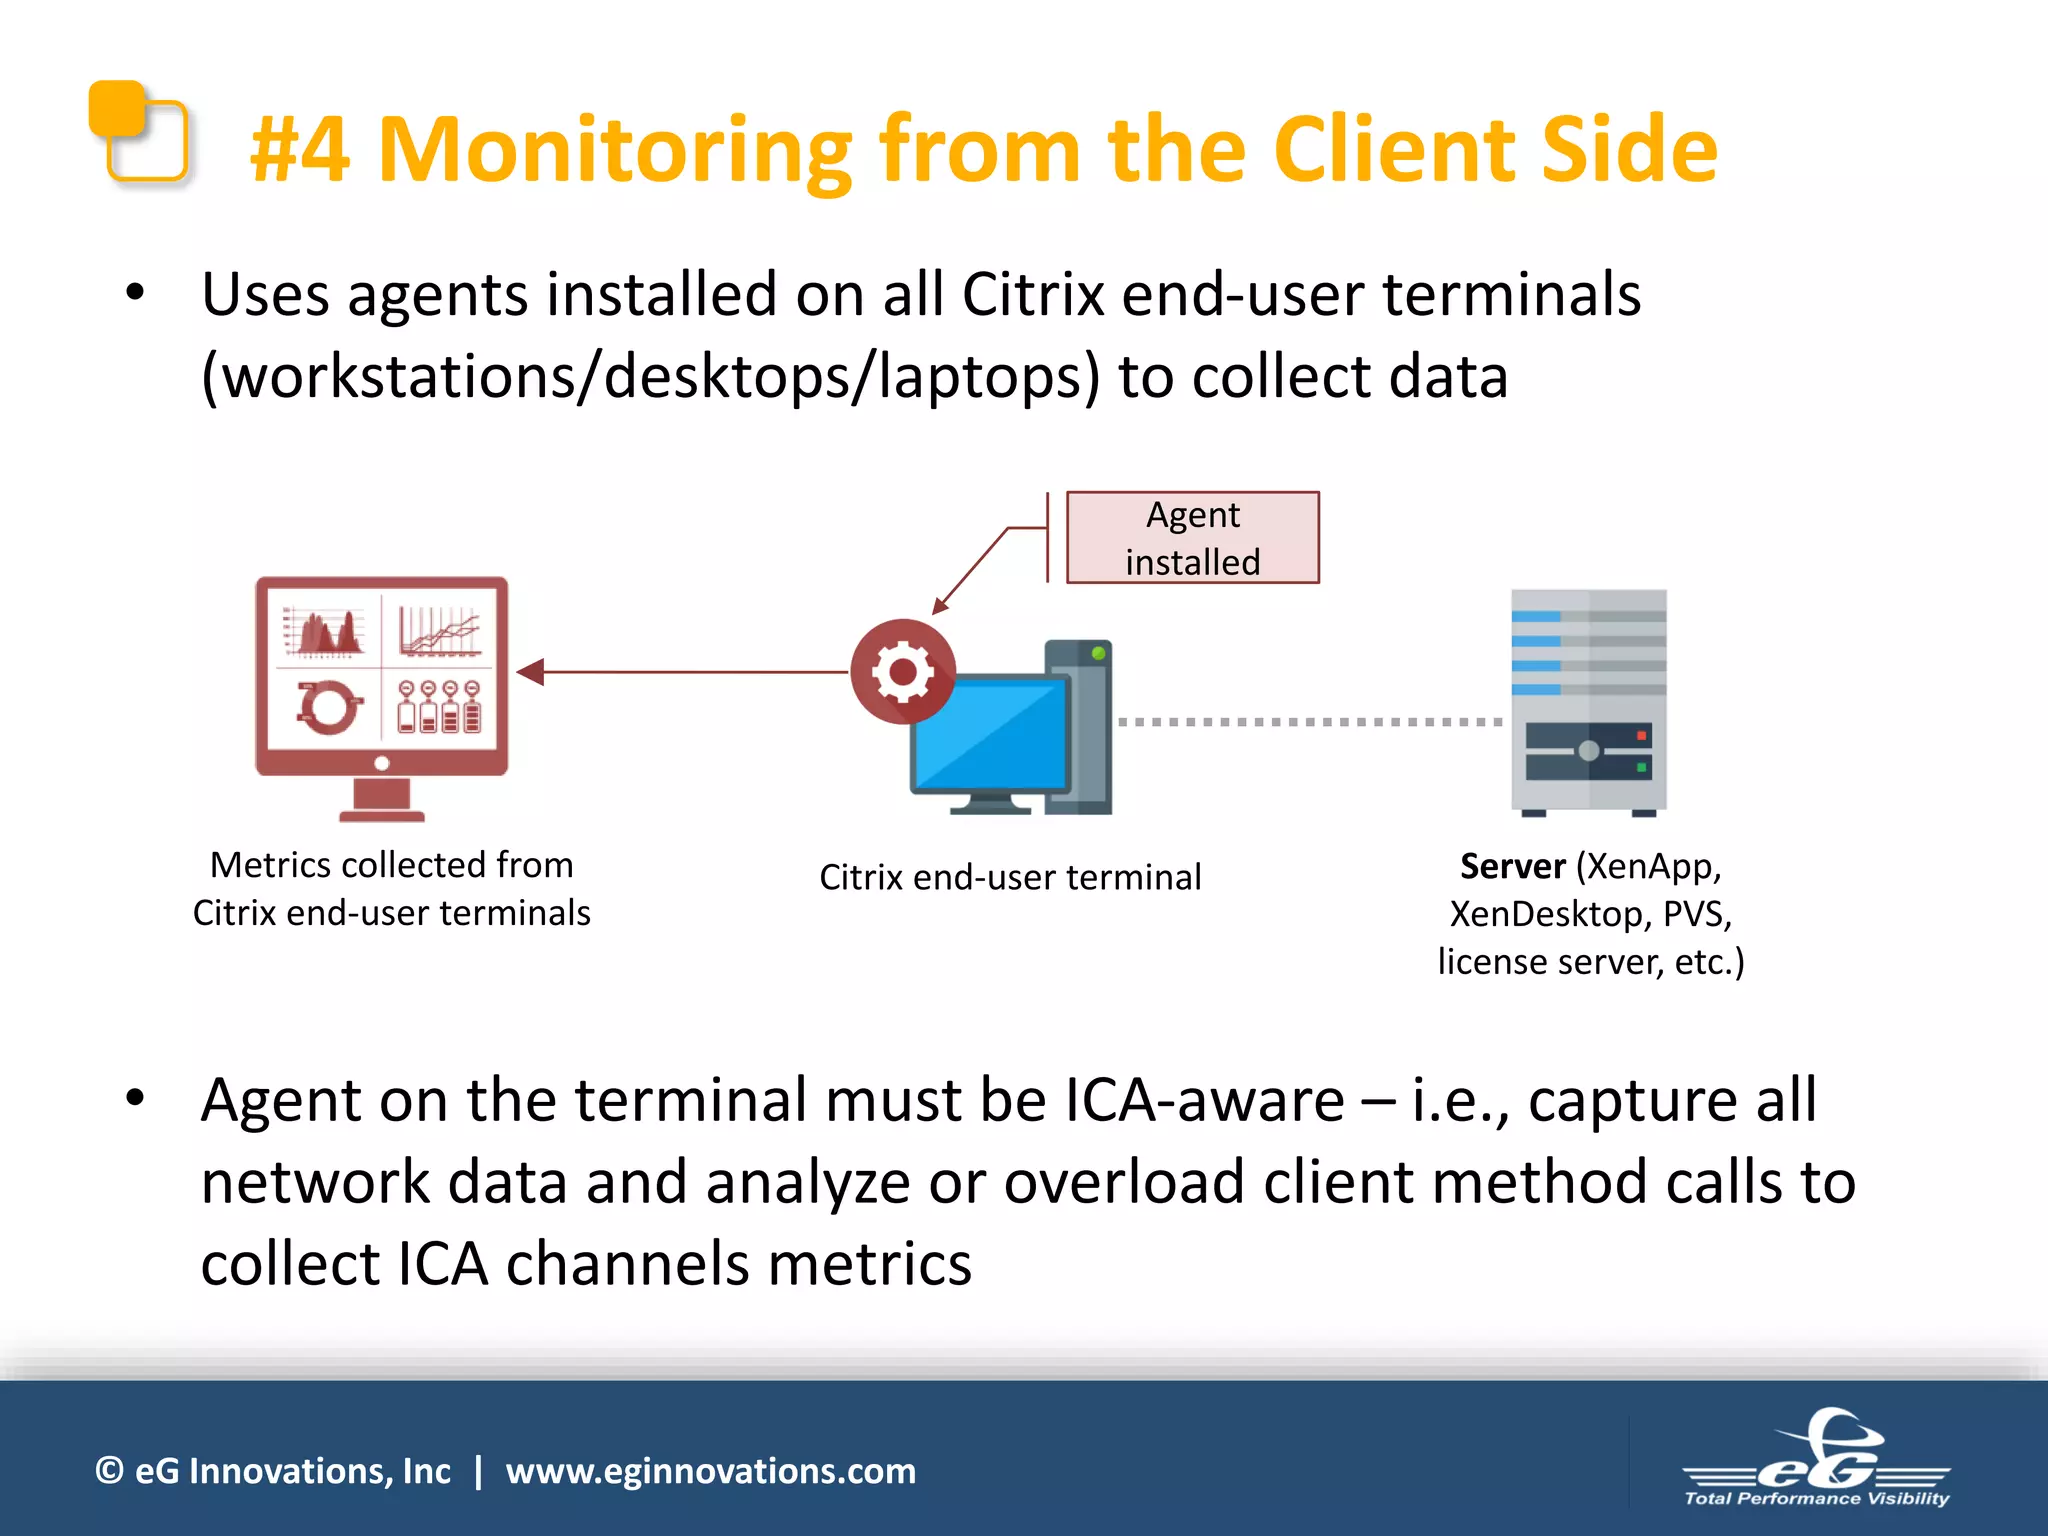
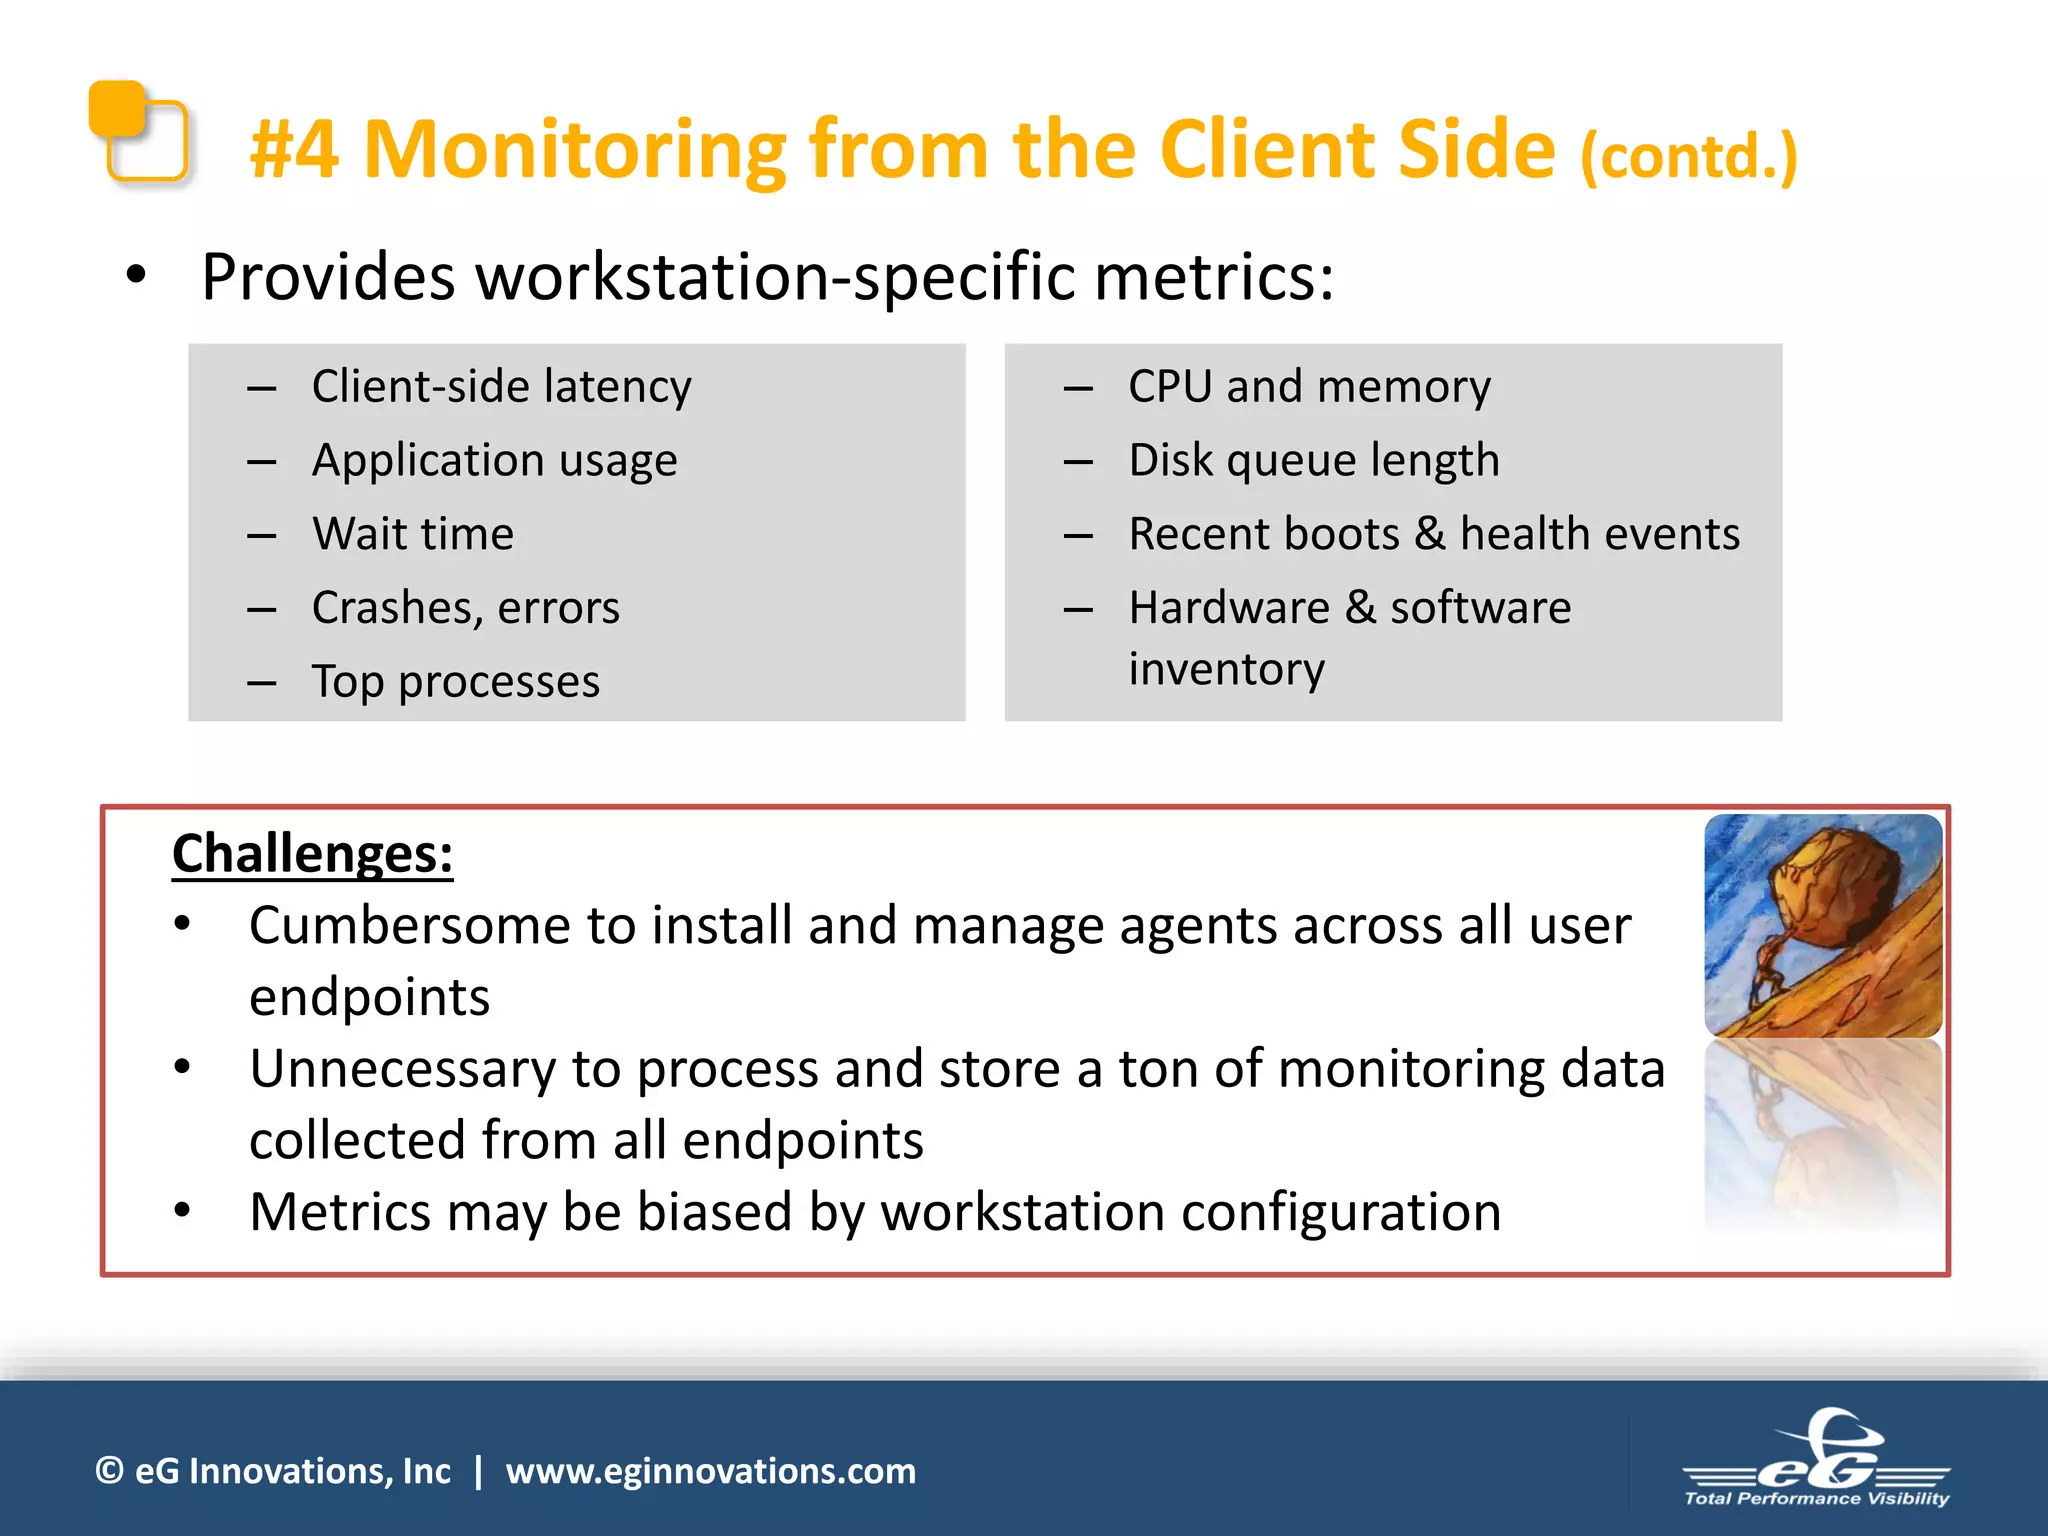
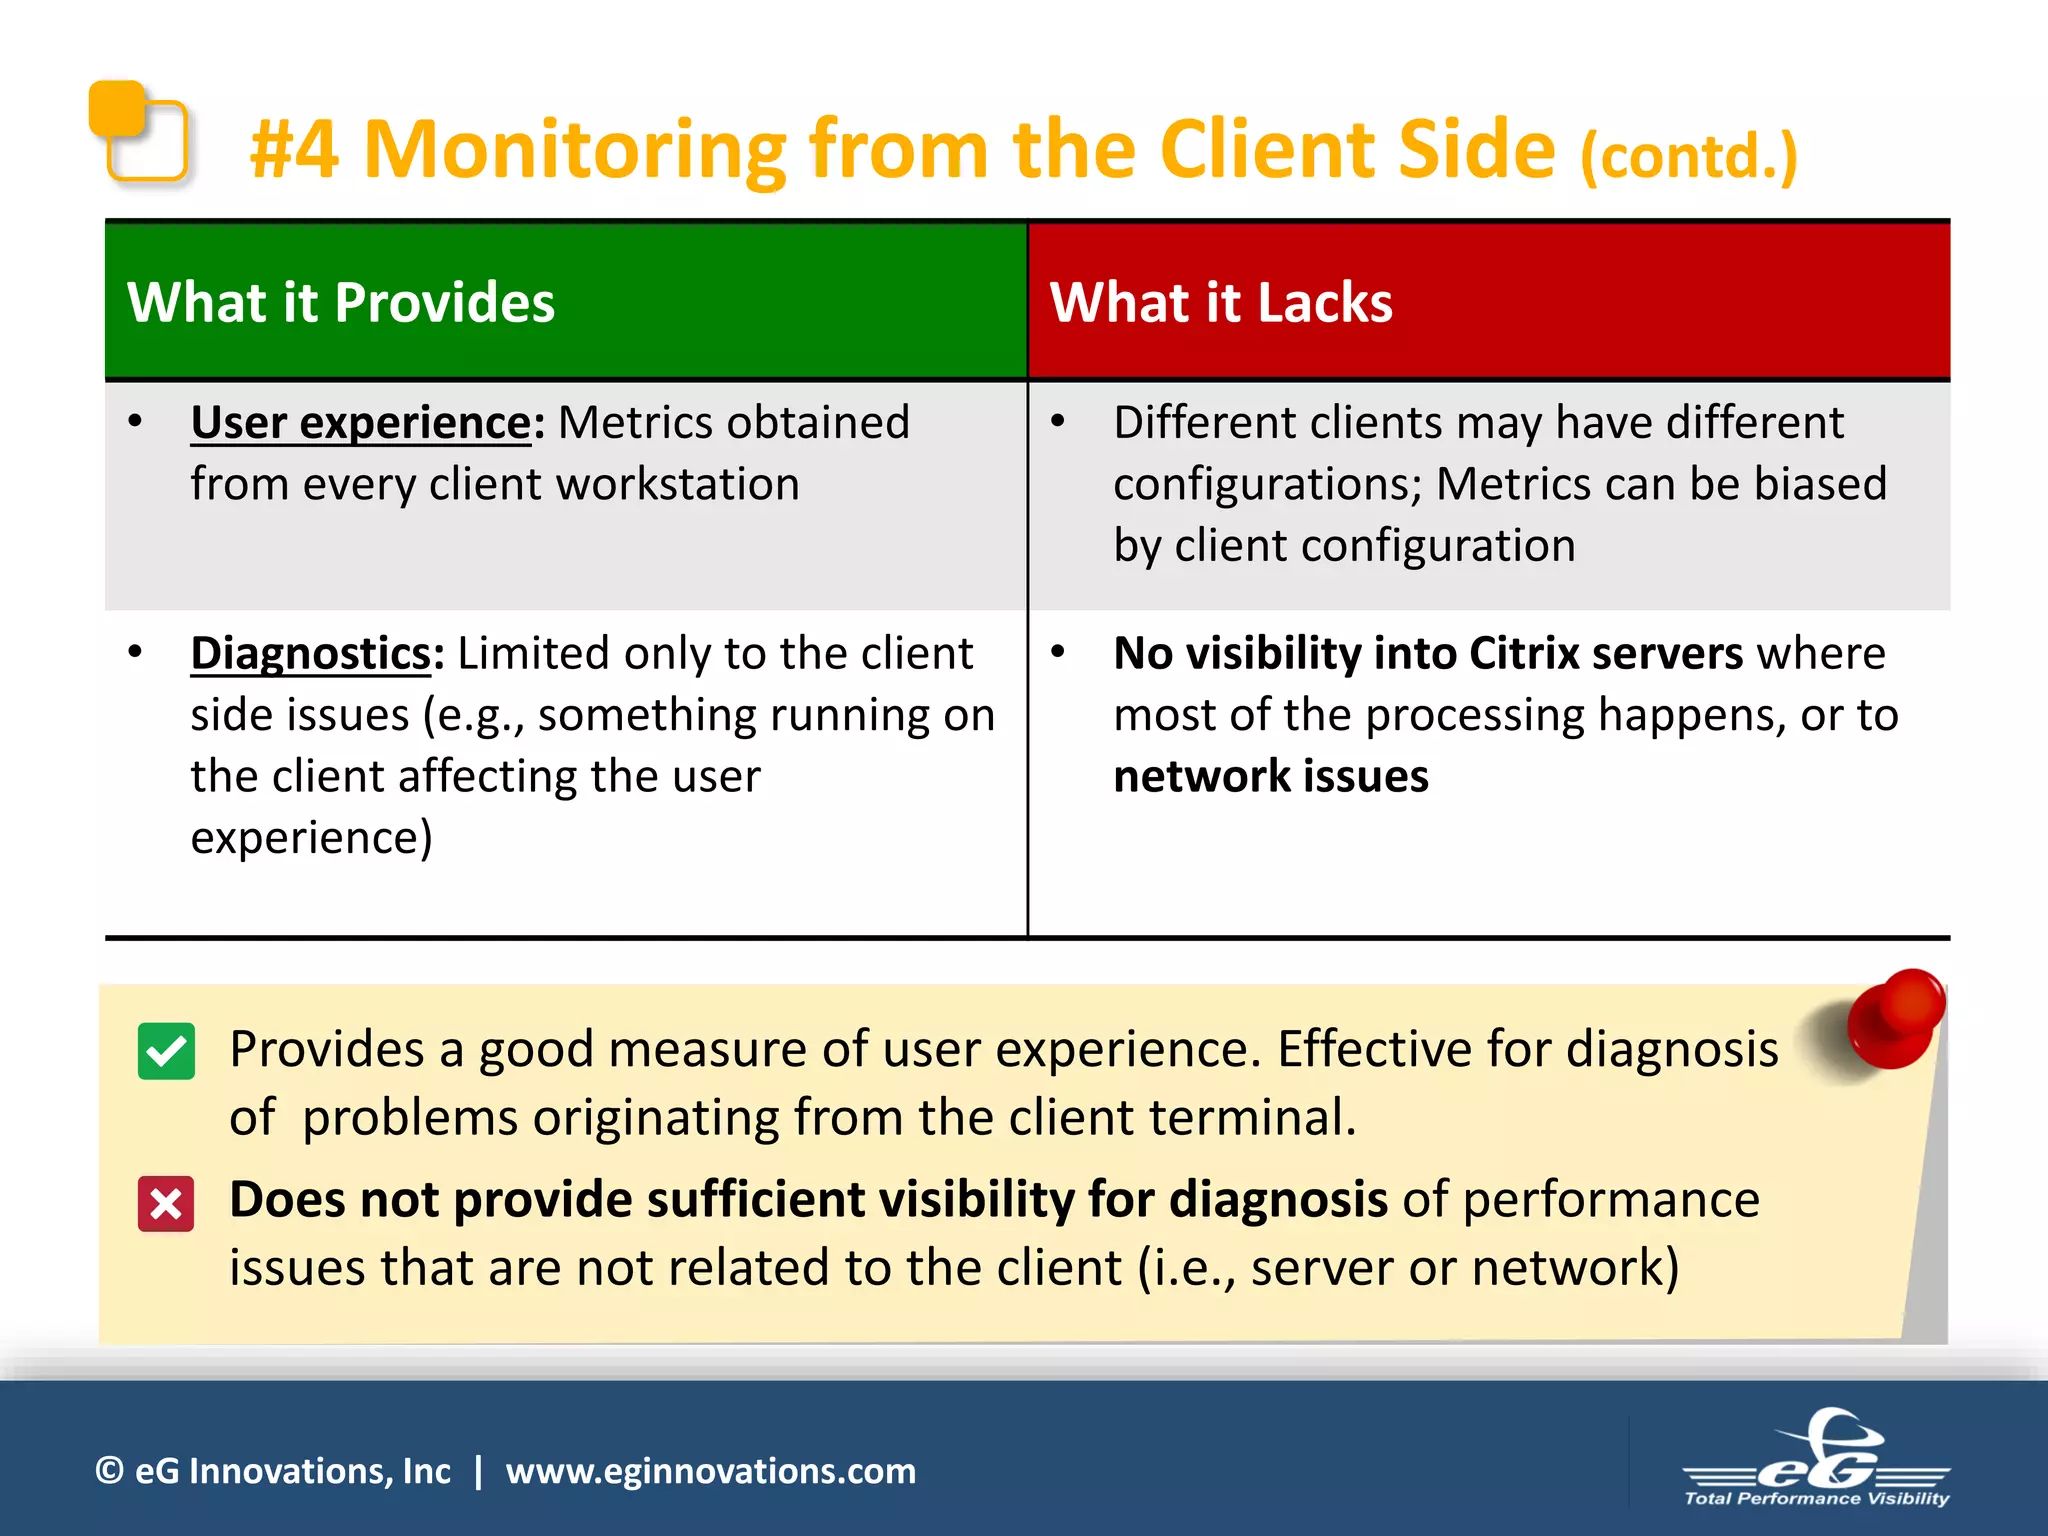
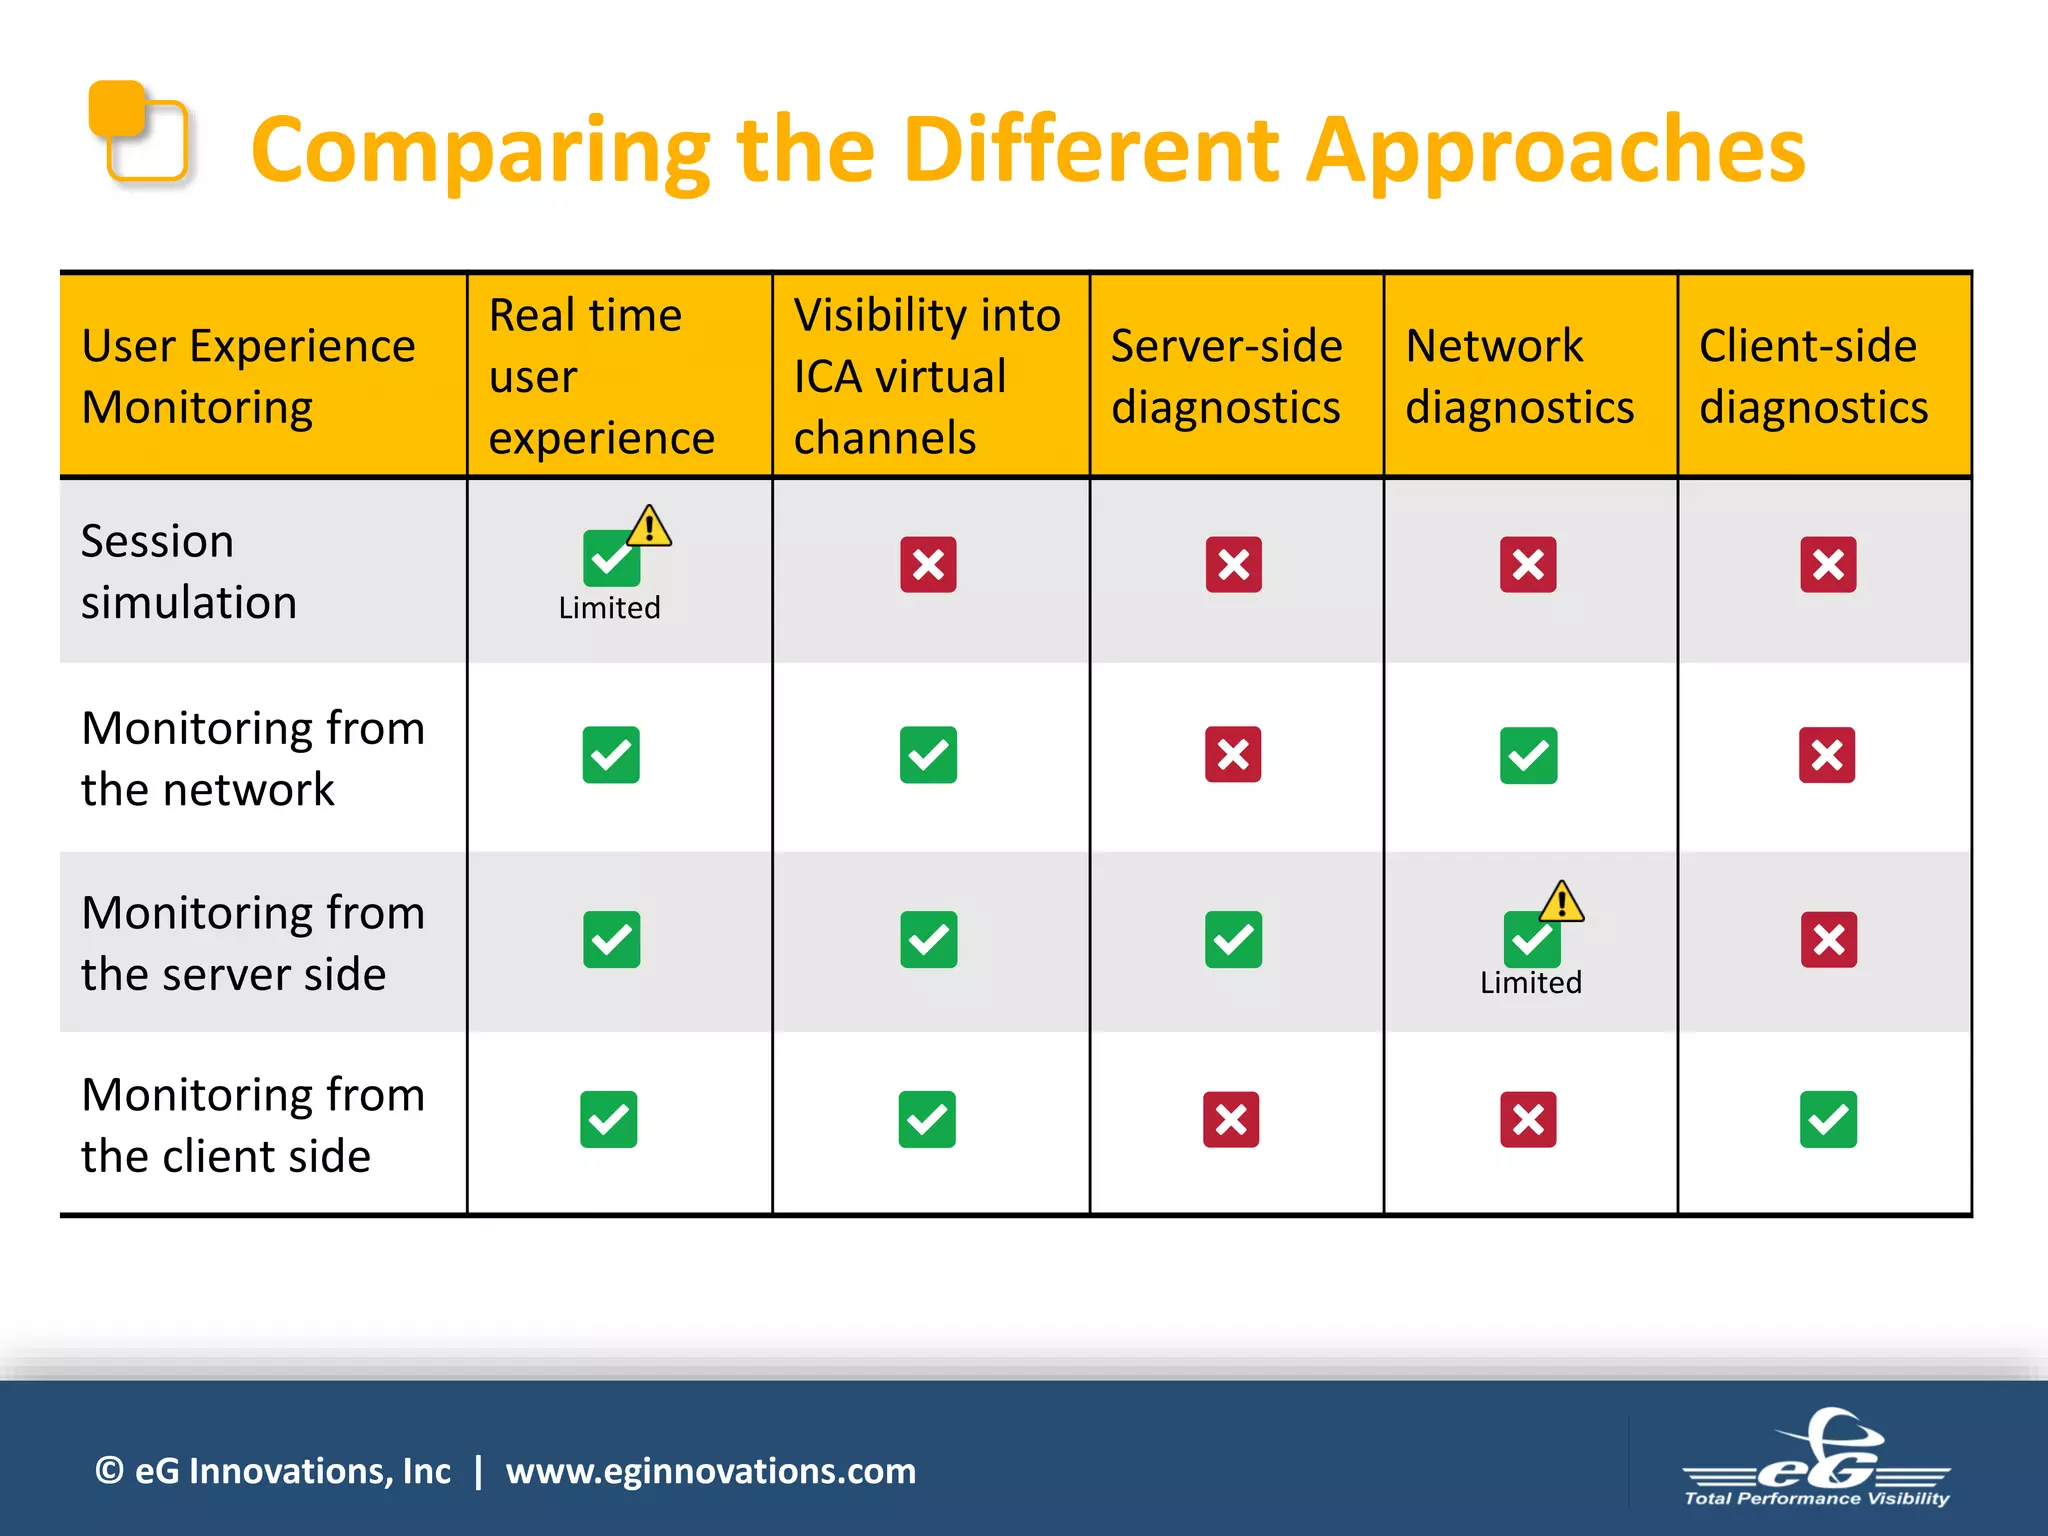
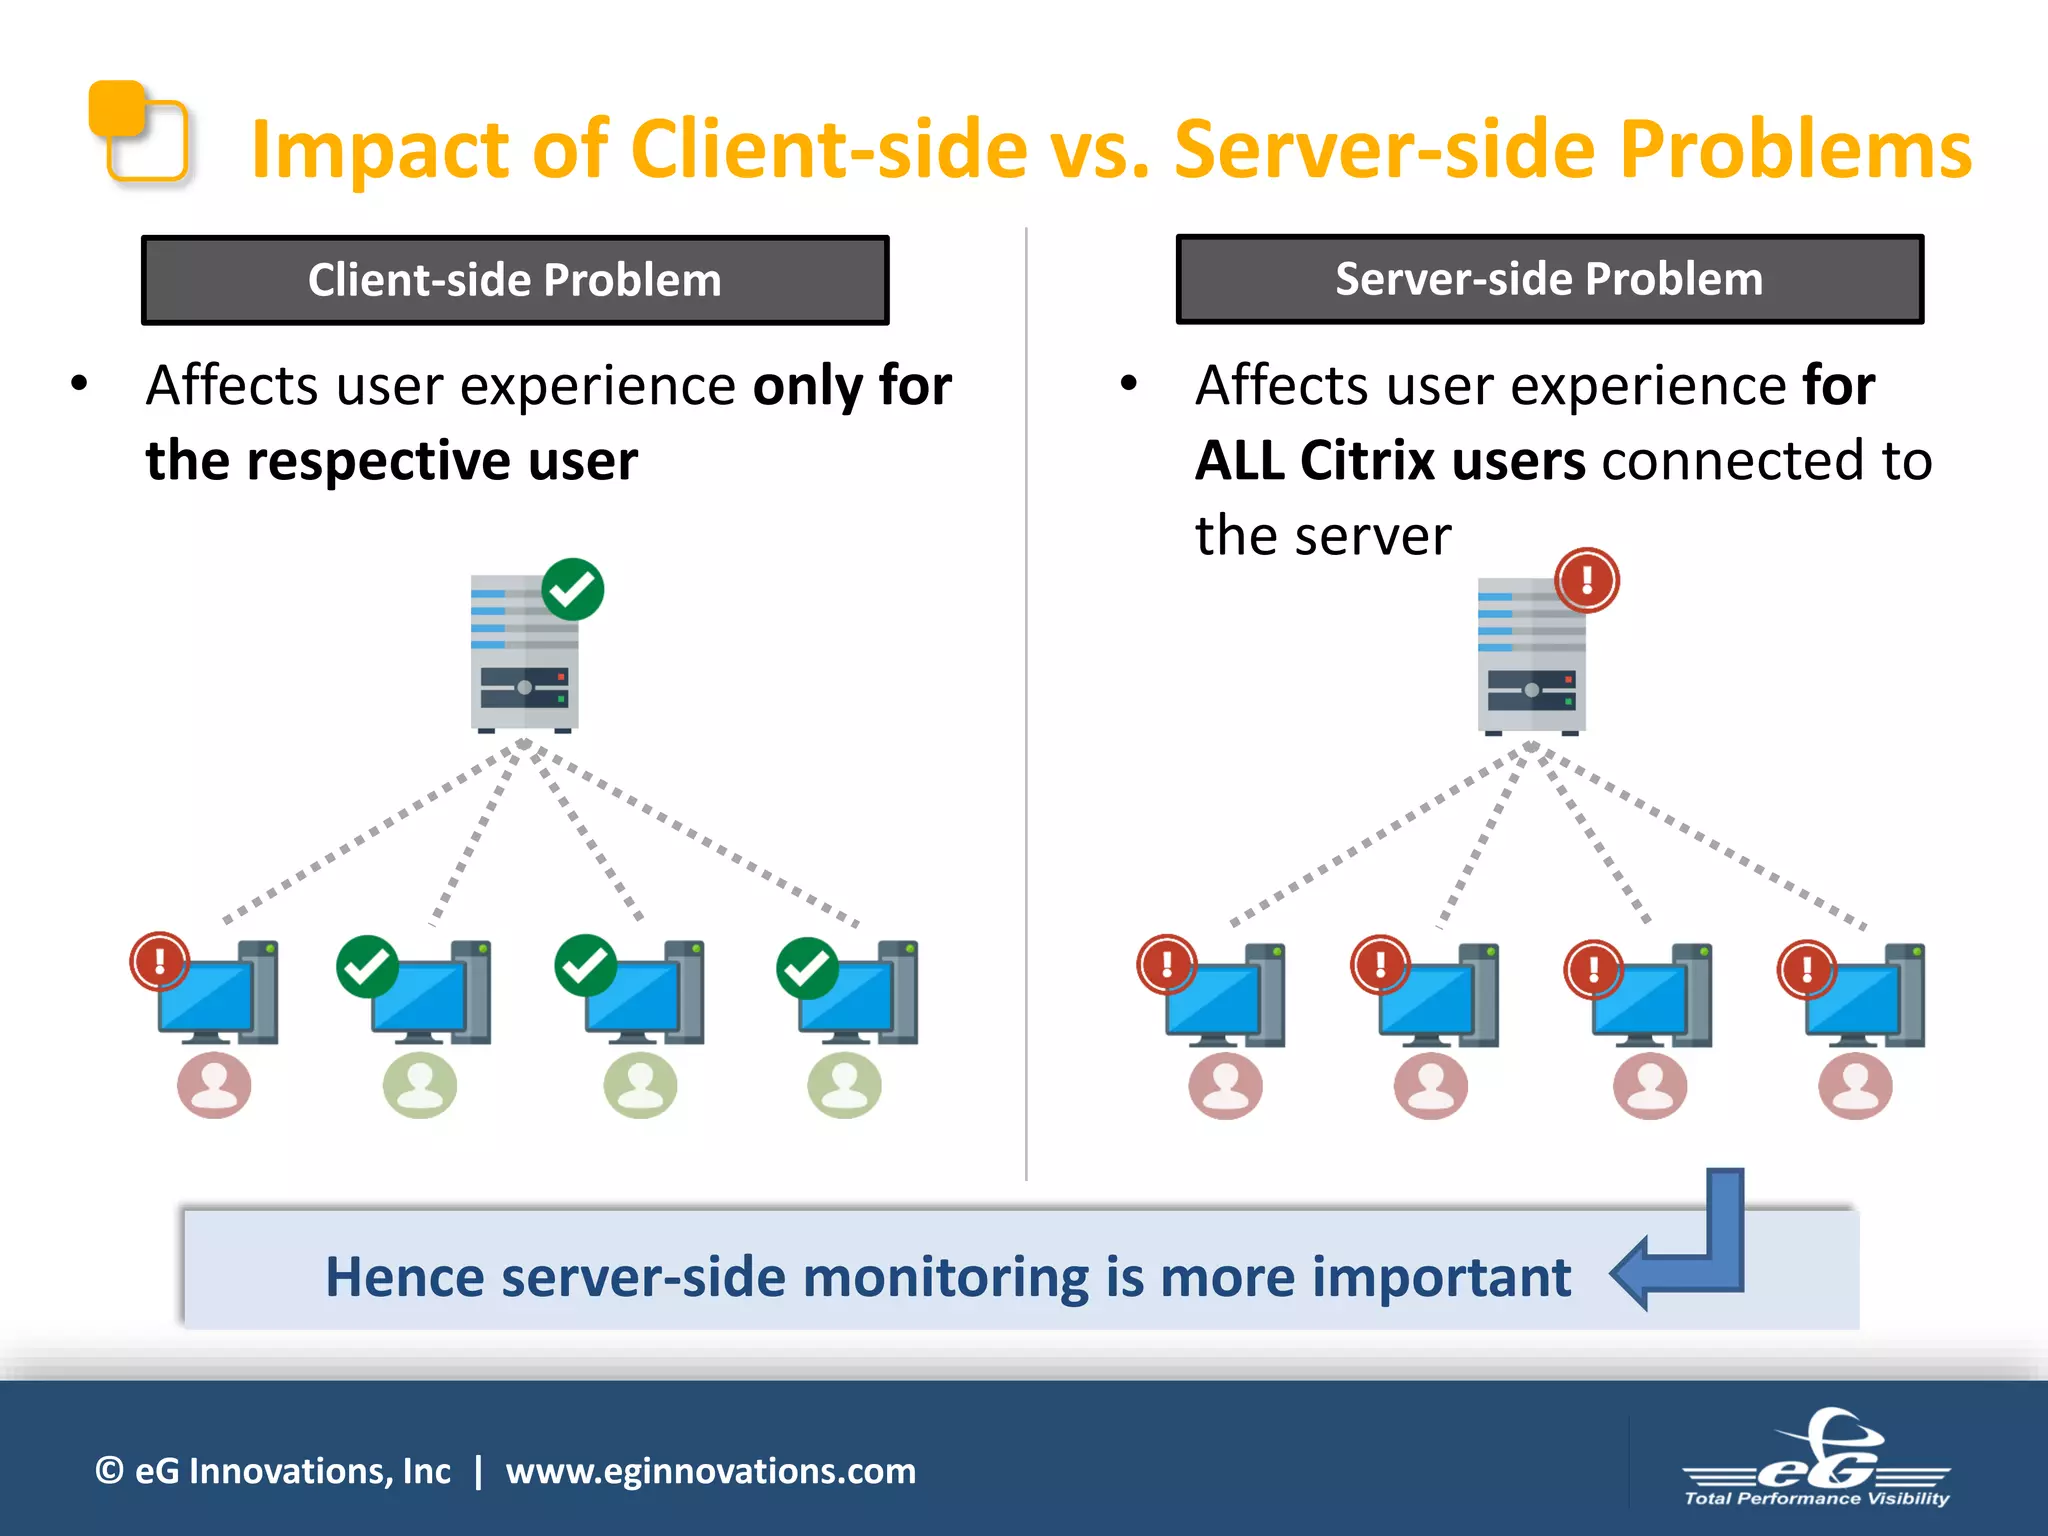
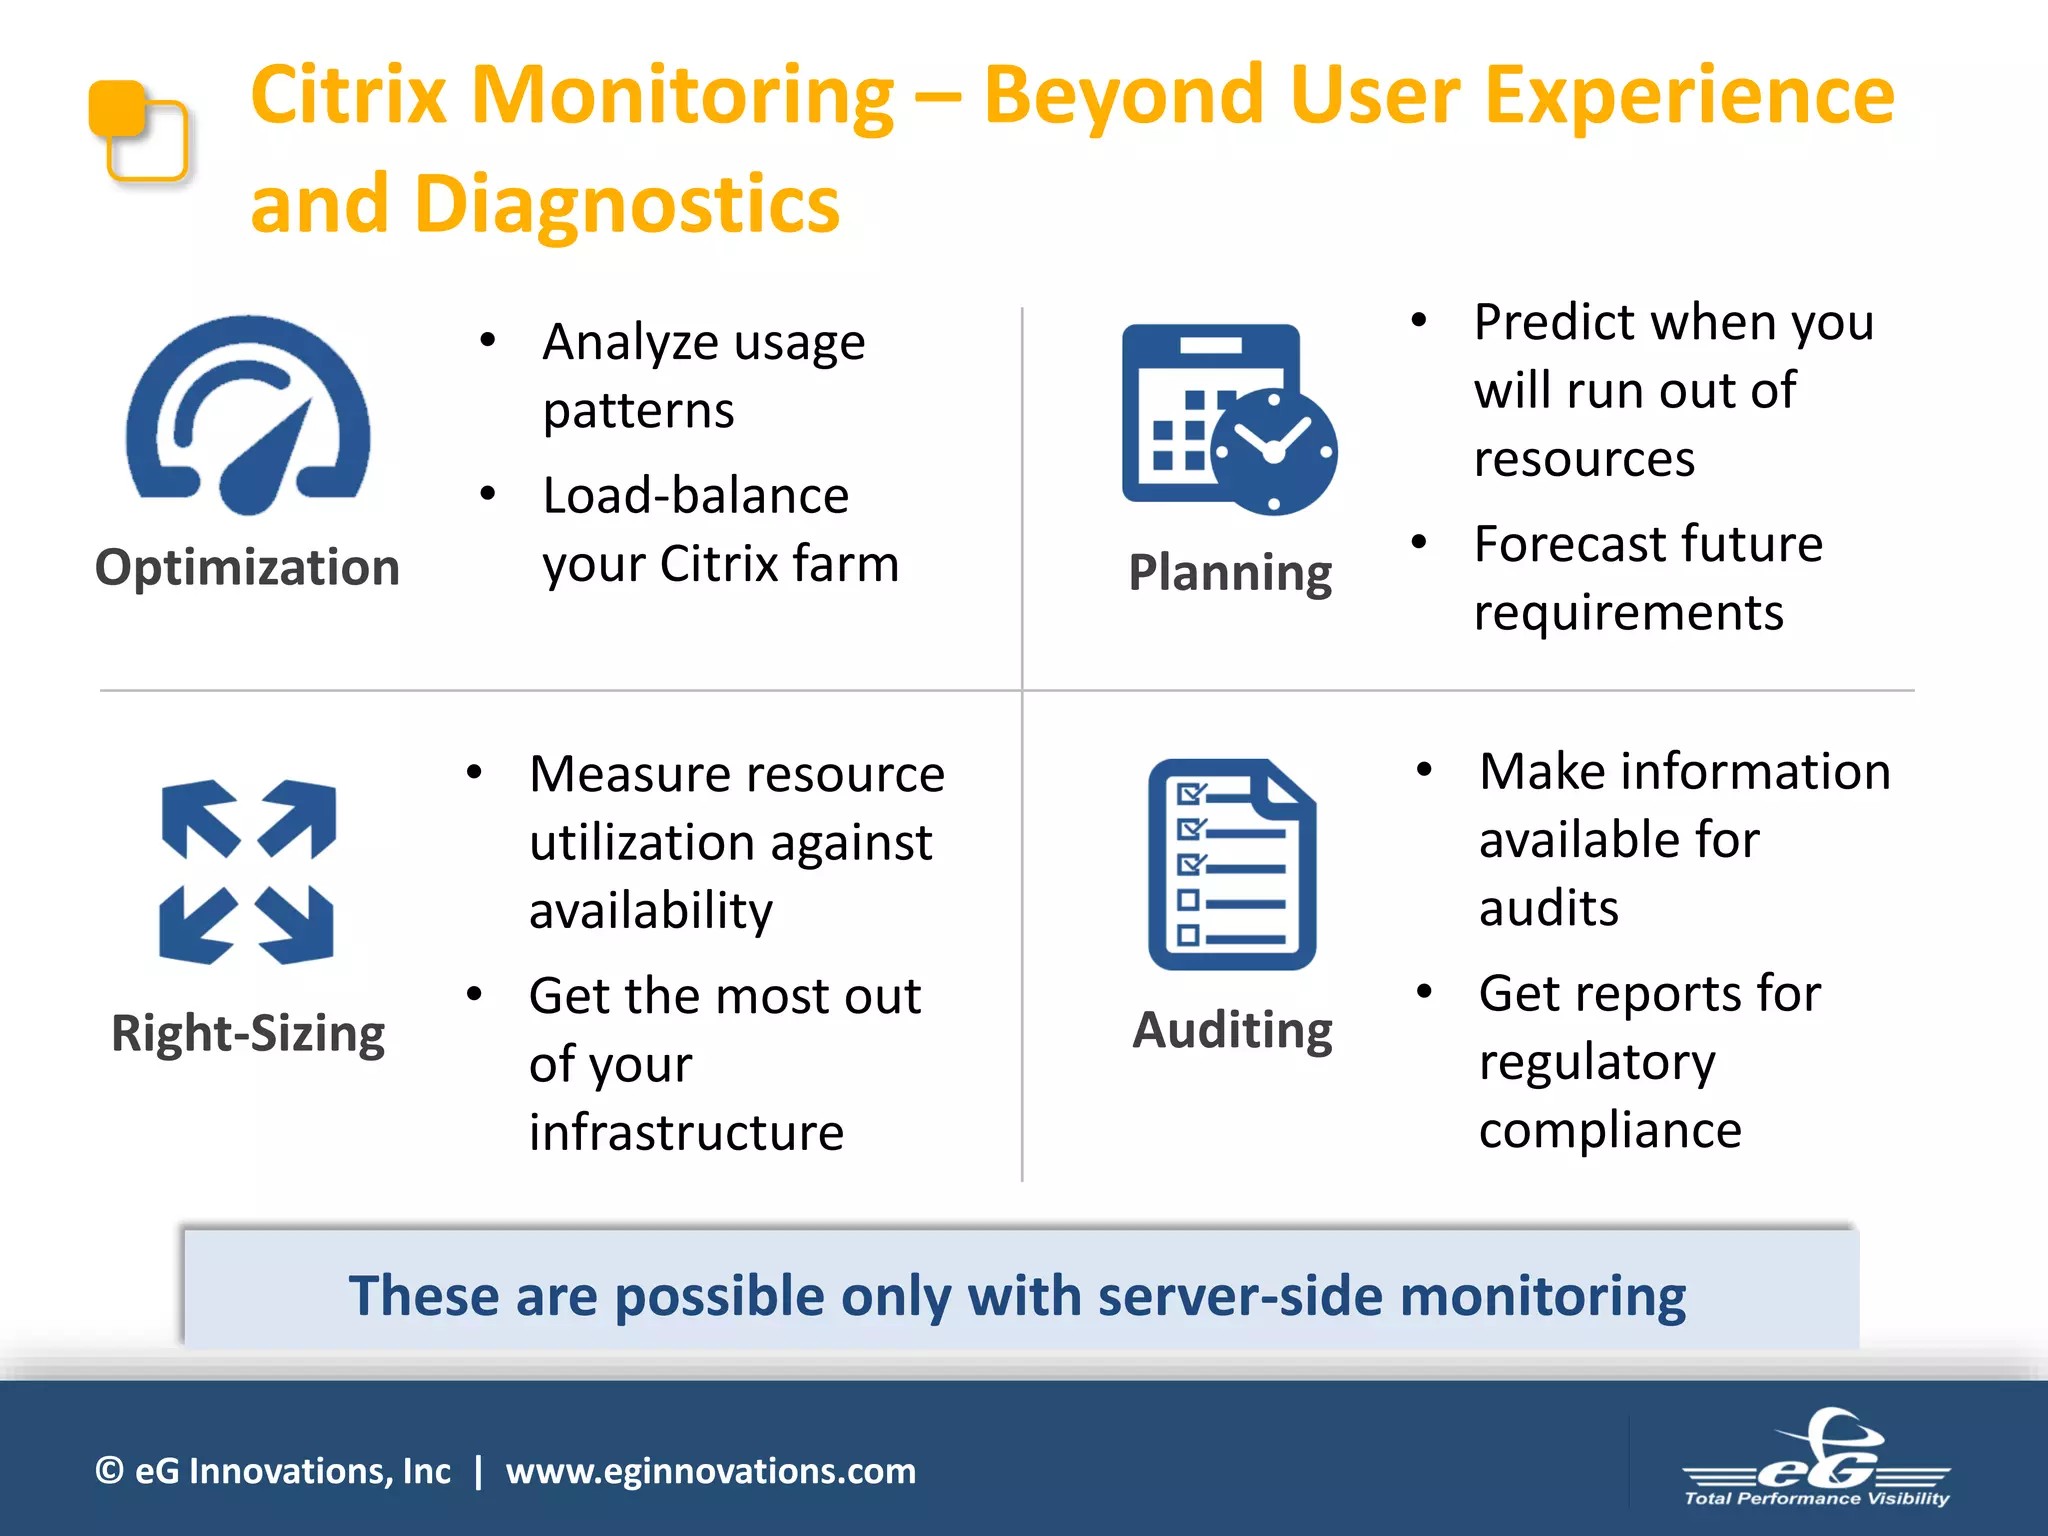
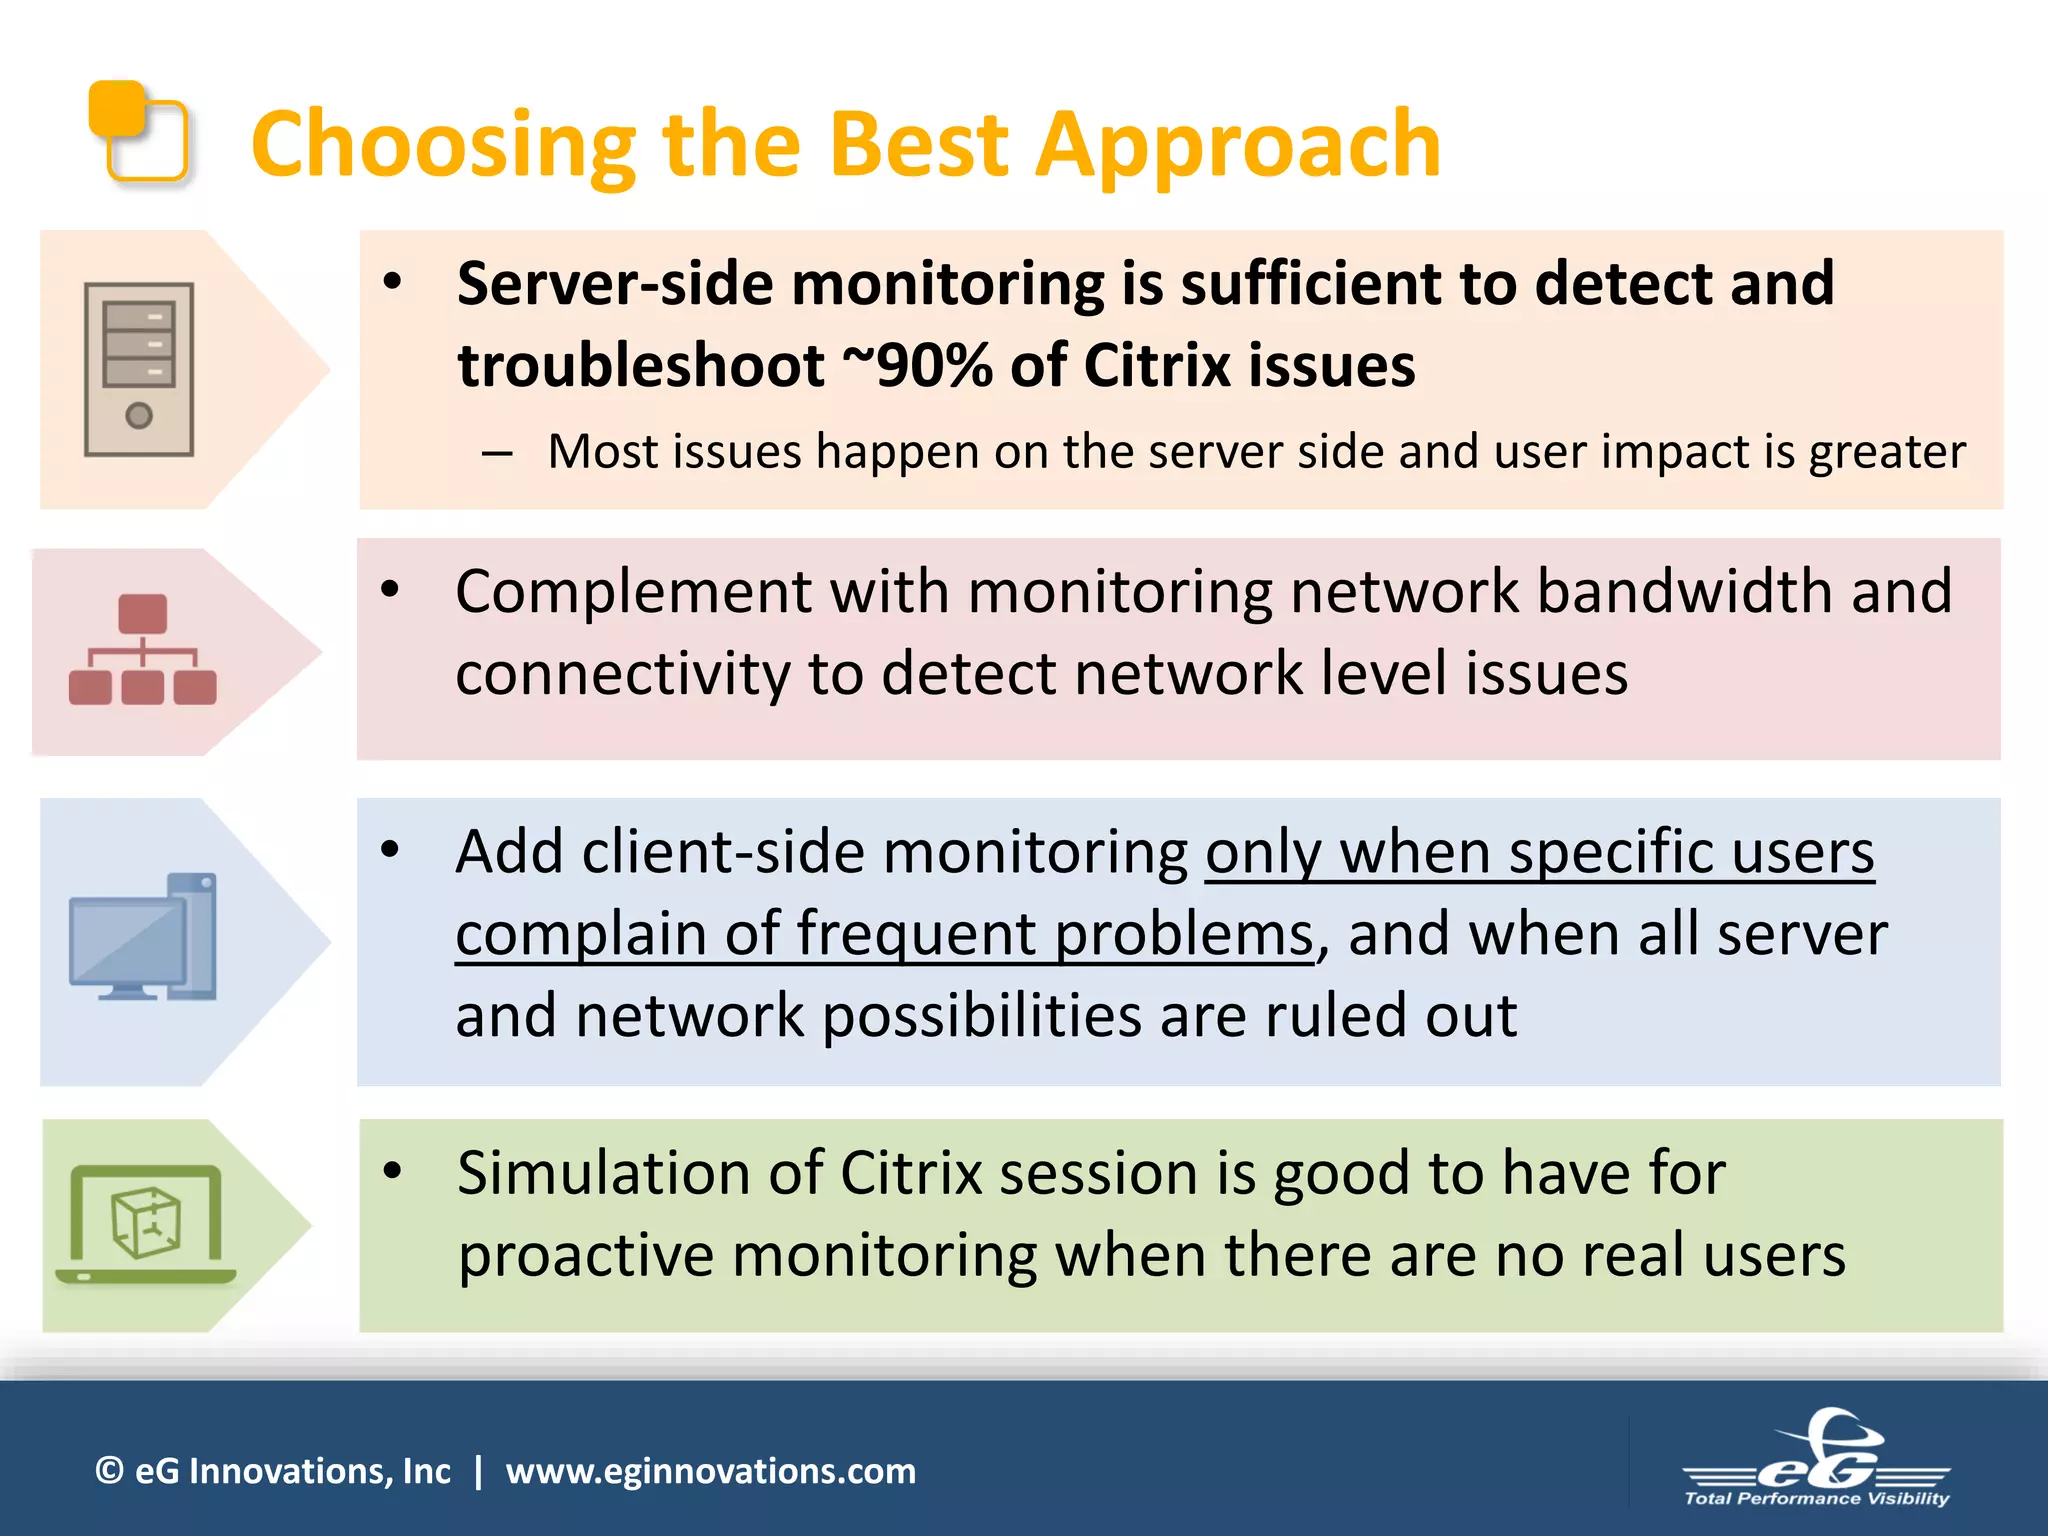
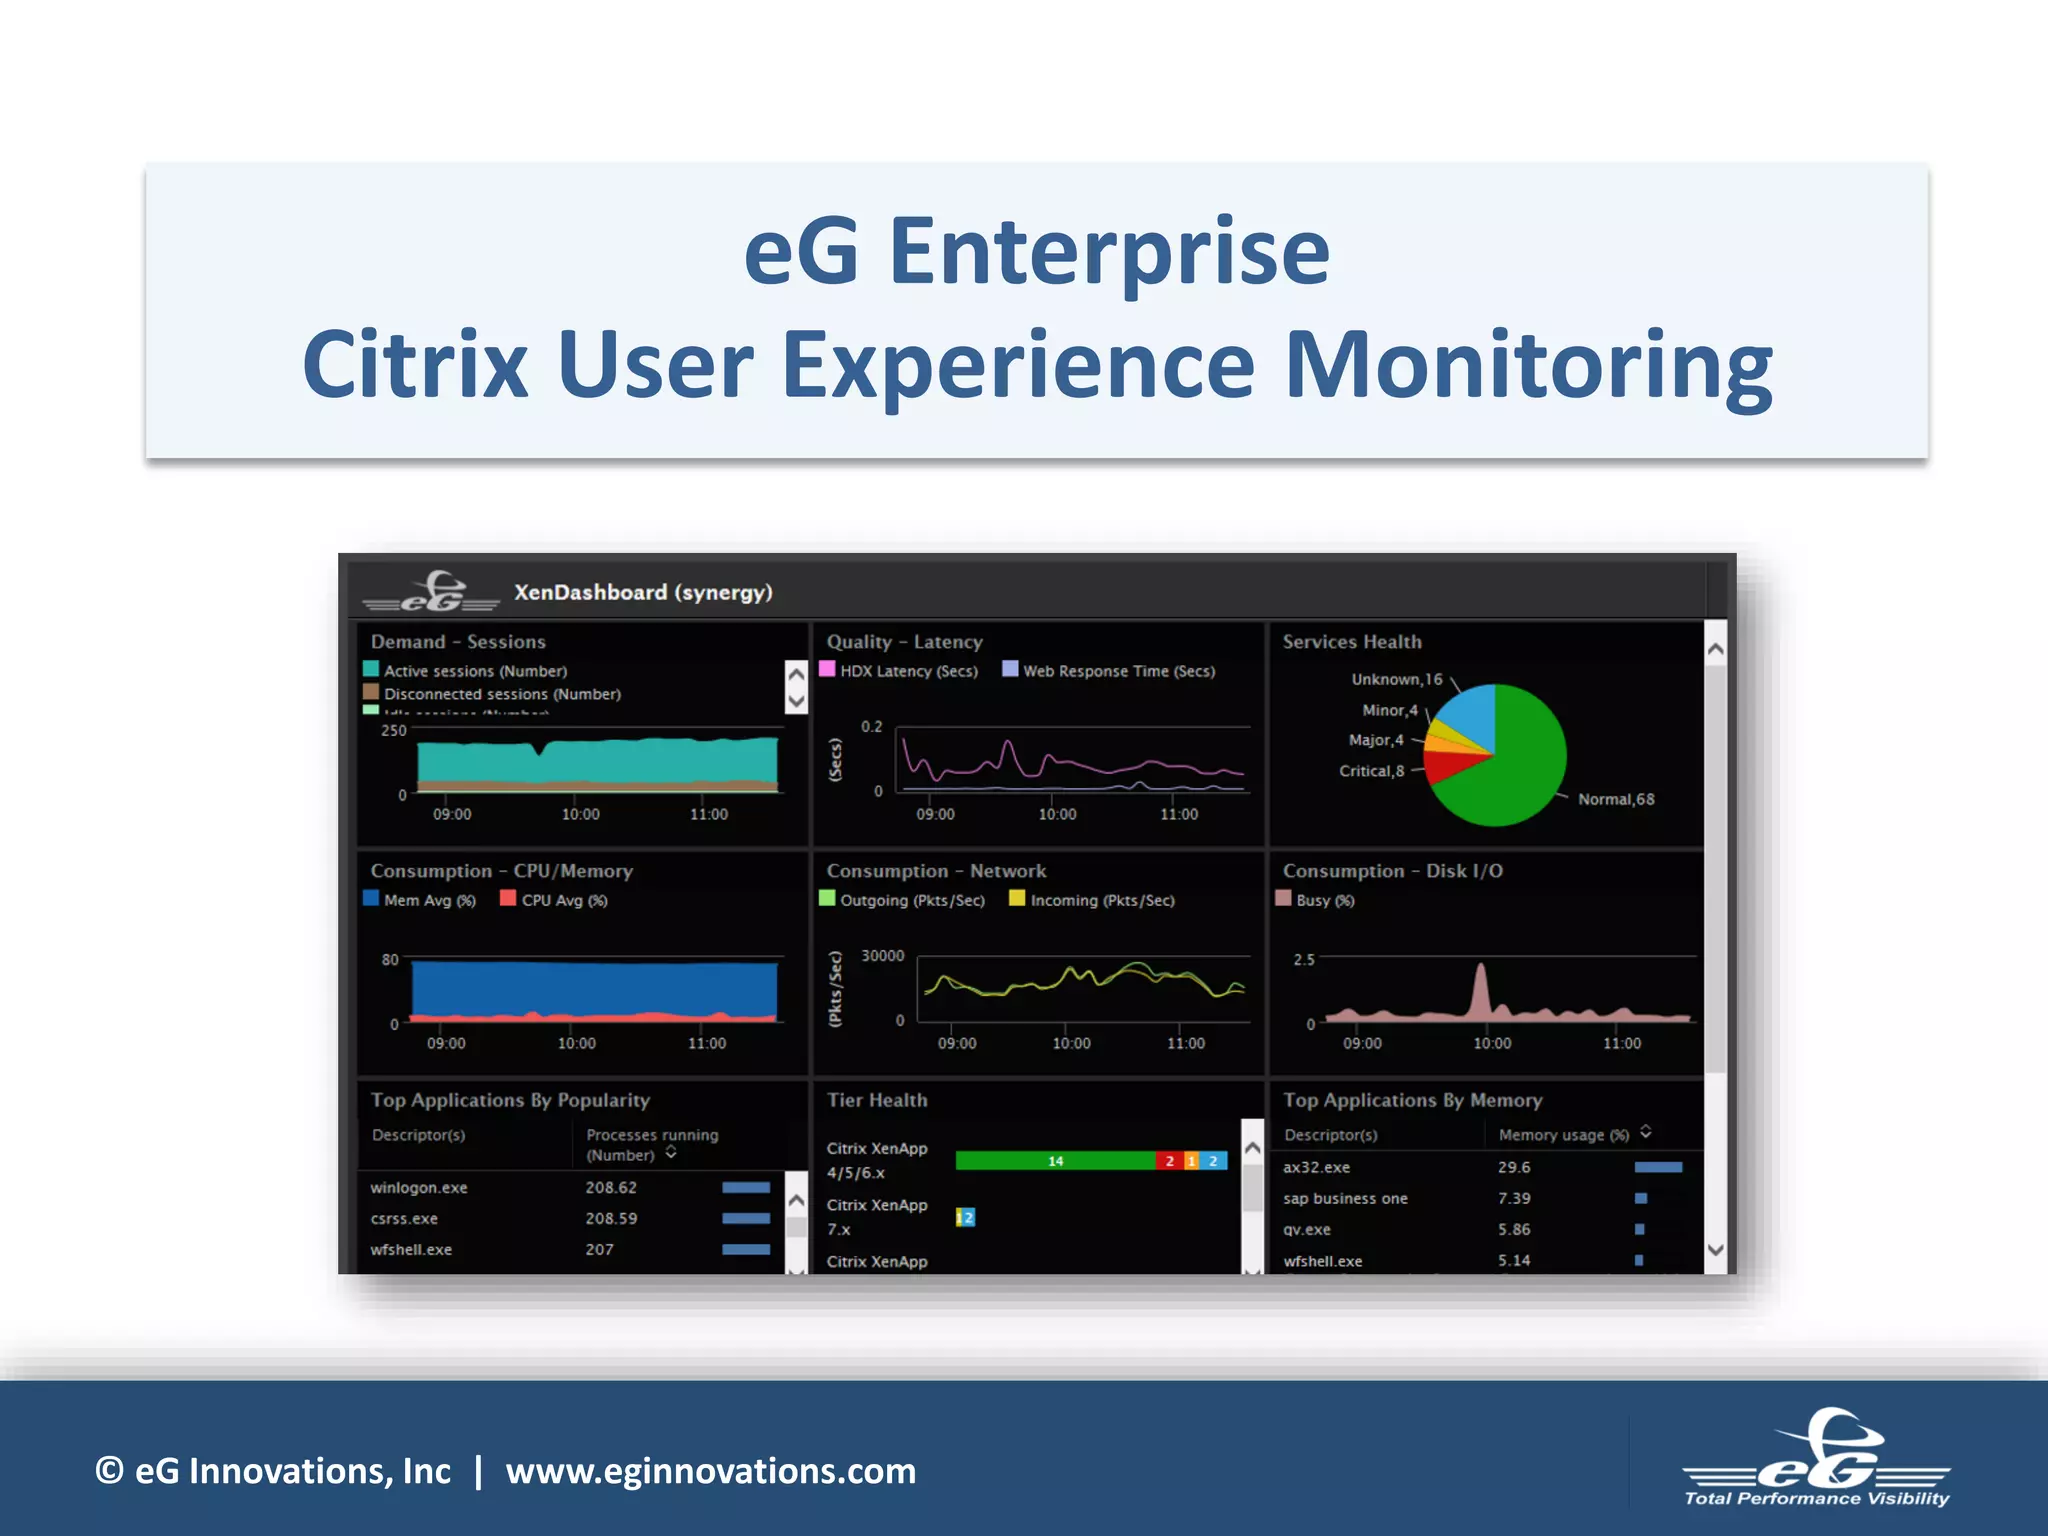
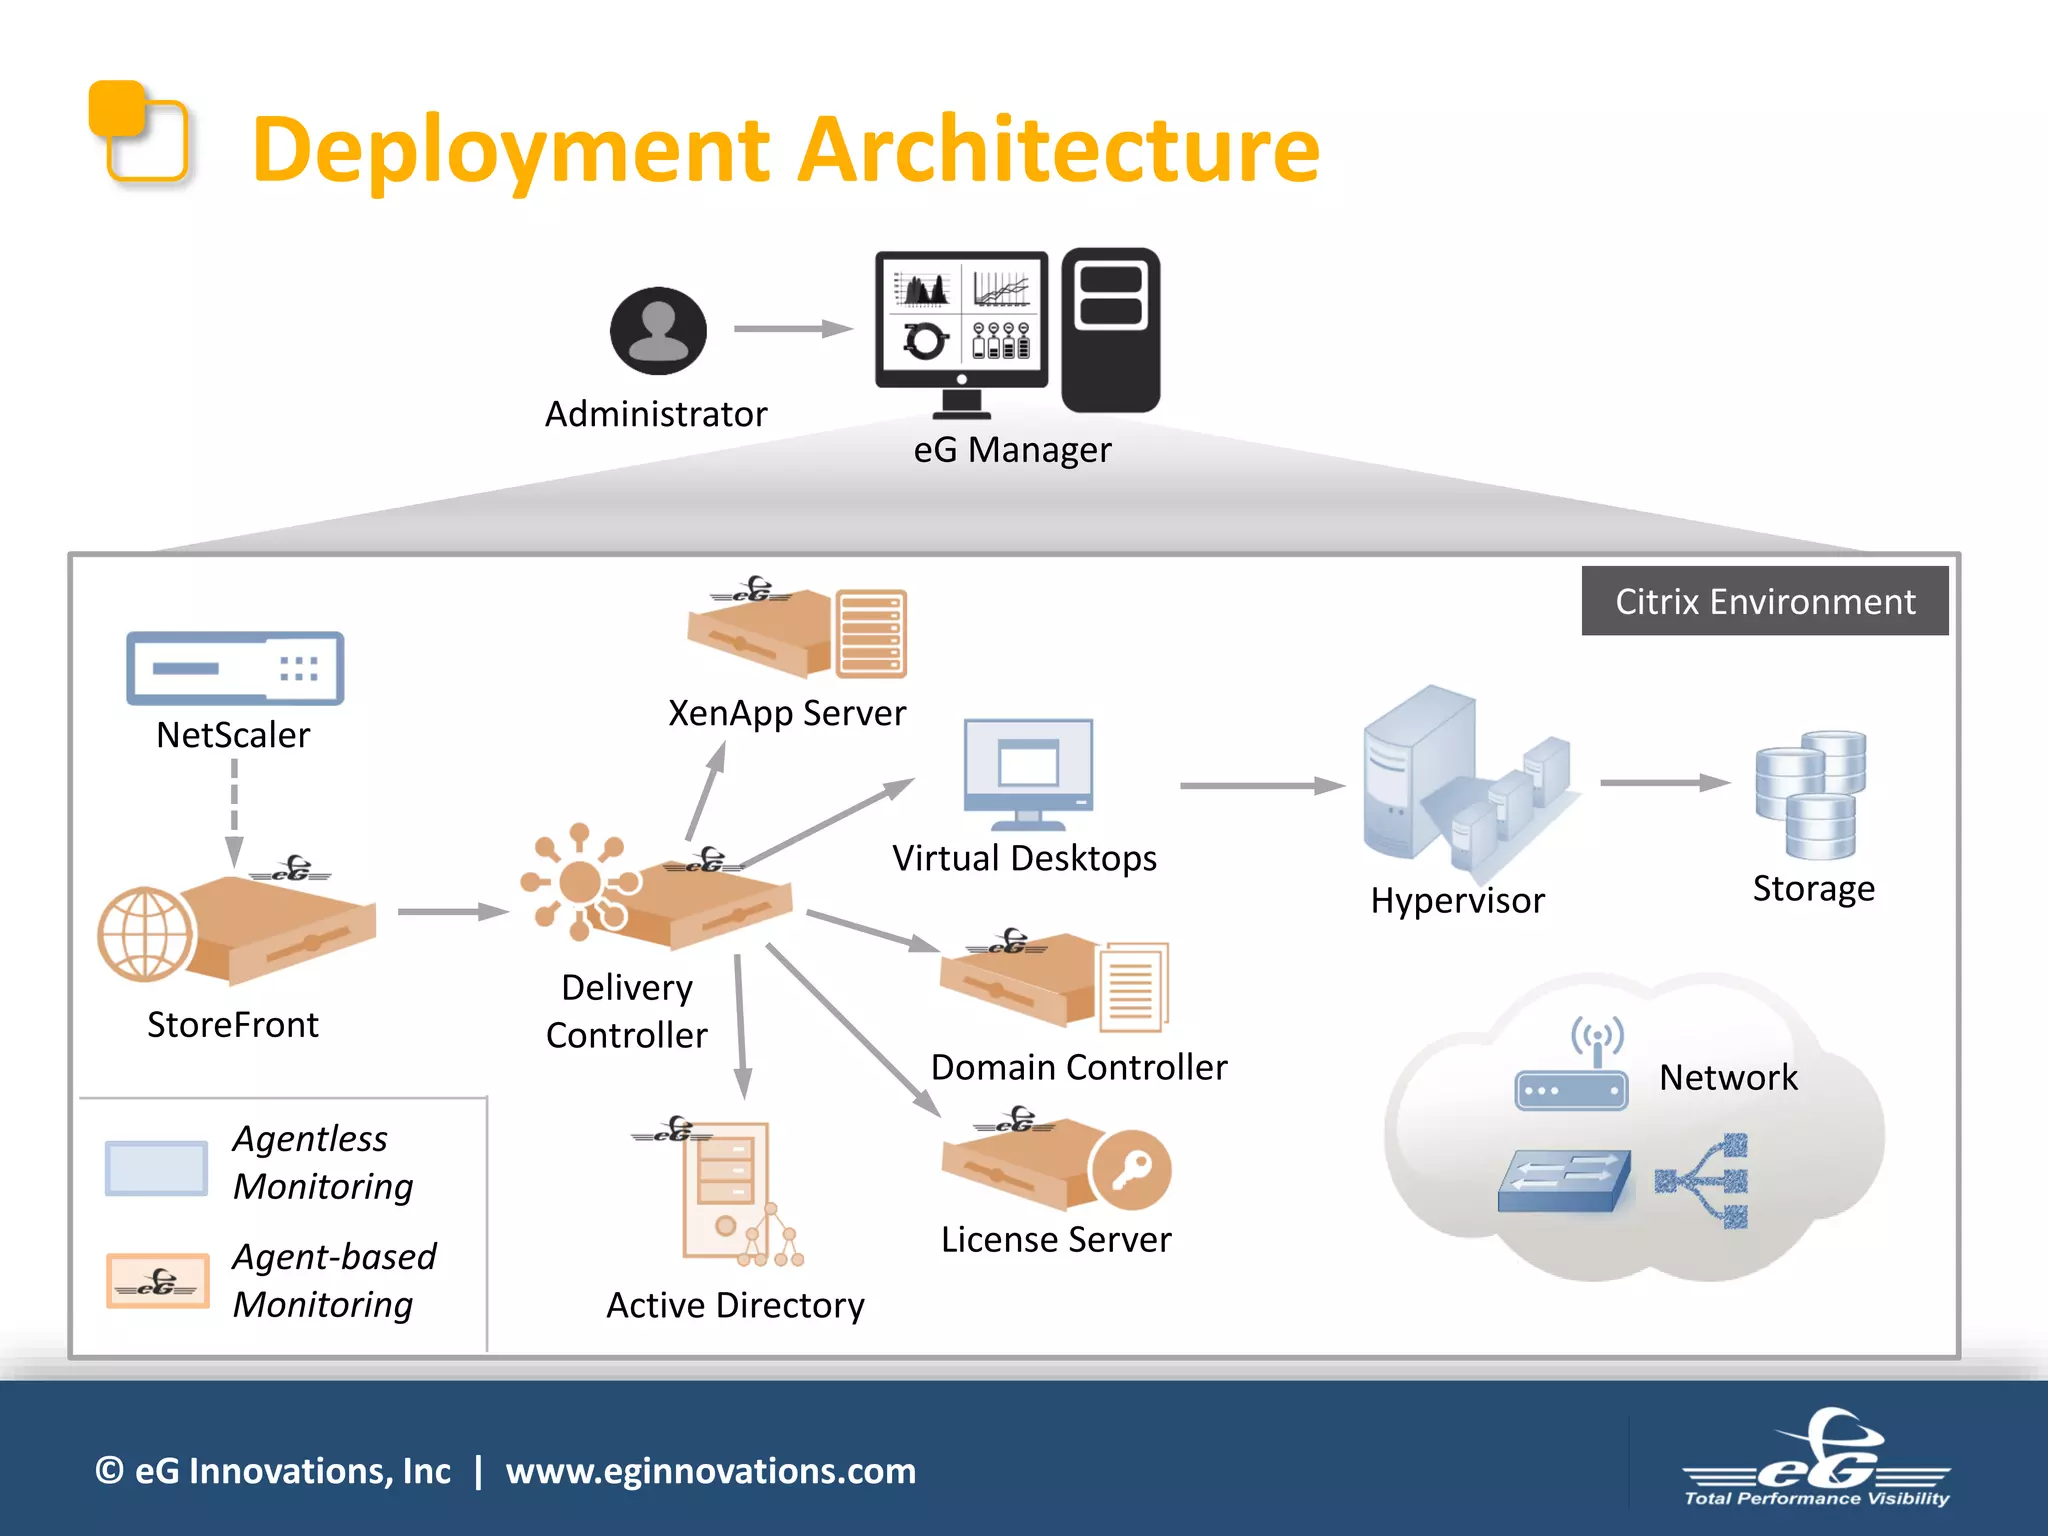
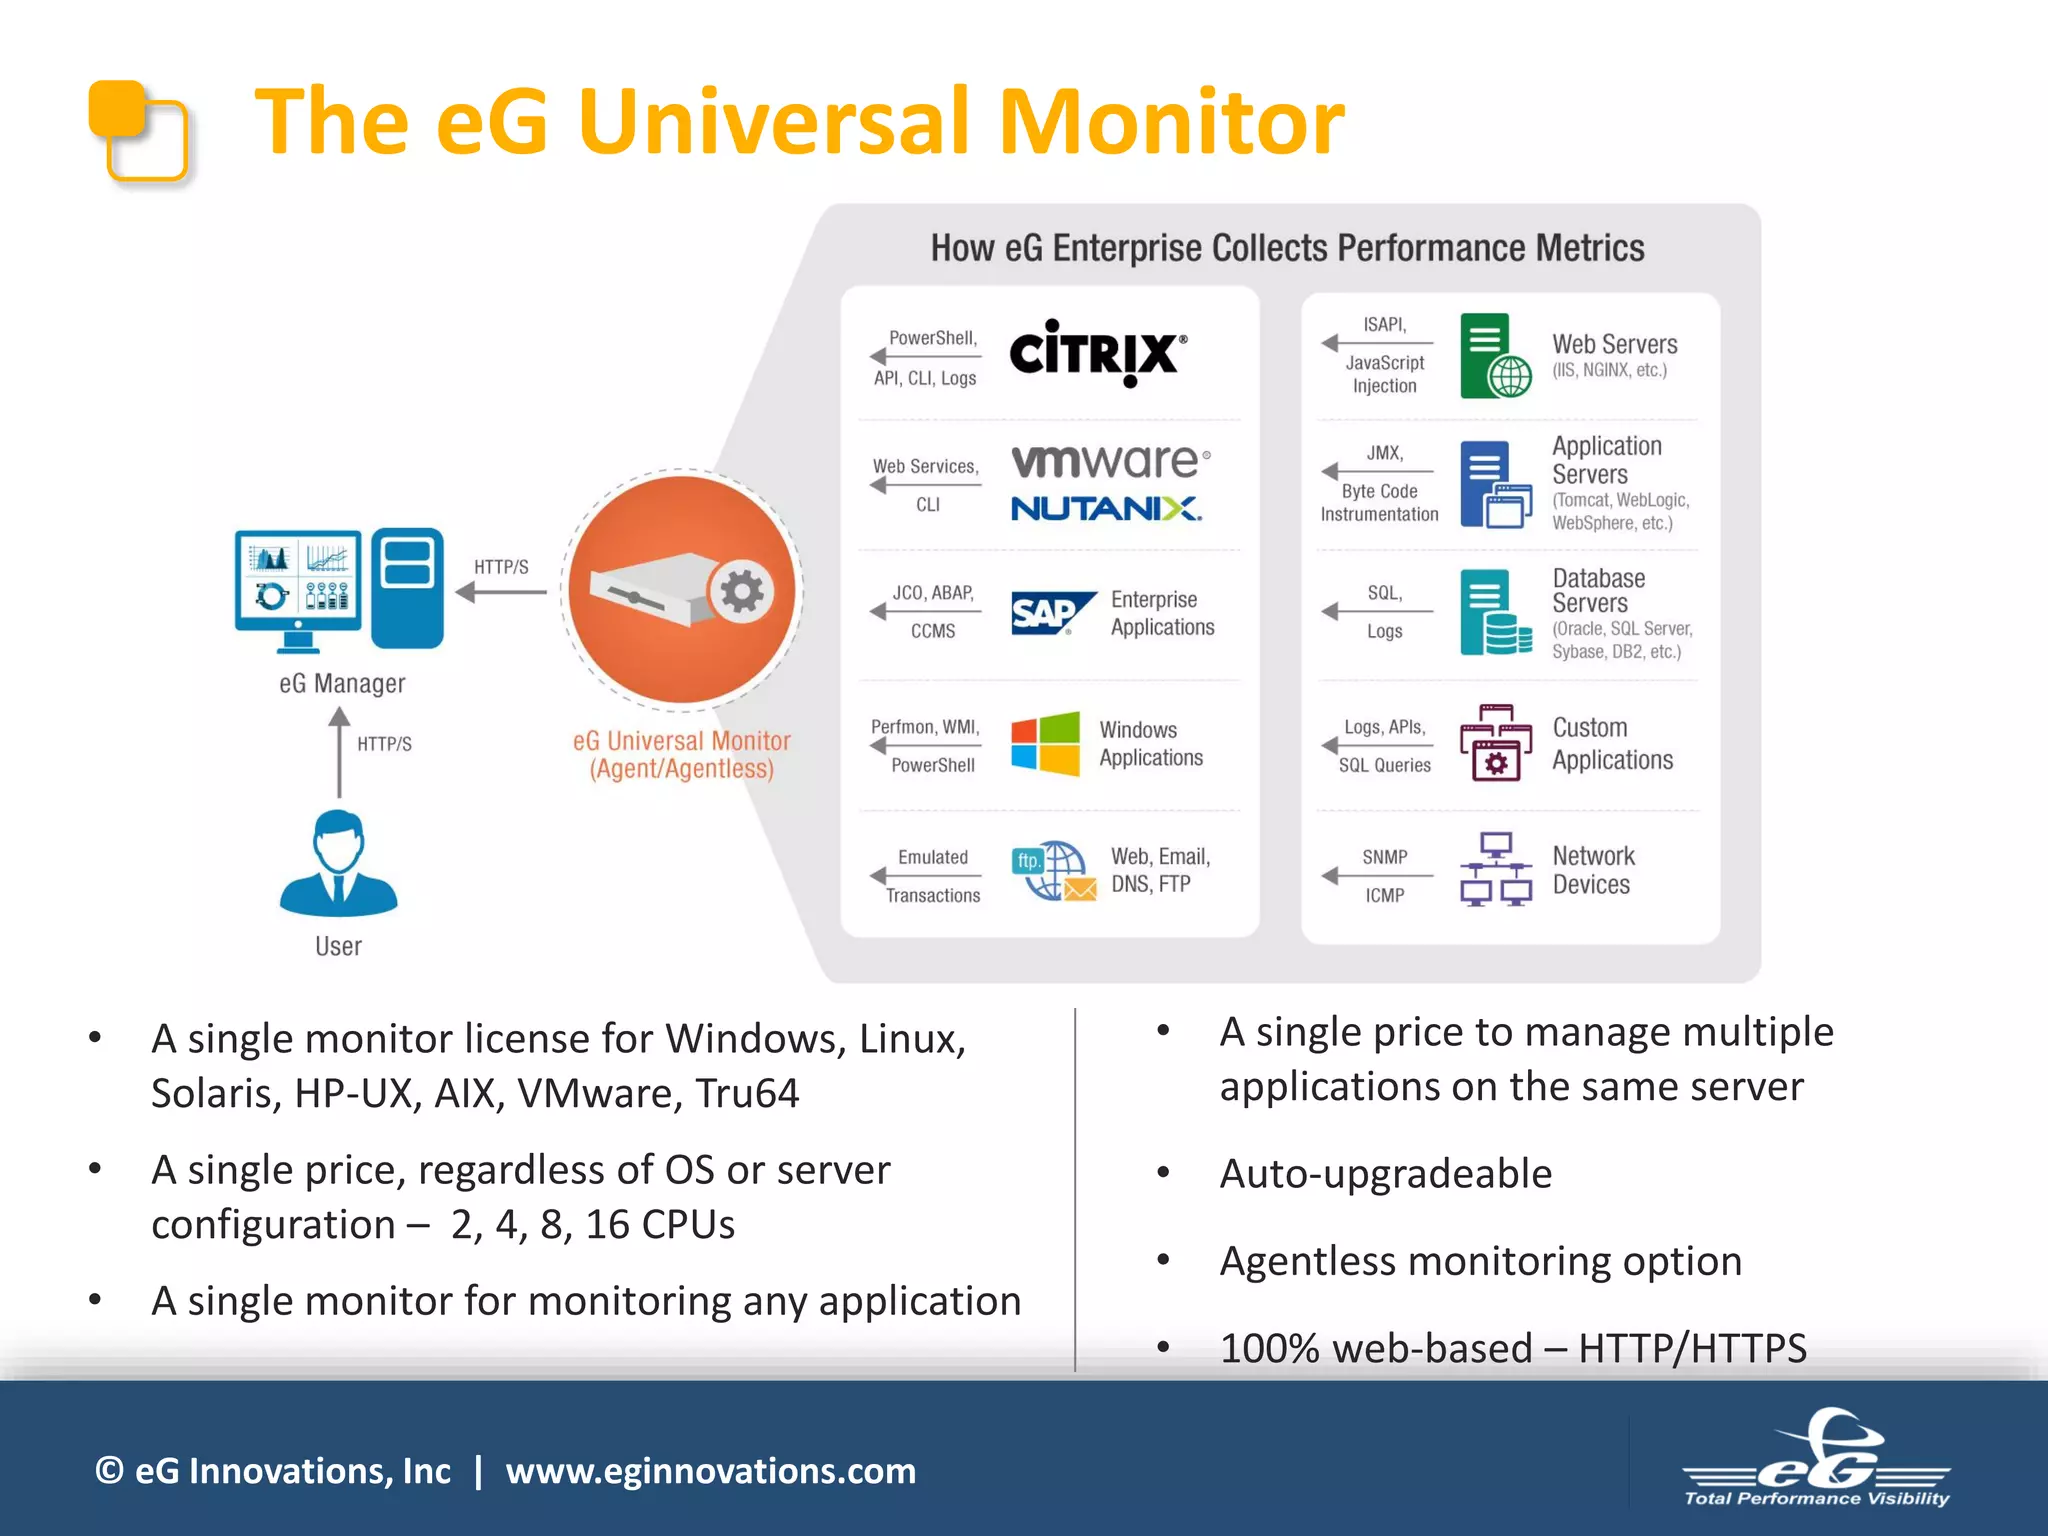
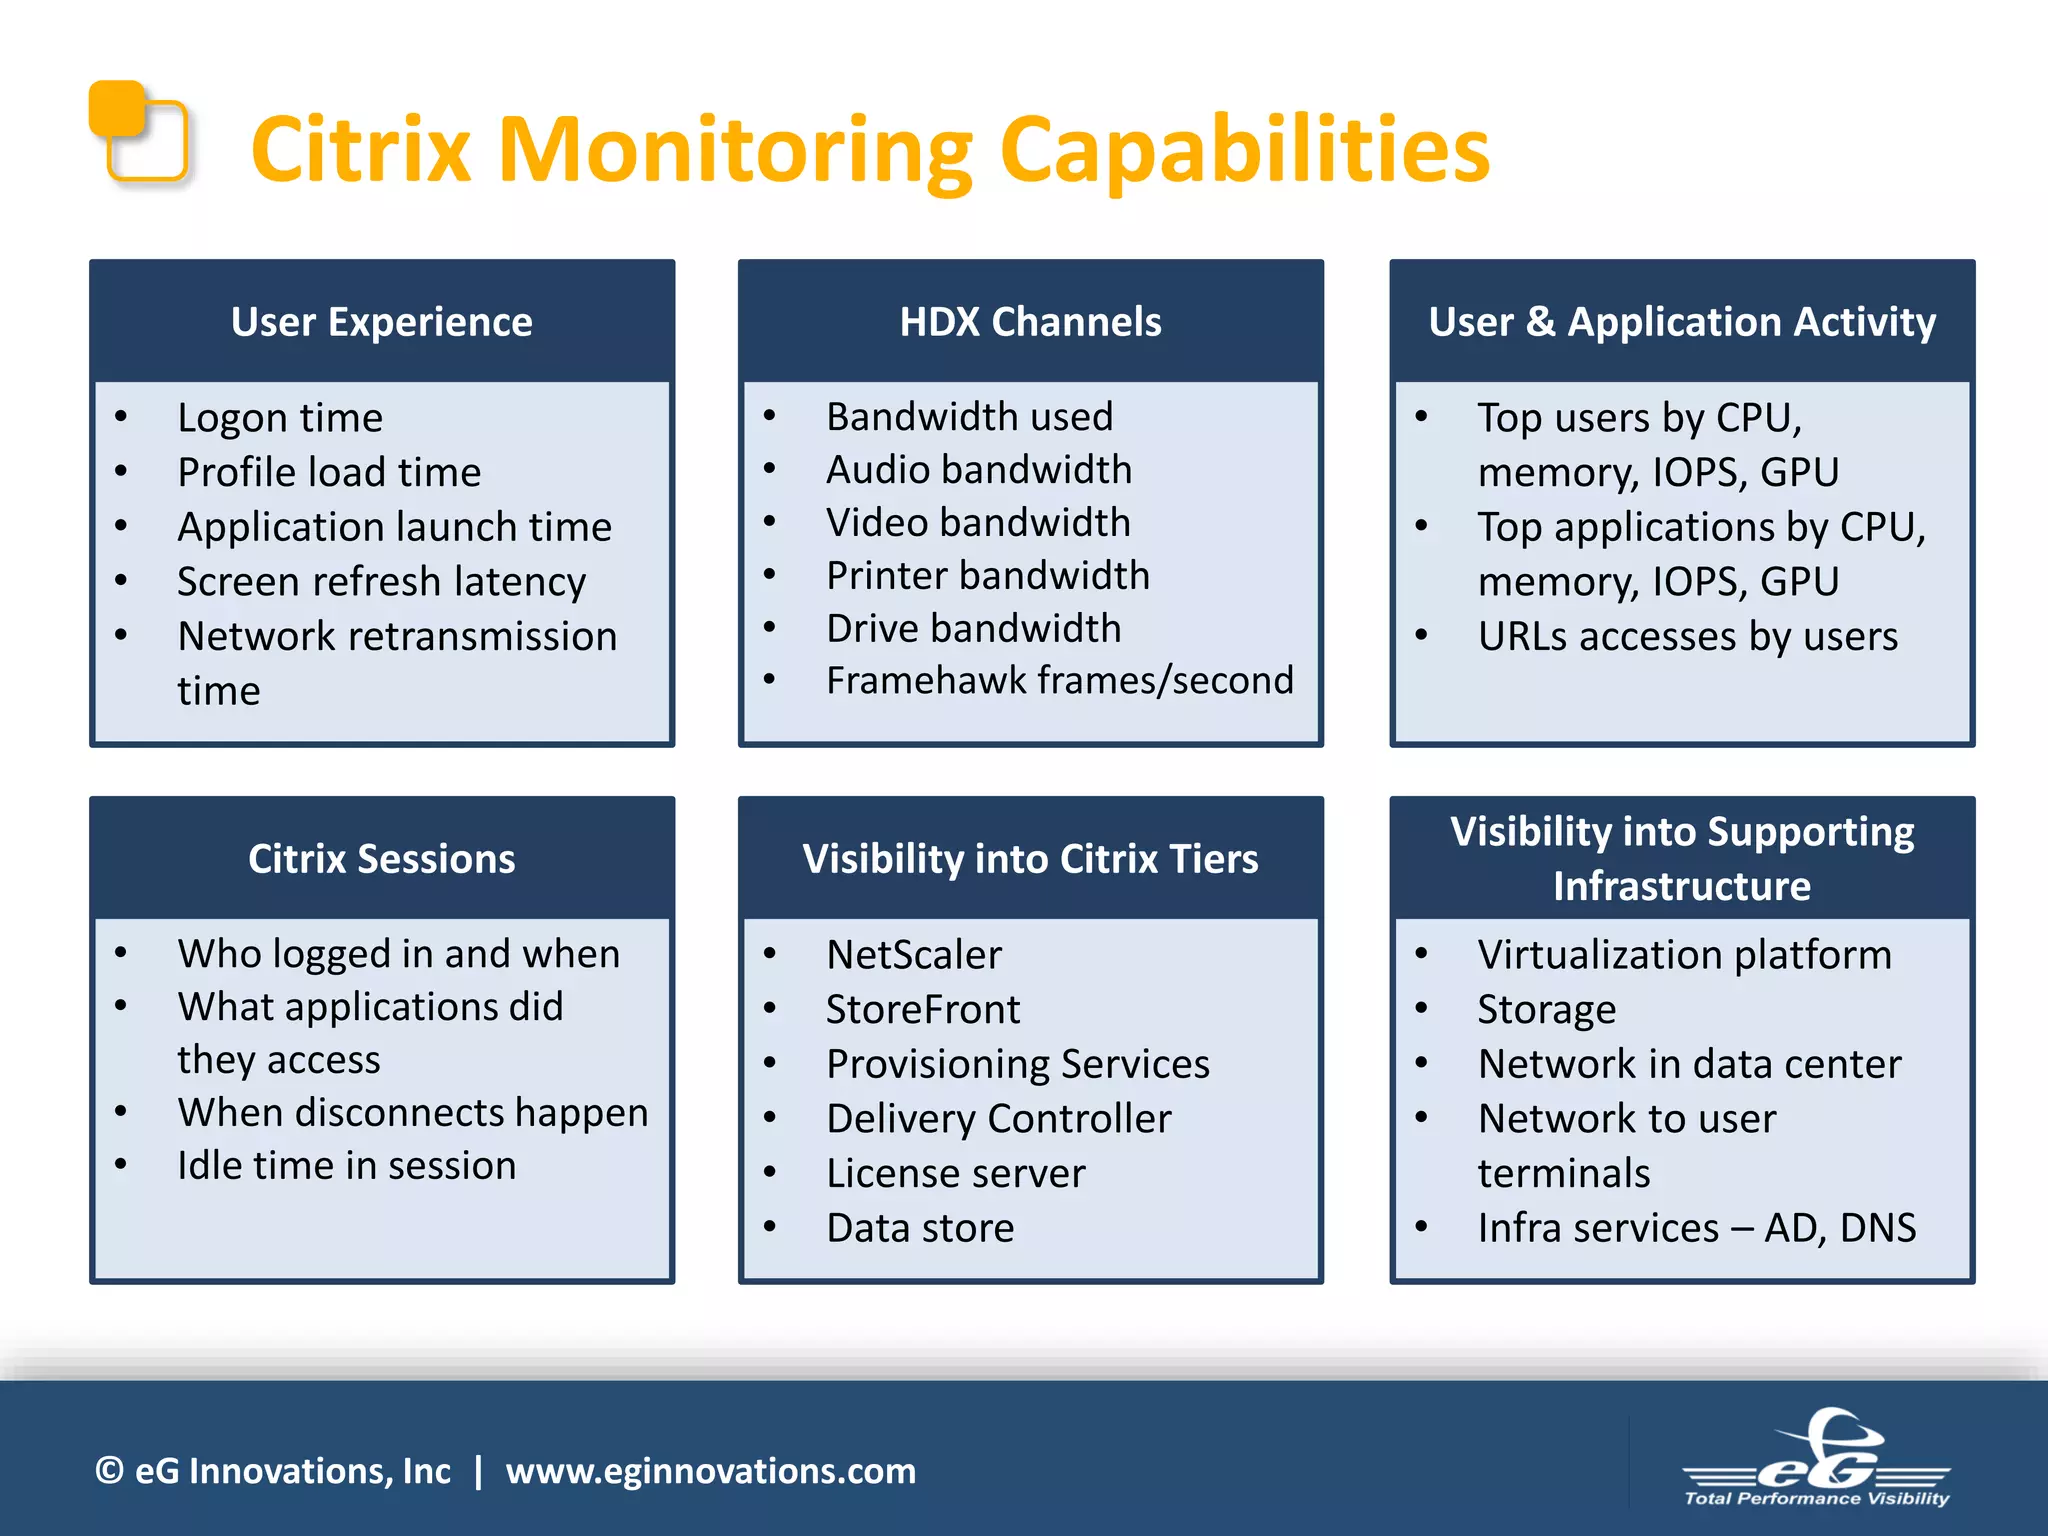
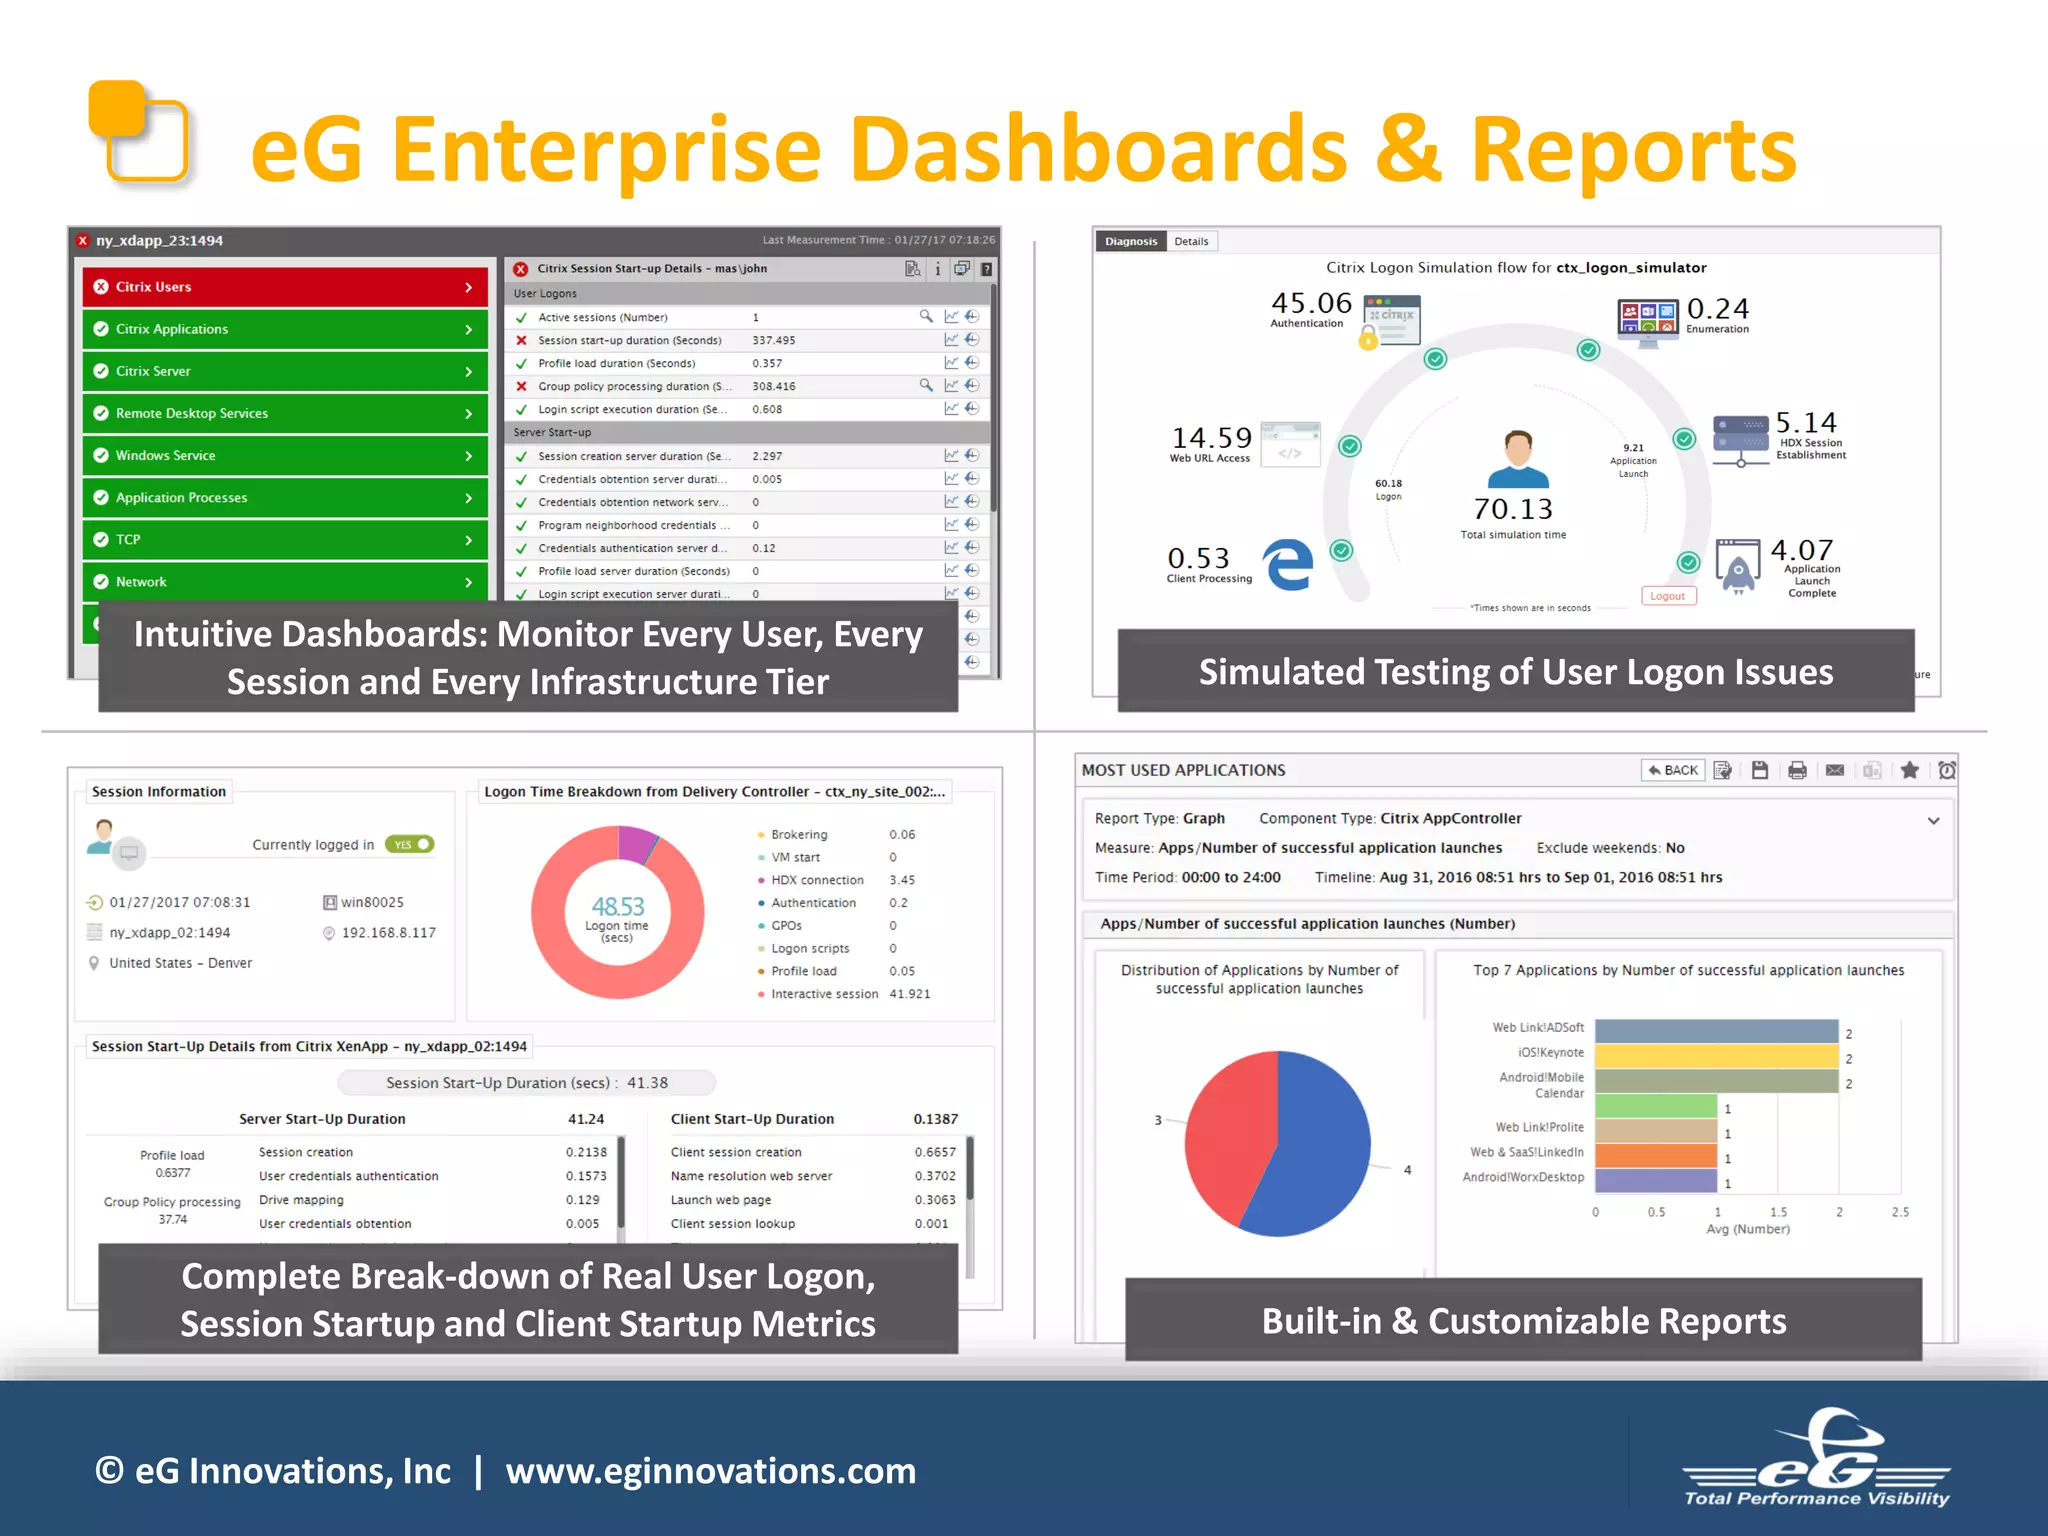


The document discusses the importance of monitoring Citrix user experience due to its sensitivity in enterprise networks, outlining four approaches: monitoring from the network, server side, client side, and simulation. Each approach has its strengths and limitations in terms of user experience visibility and diagnostics, with server-side monitoring being most effective in troubleshooting issues. The document emphasizes the need for a comprehensive monitoring solution tailored for Citrix environments, focusing on user experience, performance metrics, and infrastructure visibility.


![Vibe Coding vs. Spec-Driven Development [Free Meetup]](https://cdn.slidesharecdn.com/ss_thumbnails/vibecodingvsspecdrivendevelopment-251209105622-43f455e7-thumbnail.jpg?width=640&height=640&fit=bounds)


