Downloaded 144 times


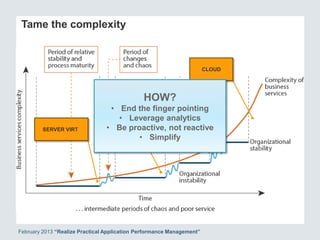
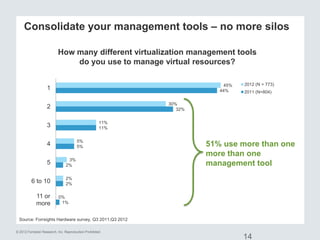
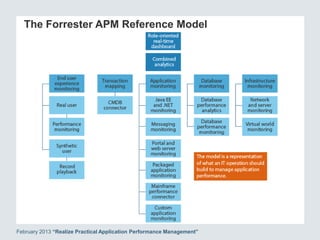
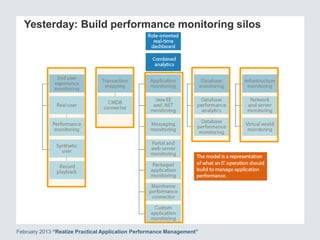
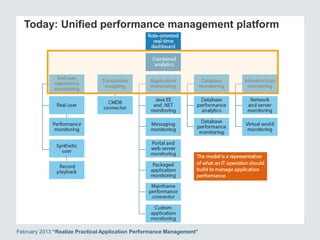


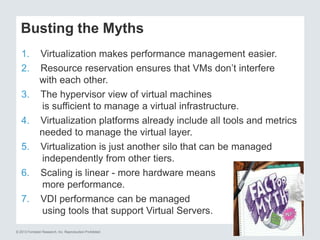


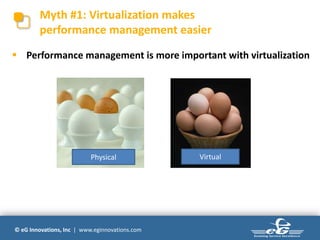
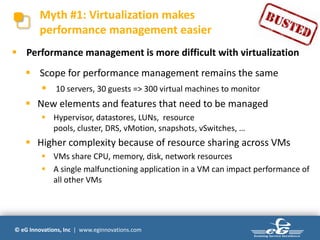


The document outlines seven critical secrets for performance management of virtualized environments, highlighting the increasing complexity of managing performance as virtualization becomes business-critical. It emphasizes the importance of understanding the impact of virtualization on IT performance, user experience, and management tools while addressing common myths and challenges related to virtual environments. The recommendations include adopting a unified performance management strategy to tackle the complexities and improve overall efficiency.