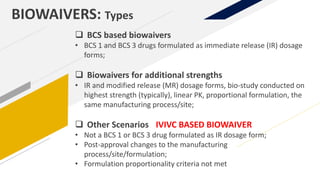
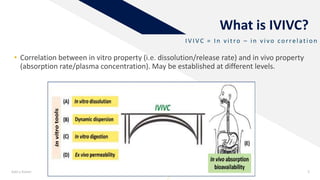
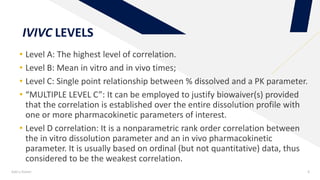
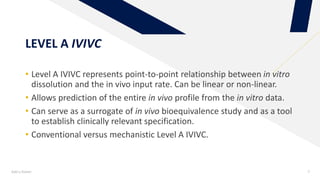
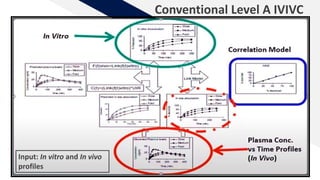
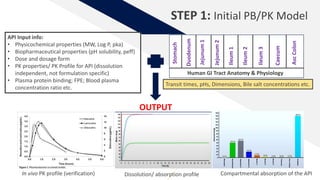
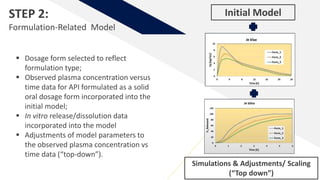
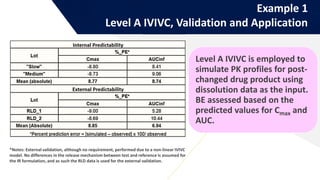
Waiver for bio-studies: Types and requirements;
Levels of IVIVC
Level A IVIVC: Advantages and applications;
Conventional versus mechanistic PBPK based IVIVC;
GastroPlusTM modelling to establish Level A IVIVC:
Level A IVIVC biowaivers – case studies
Challenges and Future Directions
Report Back from SGO 2024: What’s the Latest in Cervical Cancer?
IVIVC: PBPK Simulation and Biowaiver Study Using IVIVC
1. IVIVC
Biowaiver study using
IVIVC: Computational Approach
using Gastro PlusTM
Professor Ruchi Tiwari
PSIT-Pranveer Singh Institute of
Technology (Pharmacy),
Kanpur, Uttar Pradesh, India
2. OUTLINE
Waiver for bio-studies: Types and requirements;
Levels of IVIVC
Level A IVIVC: Advantages and applications;
Conventional versus mechanistic PBPK based IVIVC;
GastroPlusTM modelling to establish Level A IVIVC:
Level A IVIVC biowaivers – case studies
Challenges and Future Directions
• Steps and modelling approach
• Example 1: BCS 2 drug: Formulated as IR tablet
• Example 2: BCS 3 drug: Formulated as ER tablet
• Example 3: BCS 1 drug: Formulated as ER tablet
3. In vitro dissolution/ release is a
surrogate of in vivo bioavailability (BA).
I n v i t r o r e l e a s e / d i s s o l u t i o n p r o f i l e s f o r A P I f o r m u l a t e d a s a n
o r a l d o s a g e f o r m g e n e r a t e d a c r o s s p h y s i o l o g i c a l l y r e l e v a n t p H
g ra d i e n t i n h u m a n G I t ra c t a r e t h e b a s i s f o r B A / B E e v a l u a t i o n .
BIOWAIVERS
Waivers for Bio-study
in Human Subjects
Benefits: Reduced cost of drug development and regulatory burden; no unnecessary
testing in human subjects.
4. BIOWAIVERS: Types
BCS based biowaivers
• BCS 1 and BCS 3 drugs formulated as immediate release (IR) dosage
forms;
Biowaivers for additional strengths
• IR and modified release (MR) dosage forms, bio-study conducted on
highest strength (typically), linear PK, proportional formulation, the
same manufacturing process/site;
Other Scenarios
• Not a BCS 1 or BCS 3 drug formulated as IR dosage form;
• Post-approval changes to the manufacturing
process/site/formulation;
• Formulation proportionality criteria not met
IVIVC BASED BIOWAIVER
5. What is IVIVC?
IVIVC = In vitro – in vivo correlation
• Correlation between in vitro property (i.e. dissolution/release rate) and in vivo property
(absorption rate/plasma concentration). May be established at different levels.
Add a footer 5
6. FR
IVIVC LEVELS
• Level A: The highest level of correlation.
• Level B: Mean in vitro and in vivo times;
• Level C: Single point relationship between % dissolved and a PK parameter.
• “MULTIPLE LEVEL C”: It can be employed to justify biowaiver(s) provided
that the correlation is established over the entire dissolution profile with
one or more pharmacokinetic parameters of interest.
• Level D correlation: It is a nonparametric rank order correlation between
the in vitro dissolution parameter and an in vivo pharmacokinetic
parameter. It is usually based on ordinal (but not quantitative) data, thus
considered to be the weakest correlation.
Add a footer 6
7. FR
LEVEL A IVIVC
• Level A IVIVC represents point-to-point relationship between in vitro
dissolution and the in vivo input rate. Can be linear or non-linear.
• Allows prediction of the entire in vivo profile from the in vitro data.
• Can serve as a surrogate of in vivo bioequivalence study and as a tool
to establish clinically relevant specification.
• Conventional versus mechanistic Level A IVIVC.
Add a footer 7
9. IVIVC
Level A: Based on
Mechanistic PB/PK Modelling
Input info, Steps and Modelling
Approach
10. In vivo PK profile (verification) Dissolution/ absorption profile Compartmental absorption of the API
STEP 1: Initial PB/PK Model
API Input info:
• Physicochemical properties (MW, Log P, pka)
• Biopharmaceutical properties (pH solubility, peff)
• Dose and dosage form
• PK properties/ PK Profile for API (dissolution
independent, not formulation specific)
• Plasma protein binding; FPE; Blood plasma
concentration ratio etc.
Human GI Tract Anatomy & Physiology
Stomach
Duodenum
Jejunum
1
Jejunum
2
Ileum
1
Ileum
2
Ileum
3
Caecum
Asc
Colon
Transit times, pHs, Dimensions, Bile salt concentrations etc.
OUTPUT
11. Initial Model
Simulations & Adjustments/ Scaling
(“Top down”)
STEP 2:
Formulation-Related Model
Dosage form selected to reflect
formulation type;
Observed plasma concentration versus
time data for API formulated as a solid
oral dosage form incorporated into the
initial model;
In vitro release/dissolution data
incorporated into the model
Adjustments of model parameters to
the observed plasma concentration vs
time data (“top-down”).
12. IVIVC
STEP 3: IVIVC
Obtain in vivo
dissolution/absorption profile;
Correlate in vivo
dissolution/absorption profiles with
in vitro dissolution/release profiles;
Validate the correlation model for
internal and external predictability.
14. Dissolution acceptance limits defined by the profiles resulting in BE on upper and lower sides
STEP 5:
Clinically Relevant Specifications
Acceptance criteria for in vitro release/dissolution established to ensure
in vivo bioequivalence. Deconvoluted PK profiles (target, upper and
lower side) are linked with corresponding in vitro dissolution
profiles.
16. Fitness for Purpose:
Objective is to correlate in vitro dissolution/release and in
vivo dissolution/absorption and to use the correlation
model to predict PK parameters for the new batches based
on the in vitro release.
Plasma concentration versus time data obtained on minimum 2-3
formulations with in vitro dissolution/release dependent absorption;
Corresponding in vitro data;
PK data for API (absorption independent on dissolution).
Clinical Data:
“Top down approach”: Clinical data available.
Avoidance of Over-parametrization: Simplification makes the models
useful.
17. Example
1
BCS 2 Drug, Formulated as IR
tablet,
Biowaiver for Post-approval changes
(Manufacturing process)
18. Example 1: Info
A BCS 2 drug,
formulated as IR
tablet.
pH dependent
solubility, almost
completely absorbed.
Metabolized.
Several
bioequivalence
studies conducted.
Change* to the
manufacturing
process proposed.
Another
bioequivalence study
required by the
regulator.
Objective: To ensure that in vivo product performance is unaffected by the
change.
* Type of change unacceptable for a conventional bio-study waiver by the regulator.
19. Example 1:
Resources and Inputs
API Input:
• Physico- chemical and biopharmaceutical properties
• PK properties derived from the “fastest” formulation.
Simulation setup: Dissolution model, z-factor
20. Example 1
GastroPlusTM Modeling and IVIVC
Correlation
“Fastest” formulation exhibits a very
rapid dissolution and is employed to
develop the initial model and derive the
input PK parameters.
“Medium” and “slow”
formulations are used
for IVIVC development.
In Vivo In Vitro (SF= 5)
21. Example 1
Level A IVIVC, Validation and Application
*Notes: External validation, although no requirement, performed due to a non-linear IVIVC
model. No differences in the release mechanism between test and reference is assumed for
the IR formulation, and as such the RLD data is used for the external validation.
Level A IVIVC is employed to
simulate PK profiles for post-
changed drug product using
dissolution data as the input.
BE assessed based on the
predicted values for Cmax and
AUC.
22. Example
2
BCS 3 Drug, Formulated as ER
tablet,
Biowaiver for Post-approval changes
(Process and Additional Dosage Strength)
23. Example 2: Info
A BCS 3 drug, exhibiting
non-linear PK and site
specific saturable
absorption across GI tract;
no metabolism,
bioavailability 30-50%.
Classical Level A IVIVC is a
challenge.
Formulated as a matrix
based ER tablet in two
strengths.
Bioequivalence proven for
both strengths.
Changes* to the
manufacturing process for
one strength.
Objective: To ensure that QTPP is unaffected by the changes.
* Type of change unacceptable for a conventional bio-study waiver by the regulator.
24. Example 2: Resources
In vivo (i.e. plasma concentration versus time) in house data for:
“Slow”, “Medium” and “Fast” formulations, higher dosage strength;
“Immediate” release formulation, higher strength;
Pre-change drug product, lower dosage strength.
In vitro release data generated using bio-indicative test method for:
“Slow”, “Medium” and “Fast” formulations.
Pre and post- change drug product.
25. Example 2
PK profiles for IR, “Slow”, “Medium” and “Fast” formulations
Note: All the profiles obtained for higher dosage strength
“Slow” (T/R= 0.6), “Medium” (T/R= 0.93) and “Fast” (T/R= 1.06)
26. Example 2:
Initial Model
Output
Input Info
Physico- chemical properties;
In house pH solubility data;
PK properties reported in the
literature (plasma protein
binding, blood/ plasma
concentration ratio, peff);
PK parameters derived from IR
formulations
27. Example 2: IVIVC
“Slow” (T/R= 0.6), “Medium” (T/R= 0.93) and “Fast” (T/R= 1.06)
• Saturable, site-specific absorption,
resulting in correlation exhibiting initial
linearity followed by plateau.
• PBPK modelling allows establishment of
Level A IVIVC.
• Validated Level A IVIVC applied to
access impact of changes and justify
bio-waiver for the post-change drug
product.
28. Example
3
BCS 1 Drug, Formulated as ER
tablet,
Biowaiver for Post-approval changes
(Intermediate Dosage Strength)
29. Example 3: Info
A BCS 1 drug, formulated as Er,
matrix based formulation in
multiple strength, LINEAR PK.
Bioequivalence versus RLD
proven for the lowest and highest
strengths. Bio- study also
conducted on IR formulation.
Different release rates observed
in one of the conventional test
media. Is this relevant to the
product in vivo performance?
Biowaiver justification
(conventional) for the
intermediate strengths is
challenged.
30. Example 3:
Input and Initial model
Input Info
API physico-chemical and biopharmaceutical properties.
In house plasma concentration versus time data for IR
formulation and three ER formulations.
PK parameters from literature (protein binding) or
derived from IR formulation are incorporated into model
for ER formulation.
31. Example 3
GastroPlusTM Modeling for ER tablets
Initial Model In vitro test conditions/profiles
reflective of in vivo dissolution
In vivo absorption Acceptance
criteria/spec
32. Example 3
Level A IVIVC
Lowest strength-
bioequivalent,
T/R= 92%
Highest strength-
bioequivalent,
T/R= 110%
Highest strength-
bioequivalent,
T/R= 82%
Validated Level A IVIVC applied to support selection of dissolution test method with bio-indicative
power, establish acceptance criteria and justify biowaiver for intermediate strengths.
33. Challenges
Future
Directions
Optimal utilization of mechanistic PBPK is
restricted by the requirements established
for conventional IVIVC (i.e. development of
correlation model based on individual
subjects data).
Integration of population simulations into
IVIVC development and validation;
Incorporation of virtual BE for IVIVC-based
BE assessment.
35. CONCLUDING POINTS
Mechanistic PBPK based IVIVC can be validated, established and applied
to justify waiver for bioequivalence studies.
A “top-down” modelling approach is found appropriate considering the
amount of clinical data required for IVIVC development and validation.
Applicability of PBPK based IVIVC is illustrated using the case studies
when conventional IVIVC was unsuccessful.
Challenges associated with development and applicability of mechanistic
PBPK based IVIVC may be overcome by incorporating population
simulation and virtual BE platform.