This document discusses various topics related to seismic design, including:
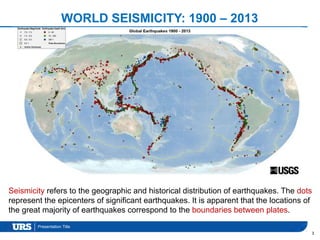
- Seismicity and plate tectonics, which show that most earthquakes occur at plate boundaries.
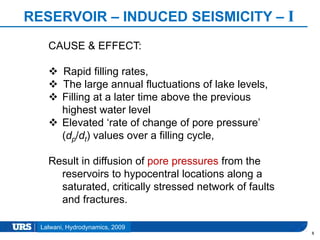
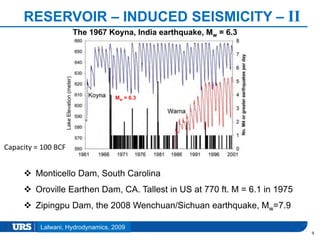
- Different types of earthquakes like intraplate and reservoir-induced seismicity. Reservoir-induced seismicity can occur due to rapid reservoir filling or fluctuations in water level.
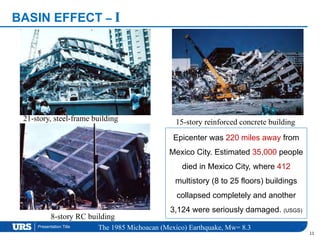
- Effects of soil conditions like basin effects that can amplify seismic ground motions. Soft soils in large basins like Mexico City significantly amplified motions from a distant earthquake, contributing to extensive damage.
- Key geotechnical aspects impacting seismic design like liquefaction, plasticity index, and shear wave velocity and how they relate to soil behavior during earthquakes

![Presentation Title
PLATE TECTONICS
4
Pattern of earthquakes defines the boundaries of tectonic plates.
23 major plates. [USGS]](https://image.slidesharecdn.com/151ef991-419b-416f-83b7-77d5352ab4e4-150815150958-lva1-app6892/85/Seismic-Design-Basics-Superstructure-4-320.jpg)
![Presentation Title
RING OF FIRE
5
Volcanic arcs and oceanic trenches partly encircling the Pacific Basin form the so-called
Ring of Fire, a zone of frequent earthquakes and volcanic eruptions. The Challenger
Deep is the deepest known point in the oceans, with a depth of 35,994 ft (6.82 miles).
[USGS]](https://image.slidesharecdn.com/151ef991-419b-416f-83b7-77d5352ab4e4-150815150958-lva1-app6892/85/Seismic-Design-Basics-Superstructure-5-320.jpg)
![Presentation Title
Earthquakes in the Midwestern and Eastern United States?!
6
Intraplate Earthquakes
1) 8/23/2011 – Earthquake in Washington, D. C., Mw = 5.8
2) 8/23/2011 – Earthquake in Colorado, Mw = 5.3
3) 1980 – 5 earthquakes recorded N. of Philadelphia, PA
4) 1979 & 1980 – New York State and the adjacent areas
experienced 131 earthquakes of magnitude 1 to 5
5) 1931 – Valentine, Texas, magnitude 6.4 earthquake.
6) 1884 – New York City area
7) 1886, Charleston, South Carolina. Estimated
magnitude 6.8. Soil liquefaction.
8) 1811 & 1812 -- New Madrid, Missouri (7.2 ≤ M ≤ 8.3).
Soil liquefaction.
[www.geo.mtu.edu]](https://image.slidesharecdn.com/151ef991-419b-416f-83b7-77d5352ab4e4-150815150958-lva1-app6892/85/Seismic-Design-Basics-Superstructure-6-320.jpg)
![Presentation Title
INTRAPLATE EARTHQUAKE
7
• An intraplate earthquake is an earthquake that
occurs in the interior of a tectonic plate, whereas
an interplate earthquake is one that occurs at a
plate boundary.
• Intraplate earthquakes are not well understood.
the causative fault is deeply buried, and
sometimes cannot even be found.
• Examples, the 1811-1812 earthquakes in New
Madrid, Missouri; Charleston, South Carolina
(1886) and Gujarat, India (2001).
Intraplate Earthquakes
[Wikipedia]](https://image.slidesharecdn.com/151ef991-419b-416f-83b7-77d5352ab4e4-150815150958-lva1-app6892/85/Seismic-Design-Basics-Superstructure-7-320.jpg)
![Presentation Title
Source-averaged basin amplification is period-dependent,
with the highest amplifications occurring for the longest
periods and greatest basin depths.
Relative to the very-hard rock reference structure, general
maximum amplification is about a factor of 8. At Mexico
city (1985 Michoacan earthquake), seismic motion was
amplified up to a factor of 60 compared to the bedrock.
[Aviles and Perez-Rocha 1998]
12
BASIN EFFECT – II
The 1985 Michoacan (Mexico) Earthquake, Mw= 8.3](https://image.slidesharecdn.com/151ef991-419b-416f-83b7-77d5352ab4e4-150815150958-lva1-app6892/85/Seismic-Design-Basics-Superstructure-12-320.jpg)
![Presentation Title
BASIN EFFECT – III
13
[Aviles and Perez-Rocha 1998]
Map of seismic zonation and isoperiod
curves (in sec) of Mexico City
Zone Depth
(ft)
Eff. Vs
(ft/s)
Predominant
period (s)
Transition 43 285 0.6
Lake 125 250 2.0
Deep Lake 185 200 3.4
Characteristics of the soil profiles
• Extremely soft, saturated surface clays
• At some places Plasticity Index ≈ 300
• Friction angles as low as, ϕ = 5-15o
BASIN EFFECT
The 1985 Michoacan (Mexico) Earthquake, Mw= 8.3](https://image.slidesharecdn.com/151ef991-419b-416f-83b7-77d5352ab4e4-150815150958-lva1-app6892/85/Seismic-Design-Basics-Superstructure-13-320.jpg)
![Presentation Title
SAN ANDREAS FAULT, CA
14
[USGS]
The San Andreas
(strike-slip) fault zone
separates the Pacific
and North American
Plates, which are
slowly grinding past
each other in a roughly
north-south direction.
The Pacific Plate
(western side of the
fault) is moving
horizontally in a
northerly direction
relative to the North
American Plate
(eastern side of the
fault)](https://image.slidesharecdn.com/151ef991-419b-416f-83b7-77d5352ab4e4-150815150958-lva1-app6892/85/Seismic-Design-Basics-Superstructure-14-320.jpg)
![Presentation Title
16
Niigata, Japan 1964 Alaska 1964: Surface rupture
Geotechnical Failures
[USGS]
Soil liquefaction describes a phenomenon
whereby a saturated soil substantially loses
strength and stiffness in response to an
applied stress, usually earthquake shaking
or other sudden change in stress condition,
causing it to behave like a liquid.
ANIMATION SLIDE](https://image.slidesharecdn.com/151ef991-419b-416f-83b7-77d5352ab4e4-150815150958-lva1-app6892/85/Seismic-Design-Basics-Superstructure-16-320.jpg)
![Presentation Title
SHEAR WAVE VELOCITY, VS
19
S-wave (secondary wave, Shear Wave, transverse wave)
velocity is given by: ,
μ = the shear modulus and ρ = the density of the material.
SV
[Stokoe, et al 2003]
• S-waves cannot travel through a fluid, since a fluid cannot support shear.
• Magnitude of shear wave velocity is used in soil classification.](https://image.slidesharecdn.com/151ef991-419b-416f-83b7-77d5352ab4e4-150815150958-lva1-app6892/85/Seismic-Design-Basics-Superstructure-19-320.jpg)
![Presentation Title
23
Site
Class SOIL TYPE AND PROFILE
A Hard rock with measured shear wave velocity, Vs > 5000 ft/sec
B Rock with 2500 ft/sec < Vs < 5000 ft/sec
C
Very dense soil & soil rock with 1200 ft/s < Vs < 2500 ft/s, or
with either N > 50 blows/ft or Su > 2.0 ksf
D
Stiff soil with 600 ft/sec < Vs < 1200 ft/sec, or
with either 15 blows/ft < N < 50 blows/ft or 1 ksf < Su < 2 ksf
E
Soil profile with Vs < 600 ft/sec, or with either N < 15 blows/ft or
Su < 1.0 ksf, or any profile with more than 10 ft of soft clay
defined as soil with PI > 20, w > 40%, and Su < 0.5 ksf.
F
Soils requiring site-specific ground motion response evaluation:
• Peats or highly organic clays (H > 10 ft of peat or highly
organic clay, where H = thickness of soil)
• Very high plasticity clays (H > 25 ft with PI > 75)
• Very thick soft/medium stiff clays (H > 120 ft)
Vs = shear wave velocity, Su = undrained shear strength, PI = plasticity index,
w = moisture content, N = std penetration test (SPT) blow count
[Table 3.4.2.1-1 of AASHTO LRFD Seismic Bridge Design, 2012]](https://image.slidesharecdn.com/151ef991-419b-416f-83b7-77d5352ab4e4-150815150958-lva1-app6892/85/Seismic-Design-Basics-Superstructure-23-320.jpg)
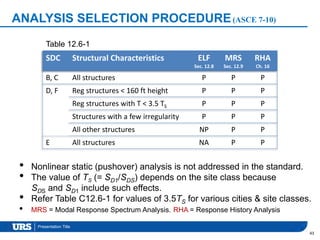
![Presentation Title
SEISMIC DESIGN CATEGORY (SDC)
24
[C11.6, ASCE 7-10]
There are various correlations of the qualitative Modified
Mercalli Intensity (MMI) with quantitative characterizations
of ground-shaking limits for the various SDCs.
MMI V No real damage SDC A 0< SM1 <0.1g
MMI VI Light nonstructural damage SDC B 0.1g<SM1<0.2g
MMI VII Hazardous nonstructural damage SDC C 0.2g<SM1<0.3g
MMI VIII Hazardous damage to susceptible structures SDC D 0.3<SM1<1.12g
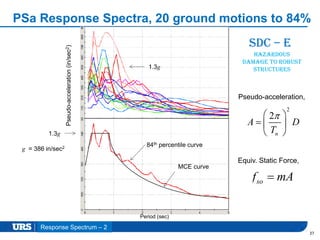
MMI IX Hazardous damage to robust structures SDC E SM1 > 1.125g](https://image.slidesharecdn.com/151ef991-419b-416f-83b7-77d5352ab4e4-150815150958-lva1-app6892/85/Seismic-Design-Basics-Superstructure-24-320.jpg)
![Presentation Title
SEISMIC DESIGN CATEGORY (SDC)
25
• SDCs perform one of the functions of the Seismic Zones
used in earlier U.S. building codes.
• To step progressively from simple, easy and minimums to
more sophisticated, detailed, and costly requirements as
both the level of seismic hazard and the consequence of
failure escalate.
• SDCs also are dependent on a building’s Occupancy
Category and, therefore, its desired performance.
• To simplify building regulation by assigning the same SDC
regardless of the structural type.
[C11.6, ASCE 7-10]](https://image.slidesharecdn.com/151ef991-419b-416f-83b7-77d5352ab4e4-150815150958-lva1-app6892/85/Seismic-Design-Basics-Superstructure-25-320.jpg)
![Presentation Title
SEISMIC DESIGN CATEGORY (SDC)
26
[C11.6, ASCE 7-10]
• The ground motions used to define the SDCs include the
effects of individual site conditions on probable ground-
shaking intensity.
• Structures are assigned to a SDC based on the more
severe condition determined from SM1, 1-second
acceleration and SMS, short-period acceleration.
• For SDC E, SM1 > 1.125g. This generally occurs in
near-fault area, i.e., less than 15 miles from fault-rupture.
• Most SDC F occur over liquefiable soil (Soil type F).](https://image.slidesharecdn.com/151ef991-419b-416f-83b7-77d5352ab4e4-150815150958-lva1-app6892/85/Seismic-Design-Basics-Superstructure-26-320.jpg)
![Presentation Title
MCER 1-second spectral response acceleration parameter, SM1 (%g)
27
Map with associated regions of Seismic Design Category, assuming
Site Class D conditions. [FEMA P-750 (2009) NEHRP Recommended Seismic Provisions.]](https://image.slidesharecdn.com/151ef991-419b-416f-83b7-77d5352ab4e4-150815150958-lva1-app6892/85/Seismic-Design-Basics-Superstructure-27-320.jpg)
![Presentation Title
MCER 1-second spectral response acceleration parameter, SM1 (%g)
28
Map with associated regions of Seismic Design Category, assuming
Site Class D conditions for California sites. [FEMA P-750 (2009) NEHRP]](https://image.slidesharecdn.com/151ef991-419b-416f-83b7-77d5352ab4e4-150815150958-lva1-app6892/85/Seismic-Design-Basics-Superstructure-28-320.jpg)
![Presentation Title
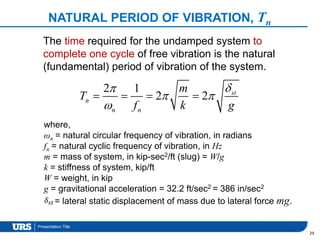
PERIOD DETERMINATION
30
The fundamental period of vibration of the structure T, is used to
determine the design base shear as well as the exponent k that
establishes the distribution of the shear along the height of the structure.
(1) Ta = 0.1N for structures not exceeding 12 stories in height. (Eq. 12.8.8)
(2) (sec) (Eq. 12.8-7)
where hn is the height in ft and the coefficients (0.016 < Ct < 0.03)
and (0.75 < x < 0.9) are determined from Table 12.8-2.
(3) For masonry or concrete shear wall structures, (Eq. 12.8.9)
(4) For a single column bent, (AASHTO 2014, Eq. A-4, A-3, A-5)
where and (ft)
(5) Period of bridge may be determined from Sec. 5.4.2 of AASHTO 2014
[Sec. 12.8 of ASCE 7-10 & AASHTO 2014]
ta
x
nT C h
0.0019
w
a nT h
C
1
22
s COLUMN
r
W W
T
gK
r
F
K
2
2
0.85
4
a
T
S
](https://image.slidesharecdn.com/151ef991-419b-416f-83b7-77d5352ab4e4-150815150958-lva1-app6892/85/Seismic-Design-Basics-Superstructure-30-320.jpg)
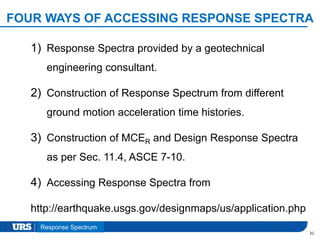
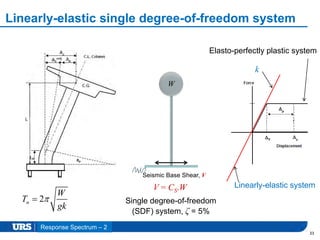
![Presentation Title
RESPONSE SPECTRUM – I
32
[2007]This Response Spectrum is used for North Ramp at St. George Ferry Terminal
Response Spectrum – 1](https://image.slidesharecdn.com/151ef991-419b-416f-83b7-77d5352ab4e4-150815150958-lva1-app6892/85/Seismic-Design-Basics-Superstructure-32-320.jpg)
![Presentation Title
MCER AND DESIGN RESPONSE SPECTRUM – III
38
[Sec C11.2, ASCE 7-10]
MCER = Risk-targeted Maximum Considered Earthquake Ground Motion.
Design Response Spectrum shall be determined by dividing ordinates of
MCER response spectrum by 1.5.
Response Spectrum – 3
The MCER ground motions are based on the 2008
USGS seismic hazard maps and also incorporate
three technical changes to previous ASCE/SEI 7-05:
1) Use of risk-targeted ground motions,
2) Use of maximum direction ground motions, and
3) Use of near-source 84th percentile ground motions.](https://image.slidesharecdn.com/151ef991-419b-416f-83b7-77d5352ab4e4-150815150958-lva1-app6892/85/Seismic-Design-Basics-Superstructure-38-320.jpg)
![Presentation Title
MCER AND DESIGN RESPONSE SPECTRUM – III
39
for TS ≤ T ≤ TL (Eq. 11.4-10)
for T > TL (Eq. 11.4-11)
SDS = ⅔.Fa.CRS.SSUH or ⅔.Fa.SSD, lesser. (Eq. 11.4-1, 11.4-2, Table 11.4-1)
0
0
0.4 0.6 ( .11.4 9)DSa
T
S for T T EqS
T
SD1 = ⅔.Fv.CR1.S1UH or ⅔.Fv.S1D, lesser. (Eq. 11.4-3, 11.4-4, Table 11.4-2)
[Sec. 11.4, ASCE 7-10]
Response Spectrum – 3](https://image.slidesharecdn.com/151ef991-419b-416f-83b7-77d5352ab4e4-150815150958-lva1-app6892/85/Seismic-Design-Basics-Superstructure-39-320.jpg)
![Presentation Title
IMPORTANCE FACTOR & OCCUPANCY CATEGORY
41
The Occupancy Category (OC) is used as one of two components in determining
the Seismic Design Category (SDC) and is a primary factor in setting drift limits.
In the quantitative criteria for strength, the Importance Factor I is shown as a divisor
on the Response Modification Factor R in order to send a message to designers that
the objective is to reduce damage for important structures in addition to preventing
collapse in larger ground motions. [C11-5, ASCE 7-10]](https://image.slidesharecdn.com/151ef991-419b-416f-83b7-77d5352ab4e4-150815150958-lva1-app6892/85/Seismic-Design-Basics-Superstructure-41-320.jpg)
![Presentation Title
SEISMIC PERFORMANCE FACTORS, SPFs
42
• Values of the Response Modification Factor R, the system Overstrength
Factor, Ω0, and the Deflection Amplification Factor, Cd, for currently approved
seismic-force-resisting systems are specified in Table 12.2-1 of ASCE 7-10.
• R factors are also given in Sec. 3.10.7 of AASHTO LRFD Bridge Design 2014.
[Fig. 1.1, FEMA P-695, 2009]](https://image.slidesharecdn.com/151ef991-419b-416f-83b7-77d5352ab4e4-150815150958-lva1-app6892/85/Seismic-Design-Basics-Superstructure-42-320.jpg)
![Presentation Title
EQUIV. LATERAL FORCE (ELF) PROCEDURE – I
45
This procedure is useful in preliminary design of all
structures and is allowed for final design of the vast
majority of structures. Three basic steps:
1) Determine the seismic base shear, V =CS.W (Sec. 12.8.1)
2) Distribute the shear vertically along the height of the
structure. (Sec. 12.8.3)
3) Distribute the shear horizontally across the width and
breadth of the structure. (Sec. 12.8.4)
[Sec. 12.8, ASCE 7-10]](https://image.slidesharecdn.com/151ef991-419b-416f-83b7-77d5352ab4e4-150815150958-lva1-app6892/85/Seismic-Design-Basics-Superstructure-45-320.jpg)
![Presentation Title
EQUIV. LATERAL FORCE (ELF) PROCEDURE – II
46
[Sec. 12.8, ASCE 7-10]
SDS is obtained from Eq. 11.4-7, 11.4-5 & Table 11.4-1
SD1 is obtained from Eq. 11.4-8, 11.4-6 & Table 11.4-2
TS varies from 0.2 sec to 0.9 sec. (Table C12.6.1)
TL varies from 4 sec to 16 sec. (Fig. 22-15 through 22-20)
DS
S
S
C
R
I
1D
S L
S
C for T T
R
T
I
1
2
D L
S L
S T
C for T T
R
T
I
Seismic Base Shear: V = CS.W](https://image.slidesharecdn.com/151ef991-419b-416f-83b7-77d5352ab4e4-150815150958-lva1-app6892/85/Seismic-Design-Basics-Superstructure-46-320.jpg)
![Presentation Title
VERTICAL GROUND MOTIONS for Seismic Design
51
Required where a more explicit consideration
of vertical ground motion effects is advised:
• Certain tanks,
• Material storage facilities, bins, silos, etc.
• Electric power generation facilities, etc.
New method for construction of design vertical response spectrum is proposed.
[Chapter 15 & 23, ASCE 7-10]](https://image.slidesharecdn.com/151ef991-419b-416f-83b7-77d5352ab4e4-150815150958-lva1-app6892/85/Seismic-Design-Basics-Superstructure-51-320.jpg)
![Presentation Title
VERTICAL GROUND MOTIONS for Seismic Design
52
[New Chapter 23, ASCE 7-10]
Design Vertical Response Spectrum
Values of Vertical Coefficient CV are obtained from Table 23.1-1
SDS = the design spectral response acceleration parameter at short periods
TV = the vertical period of vibration](https://image.slidesharecdn.com/151ef991-419b-416f-83b7-77d5352ab4e4-150815150958-lva1-app6892/85/Seismic-Design-Basics-Superstructure-52-320.jpg)
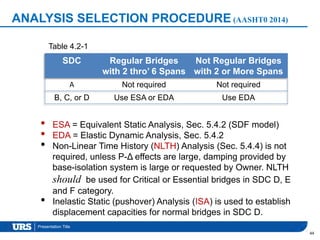
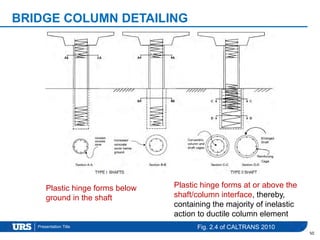
![Presentation Title
DESIGN REQUIREMENTS FOR BRIDGES IN SDC B
1) Identification of Earthquake Resisting Systems (ERS), A-3.3
2) Demand Analysis
3) Implicit capacity check required (displacement, P-Δ, support
length)
4) Capacity design should be considered for column shear;
capacity checks should be considered to avoid weak links in ERS
5) SDC B level of detailing
6) Liquefaction check should be considered for certain conditions
53
D/C ≤ 1 Capacity
Design
SDC B
detailing
Liquefaction
SDC B Identify
ERS
Demand
Analysis
Implicit
Capacity
[AASHTO LRFD Seismic Bridge Design, 2009]](https://image.slidesharecdn.com/151ef991-419b-416f-83b7-77d5352ab4e4-150815150958-lva1-app6892/85/Seismic-Design-Basics-Superstructure-53-320.jpg)
![Presentation Title
INELASTIC SEISMIC ANALYSIS PROCEDURES
54
Matrix depicting possible inelastic seismic analysis procedures for various structural
models & ground motion characterizations along with trends of uncertainty in the result
[FEMA 440, 2005]](https://image.slidesharecdn.com/151ef991-419b-416f-83b7-77d5352ab4e4-150815150958-lva1-app6892/85/Seismic-Design-Basics-Superstructure-54-320.jpg)
![Presentation Title
SEISMIC ANALYSIS PROCEDURES
1) Equivalent Lateral Force (ELF) Analysis or
Nonlinear Static Procedure (NSP)
2) Modal Response Spectrum (MRS) Analysis or
Elastic Dynamic Analysis (EDA)
3) Linear Response History (LRH) Analysis
4) Nonlinear Response History (NRH) Analysis
55
[ASCE 7-10; AASHTO LRFD Seismic Bridge Design, 2009]](https://image.slidesharecdn.com/151ef991-419b-416f-83b7-77d5352ab4e4-150815150958-lva1-app6892/85/Seismic-Design-Basics-Superstructure-55-320.jpg)
![Presentation Title
EQUIV. LATERAL FORCE (ELF) ANALYSIS
56
This procedure is useful in preliminary design of all
structures and is allowed for final design of the vast
majority of structures. Three basic steps:
1) Determine the seismic base shear, V =CS.W (Sec. 12.8.1)
2) Distribute the shear vertically along the height of the
structure. (Sec. 12.8.3)
3) Distribute the shear horizontally across the width and
breadth of the structure. (Sec. 12.8.4)
[Sec 12.8, ASCE 7-10; Sec 5.4.2, AASHTO LRFD Seismic Bridge Design, 2009]](https://image.slidesharecdn.com/151ef991-419b-416f-83b7-77d5352ab4e4-150815150958-lva1-app6892/85/Seismic-Design-Basics-Superstructure-56-320.jpg)
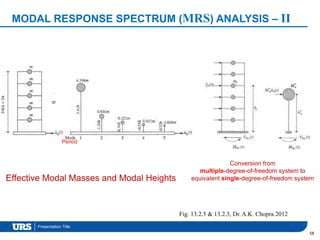
![Presentation Title
MODAL RESPONSE SPECTRUM (MRS) ANALYSIS – I
57
[Sec. 12.9, ASCE 7-10]Fig. 10.1.2 & 10.1.3, Anil K. Chopra 2012
1) Structure is decomposed into a
number of single-degree-of-
freedom (SDF) systems, each
having its own mode shape and
natural period of vibration.
2) Natural period of vibration of an
multiple-degree-of-freedom
(MDF) system is the time
required for one cycle of the
simple harmonic motion in one
of these natural modes. Natural
periods & corresponding modes
of structure are computed.
System in first natural mode of vibration
System in second natural mode of vibration](https://image.slidesharecdn.com/151ef991-419b-416f-83b7-77d5352ab4e4-150815150958-lva1-app6892/85/Seismic-Design-Basics-Superstructure-57-320.jpg)
![Presentation Title
MODAL RESPONSE SPECTRUM (MRS) ANALYSIS – III
59
1) Displacement in each mode is determined from
corresponding spectral acceleration (obtained
from Response Spectrum), modal participation
& mode shape.
2) Where at least 90% of the model mass
participates in the response, the distribution of
forces and displacements is sufficient for design.
3) Each mode will have different peak responses.
The resultant response is calculated by Modal
Combination Rules like SRSS or CQC method.
[Sec 12.9, ASCE 7-10; Sec 5.4.3, AASHTO LRFD Seismic Bridge Design, 2009]
Elastic Dynamic Analysis (EDA) is required for
“irregular bridges” in SDC B, C & D.](https://image.slidesharecdn.com/151ef991-419b-416f-83b7-77d5352ab4e4-150815150958-lva1-app6892/85/Seismic-Design-Basics-Superstructure-59-320.jpg)
![Presentation Title
60
Main Characteristics:
Excitation by suitable earthquake acceleration time histories
Finite Element multiple-degree of freedom model is created
Model may be two- or three-dimensional
Computer with suitable software is required
The responses derived from the Linear Response History
Analysis are multiplied by I to provide enhanced strength
and stiffness for more important facilities, and are divided by
R to account for inelastic behavior.
[Sec 16.1, ASCE 7-10]
RESPONSE HISTORY (LRH) ANALYSIS – LINEAR](https://image.slidesharecdn.com/151ef991-419b-416f-83b7-77d5352ab4e4-150815150958-lva1-app6892/85/Seismic-Design-Basics-Superstructure-60-320.jpg)
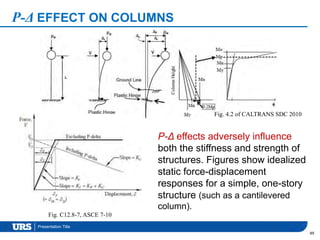
![Presentation Title
61
Procedure is NOT required unless:
P-Δ effects are too large to be neglected
Damping provided by base isolation system is large
Requested by Owner per Article 4.2.2
For complex systems with friction-based passive
energy dissipation devices, nonlinear viscous
dampers, seismically isolated systems, self-centering
systems, or systems that have components with highly
irregular force-deformation relationships
RESPONSE HISTORY (NRH) ANALYSIS – NONLINEAR
[Sec 16.2, ASCE 7-10; Sec 5.4.4, AASHTO LRFD Seismic Bridge Design, 2009]](https://image.slidesharecdn.com/151ef991-419b-416f-83b7-77d5352ab4e4-150815150958-lva1-app6892/85/Seismic-Design-Basics-Superstructure-61-320.jpg)
![Presentation Title
SOIL STRUCTURE INTERACTION (SSI) – I
64
[C19.1, ASCE 7-10]
The response of a structure to
earthquake shaking is affected by
interactions between three linked
systems:
1) the structure,
2) the foundation, and
3) the geologic media underlying
and surrounding the foundation.
SSI effects reflect the differences
between the actual response of the
structure and the response for the
theoretical, rigid base condition.
[Fig. from H. Allison Smith & Wen-Hwa Wu, 1997]](https://image.slidesharecdn.com/151ef991-419b-416f-83b7-77d5352ab4e4-150815150958-lva1-app6892/85/Seismic-Design-Basics-Superstructure-64-320.jpg)
![Presentation Title
SOIL STRUCTURE INTERACTION (SSI) – II
65
[FEMA 440, 2005]
Rigid Base Model
Flexible base, Kinematic Interaction &
Foundation Damping MODEL
Three primary categories of soil-
structure interaction (SSI) effects:
1) Introduction of flexibility to the
soil-foundation system (flexible
foundation effects),
2) Filtering of the character of
ground shaking transmitted to
the structure (kinematic effects)
3) Dissipation of energy from the
soil-structure system through
radiation and hysteretic soil
damping (foundation damping
effects).](https://image.slidesharecdn.com/151ef991-419b-416f-83b7-77d5352ab4e4-150815150958-lva1-app6892/85/Seismic-Design-Basics-Superstructure-65-320.jpg)
![Presentation Title
SOIL STRUCTURE INTERACTION (SSI) – III
66
[Fig. C19-1,
ASCE 7-10]
Effects of period lengthening and foundation
damping on design spectral accelerations
Period lengthening causes higher displacements.
Inertial interaction effects are important for stiff
structural systems on Site Classes C to F](https://image.slidesharecdn.com/151ef991-419b-416f-83b7-77d5352ab4e4-150815150958-lva1-app6892/85/Seismic-Design-Basics-Superstructure-66-320.jpg)
![Presentation Title
FEW NOTATIONS AND DEFINITIONS
73
[Sec. 11.2, 11.3, ASCE 7-10]
MCER = Risk-targeted Maximum Considered Earthquake Ground Motion.
Design response spectrum shall be determined by dividing ordinates of
MCER response spectrum by 1.5.
CR = risk coefficient; see Section 21.2.1.1
CRS = mapped value of the risk coefficient at short periods as defined by Figure 22-3
CR1 = mapped value of the risk coefficient at a period of 1 second as defined by Figure 22-4
SSD = mapped deterministic, 5 percent damped, spectral response acceleration parameter at short
periods as defined in Section 11.4.1
SSUH = mapped uniform-hazard, 5 percent damped, spectral response acceleration parameter at short
periods as defined in Section 11.4.1
S1D = mapped deterministic, 5 percent damped, spectral response acceleration parameter at a period of
1 second as defined in Section 11.4.1
S1UH = mapped uniform-hazard, 5 percent damped, spectral response acceleration parameter at a period
of 1 second as defined in Section 11.4.1
SS = 5 percent damped, spectral response acceleration parameter at short periods as defined in Sec. 11.4.3
S1 = spectral response acceleration parameter at a period of 1 second as defined in Section 11.4.3
SaM = the site-specific MCER spectral response acceleration at any period
SMS = the MCER, 5 percent damped, spectral response acceleration parameter at short periods adjusted
for target risk and site-class effects as defined in Section 11.4.3
SM1 = the MCER, 5 percent damped, spectral response acceleration parameter at a period of 1 second
adjusted for target risk and site-class effects as defined in Section 11.4.3](https://image.slidesharecdn.com/151ef991-419b-416f-83b7-77d5352ab4e4-150815150958-lva1-app6892/85/Seismic-Design-Basics-Superstructure-73-320.jpg)


![[Ajaya kumar gupta]_response_spectrum_method_in_se(book_zz.org)](https://cdn.slidesharecdn.com/ss_thumbnails/ajayakumarguptaresponsespectrummethodinsebookzz-150514122401-lva1-app6892-thumbnail.jpg?width=640&height=640&fit=bounds)


