2. 1*2/Introduction to Alloy PhaseDiagrams
magnesium, and manganese. These substances
constitute the components comprising the system
and should not be confused with the various
phases found within the system. A system, how-
ever, also can consist of a single component, such
as an element or compound.
PhaseDiagrams.In order to record and visual-
ize the results of studying the effects of state
variables on a system, diagrams were devised to
show the relationships between the various
phases that appear within the system under equi-
librium conditions. As such, the diagrams are
variouslycalledconstitutional diagrams, equilib-
rium diagrams, or phase diagrams. A single-
component phase diagram can be simply a one-
or two-dimensional plot showing the phase
changes in the substance as temperature and/or
pressure change. Most diagrams, however, are
two- or three-dimensional plots describing the
phase relationships in systems made up of two or
more components, and these usually contain
fields (areas) consisting of mixed-phase fields, as
well as single-phase fields. The plotting schemes
in common use are described in greater detail in
subsequent sections of this Introduction.
System Components. Phase diagrams and the
systems they describe are often classified and
named for the number (in Latin) of components
in the system:
Number of Name of
components system or diagrum
One Unary
Two Binary
Three Temary
Four Quatemary
Five Quinary
Six Sexinary
Seven Septenary
Eight Octanary
Nine Nonary
Ten Decinary
Phase Rule. Thephase rule, first announced by
J. WillardGibbs in 1876, relates the physical state
of a mixture to the number of constituents in the
system and to its conditions. It was also Gibbs
who first called each homogeneous region in a
system by the term "phase." When pressure and
temperature are the state variables,the rule can be
written as follows:
f=c-p+2
where f is the number of independent variables
(called degrees offreedom), c is the number of
components, andp is the number of stable phases
in the system.
UnaryDiagrams
InvariantEquilibrium.Accordingto the phase
rule, three phases can exist in stable equilibrium
only at a single point on a unary diagram (f= 1 -
3 + 2 = 0). This limitationis illustratedas point O
in the hypothetical unary pressure-temperature
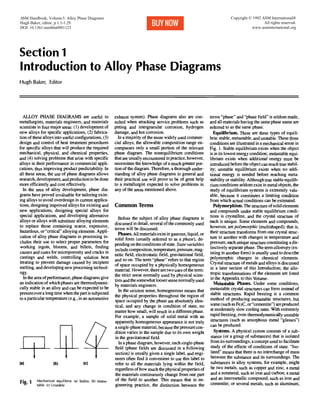
(PT) diagram shown in Fig. 2. In thisdiagram, the
three states (or phases)--solid, liquid, and gas---
are represented by the three correspondingly la-
I
Solid 2
f
4
Liquid/
Gas
Temperature
Fig. 2 Schematic pressure-temperature phase diagram
beled fields. Stable equilibrium between any two
phases occurs along their mutual boundary, and
invariant equilibrium among all three phases oc- A
curs at the so-called triple point, O, where the
three boundaries intersect. This point also is Fig. 3
called an invariant point because, at that location
on the diagram, all externally controllablefactors
are fixed (no degrees of freedom). At this point,
allthree states (phases) are in equilibrium,but any
changes in pressure and/or temperature willcause
one or two of the states (phases) to disappear.
Univariant Equilibrium.The phase rule says
that stable equilibrium between two phases in a
unary system allows one degree of freedom (f=
1 - 2 + 2). This condition, called univariant
equilibrium or monovariant equilibrium, is illus-
trated as lines 1, 2, and 3 separating the single-
phase fields in Fig. 2. Either pressure or tempera-
ture may be freely selected, but not both. Once a
pressure is selected,there is only one temperature
that will satisfy equilibrium conditions, and con- 2
versely.The three curves that issue from the triple 22
point are called triple curves: line 1, representing
the reaction between the solid and the gas phases,
is the sublimation curve; line 2 is the melting
curve; and line 3 is the vaporization curve. The
vaporization curve ends at point 4, called a criti-
cal point, where the physical distinction between
the liquid and gas phases disappears.
Bivariant Equilibrium. If both the pressure
and temperature in a unary system are freely and
arbitrarily selected, the situation corresponds to
having two degrees of freedom, and the phase rule
says that only one phase can exit in stable equi-
librium (p = 1 - 2 + 2). This situation is called
bivariant equilibrium.
BinaryDiagrams
If the system being considered comprises two
components, a compositionaxis must be added to
the PT plot, requiring construction of a three-
dimensional graph. Most metallurgical problems,
however, areconcerned only with a fixedpressure
of one atmosphere, and the graph reduces to a
two-dimensionalplot of temperature and compo-
sition (TX diagram).
quid)
Solidus
Ot
Composition B
Schematic binary phase diagram showing mis-
cibility in both the liquid and solid states
The Gibbs phase rule applies to all states of
matter (solid, liquid, and gaseous), but when the
effect of pressure is constant, the rule reduces to:
f=c-p+ 1
The stable equilibriafor binary systems are sum-
marized as follows:
Number of Number of Degrees of
components ph~es freedom Equilibrium
3 0 Invariant
2 1 Univariant
l 2 Bivariant
Miscible Solids, Many systems are comprised
of components having the same crystal structure,
and the components of some of these systems are
completely miscible (completely soluble in each
other) in the solid form, thus forming a continu-
ous solid solution. When this occurs in a binary
system, the phase diagramusually has the general
appearance of that shown in Fig. 3. The diagram
consists of two single-phasefields separated by a
two-phasefield.The boundary between the liquid
fieldand the two-phase field in Fig. 3 is calledthe
liquidus; that between the two-phase field and the
solid field is the solidus. In general, a liquidus is
the locus of points in a phase diagram repre-
senting the temperatures at which alloys of the
various compositions of the system begin to
freeze on cooling or finish melting on heating; a
solidus is the locus of points representing the
temperatures at which the various alloys finish
freezing on cooling or begin melting on heating.
The phases in equilibrium across the two-phase
field in Fig. 3 (the liquid and solid solutions) are
called conjugate phases.
3. E0
I--
L
(a)
A
Composition
:3
Ea)
I.--
L
(b)
A B
Composition
Fig. 4 Schematic binary phasediagrams with solid-
state miscibility where the liquidus shows a
maximum (a) and a minimum (b)
Introduction to Alloy Phase Diagrams/I-3
I
Fig. 5
solid state
L
ro
a b B
Composition
Schematic binary phase diagram with a mini-
mum in the liquidus and a miscibility gap in the
If the solidus and liquidus meet tangentially at
some point, a maximum or minimum is produced
in the two-phase field, splitting it into two por-
tions as shown in Fig. 4. It also is possibleto have
a gap in miscibilityin a single-phase field; this is
shown in Fig. 5. Point Tc, above which phases tXl
and ~2 become indistinguishable, is a critical
point similar to point 4 in Fig. 2. Lines a-Tc and
b-Tc, called solvus lines, indicate the limits of
solubilityof component B in A and Ain B, respec-
tively. The configurations of these and all other
phase diagrams depend on the thermodynamics
of the system, as discussed later in this Introduc-
tion.
Eutectic Reactions. If the two-phase field inthe
solidregion of Fig. 5 isexpanded sothat ittouches
the solidus at some point, as shown in Fig. 6(a),
complete miscibility of the components is lost.
Instead of a single solid phase, the diagram now
shows two separate solid terminal phases, which
are in three-phase equilibrium with the liquid at
point P, an invariant point that occurred by coin-
cidence. (Three-phase equilibriumis discussed in
the following section.) Then, if this two-phase
field in the solid region is even further widened
so that the solvus lines no longer touch at the
invariant point, the diagram passes through a
series of configurations, finally taking on the
more familiar shape shown in Fig. 6(b). The
three-phase reaction that takes place at the invari-
ant point E, where a liquid phase freezes into a
mixture of two solid phases, is called a eutectic
reaction (from the Greek word for "easily
melted"). The alloy that corresponds to the eutec-
tic composition is calleda eutectic alloy.An alloy
having a composition to the left of the eutectic
point is called a hypoeutectic alloy (from the
Greek word for "less than"); an alloy to the right
is a hypereutecticalloy (meaning "greater than").
In the eutectic system described above, the two
components of the system have the same crystal
structure. This, and other factors, allowscomplete
miscibilitybetween them. Eutectic systems, how-
ever, also can be formed by two components
having different crystal structures. When this oc-
curs, the liquidus and solidus curves (and their
extensions into the two-phase field) for each of
the terminal phases (see Fig. 6c) resemble those
for the situation of complete miscibilitybetween
system components shown in Fig. 3.
Three-Phase Equilibrium. Reactions involv-
ing three conjugate phases are not limited to the
eutectic reaction. For example, upon cooling, a
single solid phase can change into a mixture of
two new solid phases or, conversely, two solid
phases can react to form a single new phase.
These and the other various types of invariant
reactions observed in binary systems are listed in
Table 1 and illustrated in Fig. 7 and 8.
Intermediate Phases. In addition to the three
solid terminal-phase fields, (~, [~,and e, the dia-
gram in Fig. 7 displays five other solid-phase
fields, 7, 5, fi',~q,and ~, at intermediate composi-
tions. Such phases are called intermediate
phases. Many intermediate phases, such as those
i
L
L+I3 /
Composition B
/
L+~
%SS,,, ~ .~ ~ % I
%• E %
~+~
A A Composition B
(a) (b) (c)
•p "t'... _~
r" .s -S ~
c~+B
A Composition
Fig° 6 Schematic binary phase diagrams with invariant points. (a) Hypothetical diagram of the type shown in Fig. 5, except that the miscibility gap in the solid touches the solidus
curve at invariant point P; an actual diagram of this type probably does not exist. (b) and (c) Typical eutectic diagrams for components having the samecrystal structure (b)
and components having different crystal structures (c);the eutectic (invariant) points are labeled E.The dashed lines in (b) and (c) are metastable extensionsof the stable-equilibria lines.
4. 1-4/Introduction to Alloy Phase Diagrams
Allotropl¢
t
Fig. 7
Critical L
I = +L / L, + ,/ -- .o~=.o~o - "/;
I V / 7 + Ls /L +
::7 /" .......
7/Co~ngr~7 + 71 71 Monoteetold
Eutectoid ~ + 6'
.................... Y_o_lLmo_rp_h_zc_..........
A Composition
~ruent
~+~
B
Hypothetical binary phase diagram showing intermediate phases formed by
various invariant reactions and a polymorphic transformation
¢onsruent
L2
A Composition B
Fig, 8 Hypothetical binary phase diagram showing three intermetallic line com-
pounds and four melting reactions
illustrated in Fig. 7, have fairly wide ranges of
homogeneity. However, many others have very
limited or no significant homogeneity range.
When an intermediate phase of limited (or no)
homogeneity range is located at or near a specific
ratio of component elements that reflects the nor-
mal positioning of the component atoms in the
crystal structure of the phase, it is often called a
compound (or line compound).When the compo-
nents of the system are metallic, such an interme-
diate phase is often called an intermetallic com-
pound. (Intermetallic compounds should not be
confused with chemical compounds, where the
type of bonding is different from that in crystals
and where the ratio has chemical significance.)
Three intermetallic compounds (with four types
of melting reactions) are shown in Fig. 8.
In the hypotheticaldiagram shown in Fig. 8, an
alloy of composition AB will freeze and melt
isothermally, without the liquid or solid phases
undergoing changes in composition; such a phase
change is ailed congruent. All other reactions are
incongruent;, that is, two phases are formed from
one phase on melting. Congruent and incongruent
phase changes, however, are not limited to line
compounds: the terminal component B (pure
phase e) and the highest-melting composition of
intermediate phase 8' in Fig. 7, for example,
freeze and melt congruently, while 8' and e freeze
and melt incongruently at other compositions.
Metastable Equilibrium. In Fig. 6(c), dashed
lines indicate the portions of the liquidus and
solidus lines that disappear into the two-phase
solid region. These dashed lines represent valu-
able information, as they indicate conditions that
would exist under metastable equilibrium, such
as might theoretically occur during extremely
rapid cooling. Metastableextensions of some sta-
ble-equilibrialines also appear in Fig. 2 and 6(b).
Ternary Diagrams
When a third component is added to a binary
system, illustratingequilibrium conditions in two
dimensions becomes more compticated. One op-
tion is to add a third compositiondimension to the
base, forming a solid diagram having binary dia-
grams as itsverticalsides. This can be represented
as a modifiedisometricprojection,such as shown
in Fig. 9. Here, boundaries of single-phase fields
(liquidus, solidus, and solvus lines in the binary
diagrams) become surfaces; single- and two-
phase areas become volumes; three-phase lines
become volumes; and four-phase points, while
not shown in Fig. 9, can exist as an invariant
plane. The composition of a binary eutectic liq-
uid, which is a point in a two-component system,
becomes a line in a ternary diagram, as shown in
Fig. 9.
Although three-dimensionalprojections can be
helpful in understanding the relationships in a
diagram, reading values from them is difficult.
Therefore, ternary systems are often represented
by views of the binary diagrams that comprisethe
faces and two-dimensional projections of the
liquidus and solidus surfaces, along with a series
of two-dimensional horizontal sections (iso-
therms) and vertical sections (isopleths) through
the solid diagram.
Vertical sections are often taken through one
comer (one component) and a congruently melt-
ing binary compound that appears on the opposite
face; when such a plot can be read like any other
true binary diagram, it is called a quasibinary
section. One possibility is illustrated by line 1-2
in the isothermal section shown in Fig. 10. A
vertical section between a congruently melting
binary compound on one face and one on a dif-
Solidus
surface
Solvus
surface
L+a
/
Liquidus surfaces
~,e::,... .... -~
L+/~
Solidus
Solvus
surface
A
Fig, 9 Ternary phase diagram showing three-phase equilibrium. Source: 56Rhi
5. C
A B
Fig. 10 Isothermal section of a ternary diagram with
phase boundaries deleted for simplification
ferent face might also form a quasibinary section
(see line 2-3).
All other vertical sections are not true binary
diagrams, and the term pseudobinary is applied
to them. A common pseudobinary section is one
where the percentage of one of the components is
held constant (the section is parallel to one of the
faces), as shown by line 4-5 in Fig. 10. Another
is one where the ratio of two constituents is held
constantand the amountof the third is varied from
0 to 100% (line 1-5).
Isothermal Sections. Composition values in
the triangular isothermal sections are read from a
triangular grid consisting of three sets of lines
parallel to the faces and placed at regular compo-
sition intervals (see Fig. 11). Normally, the point
of the triangle is placed at the top of the illustra-
C
,. A/VV
AA/kAAA/k
A xa ~ B
Fig. 11 Triangular composition grid for isothermal sec-
tions; x is the composition of each constituent
in mole fraction or percent
tion, component A is placed at the bottom left, B
at the bottom right, and C at the top. The amount
of component A is normally indicated from point
C to point A, the amount of component B from
point A to point B, and the amount of component
C from point B to point C. This scale arrangement
is often modified when only a comer area of the
diagram is shown.
Projected Views. Liquidus, solidus, and solvus
surfaces by their nature are not isothermal. There-
fore, equal-temperature (isothermal) contour
lines are often added to the projected views of
these surfaces to indicate their shape (see Fig. 12).
In addition to (or instead of) contour lines, views
often show lines indicating the temperature
troughs (also called "valleys" or "grooves")
Table I Invariant reactions
Type Reaction
Eutectic Lt
(involvesliquid
andsolid) I.,2> V < S Monoteetic
L
S~> / < $2 Eutectic
S,
L> V < S~ Catatectic (Metatectic)
Eutectoid St
(involvessolid S~> V
only) St
,%> /
< S~ Monotectoid
< S~ Eutectoid
Peritectic
(involvesliquid Lt > A
andsolid) S
L> A
,%
Peritectoid
(involvessolid St > A
only) S~
< I.~ Syntectic
< St Peritectic
< ~ Peritectoid
Introduction to Alloy Phase Diagrams/I,5
C
a:Zr,
r,
r,
r,
r~
r,
r,
r2
A
Fig. 12 Liquidus projection of a ternary phase diagram
showing isothermal contour lines. Source:
Adapted from 56Rhi
formed at the intersections of two surfaces. Ar-
rowheads are often added to these linesto indicate
the direction of decreasing temperature in the
trough.
ThermodynamicPrinciples
The reactions between components, the phases
formed in a system, and the shape of the resulting
phase diagram can be explained and understood
through knowledge of the principles, laws, and
terms of thermodynamics, and how they apply to
the system.
Internal Energy. The sum of the kinetic energy
(energy of motion) and potential energy (stored
energy) of a system is called its internal energy,
E. Internal energy is characterized solely by the
state of the system.
Closed System. A thermodynamic system that
undergoes no interchangeof mass (material) with
its surroundings is called a closed system. A
closed system, however, can interchange energy
with its surroundings.
First Law. The First Law of Thermodynamics,
as stated by Julius yon Mayer, James Joule, and
Hermann von Helmholtz in the 1840s, states that
energy can be neither created nor destroyed.
Therefore, it is called the Law of Conservation of
Energy. This law means that the total energy of
an isolated system remains constant throughout
any operations that are carded out on it; that is,
for any quantity of energy in one form that disap-
pears from the system, an equal quantity of an-
other form (or other forms) will appear.
For example, consider a closed gaseous system
to which a quantity of heat energy, ~Q, is added
and a quantity of work, 5W, is extracted. The First
Law describes the change in intemal energy, dE,
of the system as follows:
dE = ~2-aW
In the vast majority of industrial processes and
material applications, the only work done by or
on a system is limited to pressure/volume terms.
6. 1-6/Introduction to Alloy PhaseDiagrams
Any energy contributions from electric, mag- C = 8Q
netic, or gravitationalfields are neglected, except ST
for electrowinning and electrorefining processes
such as those used in the production of copper,
aluminum, magnesium, the alkaline metals, and
the alkaline earths. With the neglect of field ef-
fects, the work done by a system can be measured &2= dE
by summing the changes in volume, dV, times
each pressure causing a change. Therefore, when and
field effects are neglected, the First Law can be
written:
dE = ~3Q- PdV
However, if the substance is kept at constant
volume (dV = 0):
Enthalpy. Thermal energy changes under con-
stant pressure (again neglecting any field effects)
are most conveniently expressed in terms of the
enthalpy, H, of a system. Enthalpy, also called
heat content, is defined by:
H=E+PV
Enthalpy, like internal energy, is a function of the
state of the system, as is the product PV.
Heat Capacity. The heat capacity, C, of a sub-
stance is the amount of heat required to raise its
temperature one degree; that is:
If, instead, the substance is kept at constant pres-
sure (as in many metallurgical systems),
CP=L dT Jp
and
Second Law. While the First Law establishes
the relationship between the heat absorbed and
the work performed by a system, it places no
restriction on the source of the heat or its flow
direction. This restriction, however, is set by the
Second Law of Thermodynamics, which was ad-
vancedby RudolfClausius and WilliamThomson
(Lord Kelvin). The Second Law states that the
spontaneous flow of heat always is from the
higher temperature body to the lower tempera-
ture body. In other words, all naturally occurring
processes tend to take place spontaneously in the
direction that will lead to equilibrium.
Entropy. The Second Law is most conveniently
stated in terms of entropy, S, another property of
statepossessedby all systems.Entropyrepresents
the energy (per degree of absolute temperature,
T) in a system that is not available for work. In
terms of entropy, the Second Law states that all
natural processes tend to occur only with an
increase in entropy, and the direction of the proc-
ess always is such as to lead to an increase in
entropy. For processes taking place in a system in
equilibrium with its surroundings, the change in
entropy is defined as follows:
~Q dE + PdV
dS =_
T- T
A
(a)
Composition
i
T~
(X
i
A
(b)
i
Composition
i
(c)
i
r3
2
C~ q
. . . . . 4. . . . . . £
I I
r,
r2
r3
r,
rs
A Composition B A Composition B A Composition
(d) (e) (f)
Fig. 13 Use of Gibbs energy curves to construct a binary phase diagram that shows miscibility in both the liquid and solid states.Source: Adapted from 66Pri
7. Introduction to Alloy PhaseDiagrams/lo7
r~
(D
A
(a)
t
o~
.g_
L9
Composition B A
r2
I J
I I
I i
Composition B
(b)
t
==
(.9
A
I T66 i 7 I
I I I I
I I I I
I 1 I I
Composition B
(c)
t
==
A Composition
(d)
Fig.14
r,
L
1~9 ~ 10
I
I
I
I
rs
t
L /3
[ ,'
A Composition B
(e)
i
1
A
(f)
Composition
Use of Gibbs energy curves to construct a binary phase diagram of the eutectic type. Source: Adapted from 68Gor
T 1
r~
r3
r,
r5
Third Law. A principle advanced by Theodore
Richards, WalterNemst, Max Planck, and others,
often called the Third Law of Thermodynamics,
states that the entropy of all chemically homoge-
neous materials can be taken as zero at absolute
zero temperature (0 K). This principle allows
calculation of the absolute values of entropy of
pure substances solely from heat capacity.
Gibbs Energy. Because both S and V are diffi-
cult to control experimentally,an additionalterm,
Gibbs energy, G, is introduced, whereby:
G =_E + PV- TS =_H- TS
and
dG = dE + PdV + VdP - TdS- SdT
However,
dE=TdS-PdV
Therefore,
dG = VdP-SdT
Here, the change in Gibbs energy of a system
undergoing a process is expressed in terms of two
independentvariables,pressure and absolutetem-
perature, which are readilycontrolledexperimen-
tally.If the process is carded out under conditions
of constant pressure and temperature, the change
in Gibbs energy of a system at equilibrium with
its surroundings (a reversibleprocess) is zero. For
a spontaneous (irreversible) process, the change
in Gibbs energy is less than zero (negative); that
is, the Gibbs energy decreases during the process,
and it reaches a minimum at equilibrium.
Features of Phase Diagrams
The areas (fields) in a phase diagram, and the
position and shapes of the points, lines, surfaces,
and intersections in it, are controlled by thermo-
dynamic principles and the thermodynamic prop-
erties of all of the phases that constitute the sys-
tem.
Phase-field Rule. The phase-fieM rule speci-
fies that at constant temperature and pressure, the
number of phases in adjacent fields in a multi-
component diagram must differ by one.
Theorem of Le Chfitelier. The theorem of
Henri Le Ch~telier, which is based on thermody-
namic principles, states that if a system in equi-
librium is subjected to a constraint by which the
equilibrium is altered, a reaction occurs that
opposes the constraint, i.e., a reaction that par-
tially nullifies the alteration. The effect of this
theorem on lines in a phase diagram can be seen
in Fig. 2. The slopes of the sublimation line (1)
and the vaporizationline (3) show that the system
reacts to increasingpressure by makingthe denser
phases (solid and liquid) more stable at higher
pressure. The slope of the melting line (2) indi-
cates that this hypotheticalsubstance contracts on
freezing. (Note that the boundary between liquid
water and ordinary ice, which expands on freez-
ing, slopes toward the pressure axis.)
Clausius-Clapeyron Equation. The theorem
of Le Ch~telierwas quantified by Benoit Clapey-
ron and Rudolf Clausius to give the following
equation:
dP AH
dT TAV
where dP/dT is the slope of the univariant lines in
a PT diagram such as those shown in Fig. 2, AV
is the difference in molar volume of the two
phases in the reaction, and AH is the difference in
molar enthalpy of the two phases (the heat of the
reaction).
8. 1,8/Introduction to Alloy Phase Diagrams
L
a+13
(a)
@
o¢+15
(b)
Fig. 1~; Examplesof acceptableintersectionanglesfor
~boundaries oftwo-phasefields.Source:56Rhi
Solutions. The shapes of liquidus, solidus, and
solvus curves (or surfaces) in a phase diagram are
determined by the Gibbs energies of the relevant
phases. In this instance, the Gibbs energy must
include not only the energy of the constituent
components, but also the energy of mixing of
these components in the phase.
Consider, for example,the situationofcomplete
miscibility shown in Fig. 3. The two phases,
liquid and solid tz, are in stable equilibrium in the
two-phase field between the liquidus and solidus
lines. The Gibbs energies at various temperatures
are calculated as a function of composition for
ideal liquid solutions and for ideal solid solutions
of the two components, A and B. The result is a
series of plots similarto those shown in Fig. 13(a)
to (e).
At temperature Th the liquid solution has the
lower Gibbs energy and, therefore, is the more
stable phase. At T2, the melting temperature of A,
the liquid and solid are equally stable only at a
composition of pure A. At temperature T3, be-
tween the melting temperatures of A and B, the
Gibbs energy curves cross. Temperature T4 is the
melting temperature of B, while T5 is below it.
Construction of the two-phase liquid-plus-solid
field of the phase diagram in Fig. 13(f) is as
follows. Accordingto thermodynamic principles,
the compositions of the two phases in equilibrium
with each other at temperature T3 can be deter-
mined by constructing a straight line that is tan-
gential to both curves in Fig. 13(c). The points of
tangency, 1and 2, are then transferred to the phase
diagram as points on the solidus and liquidus,
respectively. This is repeated at sufficient tem-
peratures to determine the curves accurately.
If, at some temperature,the Gibbsenergycurves
for the liquid and the solid tangentially touch at
some point, the resulting phase diagram will be
similar to those shown in Fig. 4(a) and (b), where
a maximum or minimum appears in the liquidus
and solidus curves.
Mixtures. The two-phase field in Fig. 13(0
consists of a mixture of liquid and solid phases.
As stated above, the compositions of the two
phases in equilibrium at temperature T3 are C1
and C2. The horizontalisothermal line connecting
I
L
~ L+(x~ ~ i J"
" %~ Incorrect / / / L+ccJ /
% I
G
A B
Composition
Fig. 16 Anexampleofa binaryphasediagramwitha minimumintheliquidusthatviolatestheGibbs-KonovalovRule.
Source:81Goo
points 1and 2, where these compositionsintersect
temperatureT3,iscalled a tie line. Similartielines
connect the coexistingphases throughout all two-
phase fields (areas) in binary and (volumes) in
ternary systems, while tie triangles connect the
coexisting phases throughout all three-phase re-
gions (volumes) in temary systems.
Eutectic phase diagrams, a feature of which is a
field where there is a mixture of two solidphases,
also can be constructed from Gibbs energy
curves. Consider the temperatures indicated on
the phase diagram in Fig. 14(f) and the Gibbs
energy curves for these temperatures (Fig. 14a-e).
When the points of tangency on the energy curves
are transferred to the diagram, the typical shape
of a eutectic system results. The mixture of solid
c~ and g that forms upon cooling through the
eutectic point k has a special microstructure, as
discussed later.
Binary phase diagrams that have three-phase
reactions other than the eutectic reaction, as well
as diagrams with multiple three-phase reactions,
also can be constructed from appropriate Gibbs
energy curves. Likewise, Gibbs energy surfaces
and tangential planes can be used to construct
ternary phase diagrams.
Curves and Intersections. Thermodynamic
principles also limit the shape of the various
boundary curves (or surfaces) and their intersec-
tions. For example, see the PT diagram shown in
Fig. 2. The Clausius-Clapeyronequation requires
that at the intersection of the triple curves in such
a diagram, the angle between adjacent curves
should never exceed 180° or, alternatively, the
extension of each triplecurvebetween two phases
must lie within the field of third phase.
The angle at which the boundaries of two-phase
fields meet also is limited by thermodynamics.
That is, the angle must be such that the extension
of each beyond the point of intersection projects
into a two-phase field, rather than a one-phase
field. An example of correct intersections can be
Correct
Line
compound
L
I
Incorrect
Line
compound
L
A B A
ComposlUon
(a) (b)
Composition
glo. 1 7 Schematicdiagramsof binarysystemscontainingcongruent-meltingcompoundsbut havingno associationof-'b the componentatomsin the melt common. Thediagramin (a)is consistentwith the Gibbs-KonovalovRule,
whereasthat in (b) violatesthe rule. Source:81Goo
9. Introduction to Alloy Phase Diagrams/11,9
Typical Phase-Rule Violations
(See Fig.18)
1. A two-phase field cannot be extended to become
part of a pure-element side of a phase diagram
at zero solute. In example 1, the liquidus and the
solidus must meet at the meltingpoint of the pure
element.
2. Two liquidus curves must meet at one composi-
tion at a eutectic temperature.
3. A tie line must terminate at a phase boundary.
4. Two solvus boundaries (or two liquidus, or two
solidus, or a solidus and a solvus) of the same
phase must meet (i.e., intersect) at one compo-
sition at an invariant temperature. (There should
not be two solubilityvalues for a phase boundary
at one temperature.)
5. A phase boundary must extrapolate into a two-
phase field after crossingan invariant point. The
validity of this feature, and similar features re-
lated to invariant temperatures, is easily demon-
strated by constructing hypothetical free-energy
diagrams slightly below and slightly above the
invariant temperature and by observing the rela-
tive positions of the relevant tangent points to
the free energy curves. After intersection, such
boundaries can also be extrapolated into metas-
table regions of the phase diagram. Such ex-
trapolations are sometimes indicated by dashed
or dotted lines.
6. Two single-phase fields (Ix and 6) should not be
in contact along a horizontal line. (An invariant-
temperature line separates two-phase fields in
contact.)
7. A single-phase field (Ix in this instance) should
not be apportioned into subdivisions by a single
line. Having created a horizontal (invariant) line
at 6 (which is an error), there may be a tempta-
tion to extend this line into a single-phase field,
Ix, creating an additional error.
8. In a binary system,an invariant-temperature line
should involve equilibrium among three phases.
9. There should be a two-phase field between two
single-phase fields (Two single phases cannot
touch except at a point. However, second-order
and higher-order transformationsmay be excep-
tions to this rule.)
10. When two phase boundaries touch at a point,
they should touch at an extremity of tempera-
ture.
11. A touching liquidus and solidus (or any two
touching boundaries) must have a horizontal
common tangent at the congruent point. In this
instance, the solidus at the melting point is too
"sharp" and appears to be discontinuous.
12. A local minimum point in the lower part of a
single-phase field (in this instance, the liquid)
cannot be drawn without an additional boundary
in contact with it. (In this instance, a horizontal
monotectic line is most likely missing.)
13. A local maximum point in the lower part of a
single-phase field cannot be drawn without a
monotectic, monotectoid, syntectic, and sintec-
toid reaction occurring below it at a lower tem-
perature. Alternatively, a solidus curve must be
drawn to touch the liquidus at point 13.
14. A local maximum point in the upper part of a
single-phase field cannot be drawn without the
phase boundary touching a reversed monotectic,
or a monotectoid, horizontal reaction line coin-
ciding with the temperature of the maximum.
When a 14 type of error is introduced, a mini-
mum may be created on either side (or on one
side) of 14. This introduces an additional error,
which is the opposite of 13, but equivalent to 13
in kind.
15. A phase boundary cannot terminate within a
phase field. (Termination due to lack of data is,
of course, often shown in phase diagrams, but
this is recognized to be artificial.)
16. The temperature of an invariant reaction in a
binary system must he constant. (The reaction
line must he horizontal.)
17. The liquidus should not have a discontinuous
sharp peak at the melting point of a compound.
(This rule is not applicable if the liquid retains
the molecular state of the compound, i.e., in the
situation of an ideal association.)
18. The compositions of all three phases at an invari-
ant reaction must be different.
19. A four-phase equilibrium is not allowed in a
binary system.
20. Two separate phase boundaries that create a
two-phase field between two phases in equilib-
rium should not cross each other.
ProblemsConnected With Phase-Boundary
Curvatures
Although phase rules are not violated, three addi-
tional unusual situations (21, 22, and 23) have also
been included in Fig. 18. In each instance, a more
subtle thermodynamic problem may exist related to
these situations. Examples are discussedbelow where
several thermodynamically unlikely diagrams are
considered. The problems with each of these situ-
ations involve an indicated rapid change of slope of
a phase boundary. If such situations are to be associ-
ated with realistic thermodynamics, the temperature
(or the composition) dependence of the thermody-
namic functions of the phase (or phases) involved
would be expected to show corresponding abrupt and
unrealistic variations in the phase diagram regions
where such abrupt phase boundary changes are pro-
posed, without any clear reason for them. Even the
onset of ferromagnetismin a phase does not normally
cause an abrupt change of slope of the related phase
boundaries. The unusual changes of slope considered
here are:
21. Two inflection points are located too closely to
each other.
22. An abrupt reversal of the boundary direction
(more abrupt than a typical smooth "retro-
grade"). This particular change can occur only
if there is an accompanying abrupt change in the
temperature dependence of the thermodynamic
properties of either of the two phases involved
(in this instance, ~ or ~,in relation to the bound-
ary). The boundary turn at 22 is very unlikely to
be explained by any realistic change in the com-
position dependence of the Gibbs energy func-
tions.
23. An abrupt change in the slope of a single-phase
boundary. This particular change can occur only
by an abrupt change in the composition depend-
ence of the thermodynamic properties of the
single phase involved (in this instance, the
phase). It cannot be explained by any possible
abrupt change in the temperature dependence of
the Gibbs energy function of the phase. (If the
temperature dependence were involved, there
would also be a change in the boundary of the e
phase.)
i
a i , ,
11 17
12 18
16
100
Composition B
:l:|~,,,b 1 ,.,RHypothetical binary phasediagram showing many typical errors of construc-
tion. Seethe accompanying text for discussion of the errors at points 1 to 23.
Source: 910kal
L
2
a 4
5 a + 7
11 17
13
1616
1D 2O
Composition B
Fig. 19 Error-freeversion of the phase diagram shown in Fig. 18. Source:910kal
10. lol0/Introduction to Alloy Phase Diagrams
seen in Fig. 6(b), where both the solidus and
solvus lines are concave. However, the curvature
of both boundaries need not be concave; Fig. 15
shows two equally acceptable (but unlikely) in-
tersections where convex and concave lines are
mixed.
Congruent Transformations. The congruent
point on a phase diagram is where different
phases of same composition are in equilibrium.
The Gibbs-Konovalov Rule for congruentpoints,
which was developedby DmitryKonovalovfrom
a thermodynamicexpression given by J. Willard
Gibbs, states that the slope of phase boundariesat
congruenttransformationsmustbe zero (horizon-
tal). Examples of correct slope at the maximum
and minimum points on liquidus and solidus
curvescanbe seeninFig.4. Often,the innercurve
on a diagram such as that shown in Fig. 4 is
erroneously drawn with a sharp inflection (see
Fig. 16).
A similar common construction error is found
in the diagrams of systems containing con-
gruently melting compounds (such as the line
compounds shown in Fig. 17) but having little or
no associationof the componentatoms inthe melt
(as with most metallicsystems). Thistype oferror
is especially common in partial diagrams, where
one or more system components is a compound
instead of an element. (The slope of liquidus and
solidus curves, however, must not be zero when
they terminate at an element, or at a compound
having complete association in the melt.)
Common Construction Errors. Hiroaki
Okamoto and Thaddeus Massalski have prepared
the hypothetical binary phase shown in Fig. 18,
which exhibits many typical errors of construc-
tion (marked as points 1 to 23). The explanation
for each error is given in the accompanyingtext;
one possible error-free version of the same dia-
gram is shown in Fig. 19.
Higher-Order Transitions. The transitions
considered in this Introduction up to this point
have been limitedto the commonthermodynamic
types called first-order transitions---that is,
changes involvingdistinct phases having differ-
ent lattice parameters, enthalpies, entropies, den-
sities, andso on. Transitionsnot involvingdiscon-
tinuities in composition, enthalpy, entropy, or
molar volume are called higher-order transitions
and occur less frequently. The change inthe mag-
neticqualityof ironfrom ferromagnetic to param-
agnetic as the temperature is raised above 771 °C
(1420 °F) is an example of a second-ordertransi-
tion: no phase change is involved and the Gibbs
phase rule does not come into play in the transi-
tion. Anotherexampleof ahigher-order transition
is the continuouschange from a random arrange-
ment of the various kinds of atoms in a multicom-
ponent crystal structure (a disordered structure)
to an arrangementwhere there is some degree of
crystal ordering of the atoms (an ordered struc-
ture, or superlattice), or the reverse reaction.
Crystal Structure
Acrystal is a solid consistingof atoms or mole-
cules arranged in a pattern that is repetitive in
three dimensions. The arrangement of the atoms
C
cell /
A "/
Fig. 20 a spacelattice Fig. 21 Crystalaxesand unit-cell edge lengths. Unit-
cell facesare shown, but to avoid confusion
they are not labeled.
or molecules in the interior of a crystal is called
its crystal structure. The unit cell of a crystal is
the smallest pattern of arrangement that can be
containedin a parallelepiped, the edges of which
form the a, b, and c axes of the crystal. The
three-dimensionalaggregation of unitcells in the
crystal forms a space lattice, or Bravais lattice
(see Fig. 20).
Crystal Systems. Seven different crystal sys-
tems are recognizedin crystallography, each hav-
ing a different set of axes, unit-celledge lengths,
and interaxial angles (see Table 2). Unit-celledge
lengths a, b, and c are measured along the corre-
spondinga, b, and c axes (see Fig. 21). Unit-cell
faces are identifiedby capital letters: face A con-
tains axes b and c, face B contains c and a, and
face C containsa and b. (Faces are not labeled in
Fig. 21.) Interaxial angle tx occurs in face A,
angle [3in face B, and angle y in face C (see Fig.
21).
Lattice Dimensions. It should be noted that the
unit-celledge lengths and interaxial angles are
uniquefor each crystallinesubstance. The unique
edge lengths are called lattice parameters. The
term lattice constant also has been used for the
length of an edge, but the values of edge length
are not constant, varyingwith composition within
a phase field and also with temperature due to
thermal expansionandcontraction. (Reported lat-
tice parameter values are assumed to be room-
temperature values unless otherwise specified.)
Interaxial angles other than 90° or 120° also can
change slightly with changes in composition.
When the edges of the unit cell are not equal in
all three directions, all unequal lengths must be
stated to completely define the crystal. The same
is true if all interaxial angles are not equal. When
defining the unit-cell size of an alloy phase, the
possibilityof crystal orderingoccurringover sev-
eral unitcells shouldbe considered. For example,
in the copper-gold system, a supedattice forms
that ismadeup of 10cellsofthe disordered lattice,
creating what is called long-period ordering.
Lattice Points. As shown in Fig. 20, a space
lattice can be viewed as a three-dimensionalnet-
work of straight lines. The intersections of the
lines (called lattice points) represent locations in
space for the same kindof atom or group of atoms
of identical composition,arrangement,and orien-
tation. There are five basic arrangements for lat-
tice points within a unit cell. The first four are:
primitive (simple), having lattice points solely at
cell comers; base-face centered (end-centered),
having lattice points centered on the C faces, or
ends of the cell; all-face centered, having lattice
points centered on all faces; and innercentered
(body-centered), having lattice points at the cen-
ter of the volume of the unit cell. The fifth ar-
rangement, the primitiverhombohedral unit cell,
is considered a separate basic arrangement, as
shown in the following section on crystal struc-
ture nomenclature.Thesefivebasic arrangements
are identified by capital letters as follows: P for
the primitive cubic, C for the cubic cell with
lattice points on the two C faces, F for all-face-
centered cubic, I for innercentered (body-cen-
tered) cubic, and R for primitiverhombohedral.
Table2 Relationshipsof edgelengthsand of interaxial anglesfor the sevencrystal systems
Crystalsystem Edgelengths lntera~dalangles Examples
Tficlinic (anorthic) a ¢ b # c Ix # ~ # 7 ¢ 90° HgK
Monoclinic a ¢ b ¢ c ~ = y = 90 ° # [3 13-S; CoSb2
Orthorhombic a # b # c 0t = 13= 7 = 90° or-S; Ga; Fe3C (cementite)
Tetragonal a = b # c ot = 13= 7 = 90° 13-Sn (white); TiO2
Hexagonal a = b ~ c o~ = 13= 90°; y = 120 ° Zn; Cd; NiAs
Rhombohedral(a) a = b = c ct = [5 = Y # 90° As; Sb; Bi; calcite
Cubic a = b = c ot = 13= T = 90° Cu; Ag; Au; Fe; NaCI
(a) Rhombohedral crystals (sometimes called trigonal) also can be described by using hexagonal axes (rhombohedral-hexagonal).