Download as PDF, PPTX


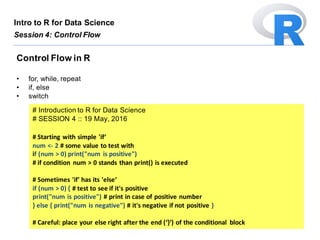
![For loops: slow and slower
Intro to R for Data Science
Session 4: Control Flow
# Introduction to R for Data Science
# SESSION 4 :: 19 May, 2016
# For loop is always working same way
for (i in simple_vect) print(i)
# Be aware that loops can be slow if
vec <- numeric()
system.time(
for(i in seq_len(50000-1)) {
some_calc <- sqrt(i/10)
# this is what makes it slow:
vec <- c(vec, some_calc)
})
# Introduction to R for Data Science
# SESSION 4 :: 19 May, 2016
# This solution is slightly faster
iter <- 50000;
# this makes it faster:
vec <- numeric(length=iter)
system.time(
for(i in seq_len(iter-1)) {
some_calc <- sqrt(i/10);
vec[i] <- some_calc # ...not this!
})](https://image.slidesharecdn.com/intrordatasciencesession4eng-160522213931/85/Introduction-to-R-for-Data-Science-Session-4-4-320.jpg)
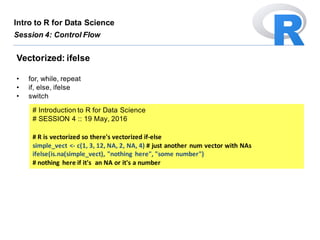
![For loops: slow and slower
Intro to R for Data Science
Session 4: Control Flow
# Introduction to R for Data Science
# SESSION 4 :: 19 May, 2016
# This solution is even faster
iter <- 50000
vec <- numeric(length=iter) # not because of this...
system.time(
for(i in seq_len(iter-1)) {
vec[i] <- sqrt(i/10) # ...but because of this!
})](https://image.slidesharecdn.com/intrordatasciencesession4eng-160522213931/85/Introduction-to-R-for-Data-Science-Session-4-5-320.jpg)
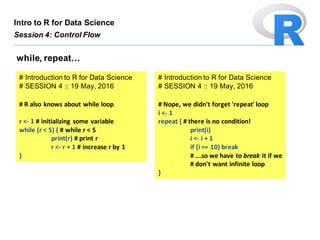
![For loops vs. vectorized functions
Intro to R for Data Science
Session 4: Control Flow
# Introduction to R for Data Science
# SESSION 4 :: 19 May, 2016
# Another example how loops can be slow
# (loop vs vectorized functions)
iter <- 50000
system.time(for (i in 1:iter) {
vec[i] <- rnorm(n=1, mean=0, sd=1)
# approach from previous example
})
system.time(y <- rnorm(iter, 0, 1)) # but this is much much faster](https://image.slidesharecdn.com/intrordatasciencesession4eng-160522213931/85/Introduction-to-R-for-Data-Science-Session-4-6-320.jpg)

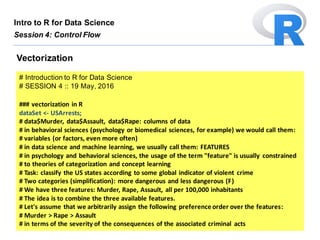
![switch()
Intro to R for Data Science
Session 4: Control Flow
# Introduction to R for Data Science
# SESSION 4 :: 19 May, 2016
type = 2
cc <- c("A", "B", "C")
switch(type,
c1 = {print(cc[1])},
c2 = {print(cc[2])},
c3 = {print(cc[3])},
{print("Beyond C...")} # default choice
);
# However…](https://image.slidesharecdn.com/intrordatasciencesession4eng-160522213931/85/Introduction-to-R-for-Data-Science-Session-4-9-320.jpg)
![switch()
Intro to R for Data Science
Session 4: Control Flow
# Introduction to R for Data Science
# SESSION 4 :: 19 May, 2016
# if you do this, R will miss the default choice, so be careful w. switch:
type = 4
cc <- c("A", "B", "C")
switch(type,
print(cc[1]),
print(cc[2]),
print(cc[3]),
{print("Beyond C...")}
# the unnamed default choice works only
# if previous choices are named!
)
# switch is faster than if… else… (!)](https://image.slidesharecdn.com/intrordatasciencesession4eng-160522213931/85/Introduction-to-R-for-Data-Science-Session-4-10-320.jpg)
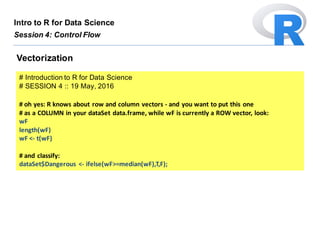
![Vectorization
Intro to R for Data Science
Session 4: Control Flow
# Introduction to R for Data Science
# SESSION 4 :: 19 May, 2016
# Let's first isolate the features from the data.frame
featureMatrix <- as.matrix(dataSet[, c(1,4,2)]);
# Let's WEIGHT the features in accordance with the imposed preference order:
weigthsVector <- c(3,2,1); # mind the order of the columns in featureMatrix
# Essentially, we want our global indicator to be a linear combination of all three selected
# features, where each feature is weighted by the corresponding element of the weigthsVector:
featureMatrix <- cbind(featureMatrix,numeric(length(featureMatrix[,1])));
for (i in 1:length(featureMatrix[,1])) {
featureMatrix[i,4] <- sum(weigthsVector*featureMatrix[i,1:3]);
# don't forget: this "*" multiplication in R is vectorized and operates element-wise
# we have a 1x3 weightsVector and a 1x3 featureMatrix[i,1:3], Ok
# sum() then produces the desired linear combination
}](https://image.slidesharecdn.com/intrordatasciencesession4eng-160522213931/85/Introduction-to-R-for-Data-Science-Session-4-12-320.jpg)
![Vectorization
Intro to R for Data Science
Session 4: Control Flow
# Introduction to R for Data Science
# SESSION 4 :: 19 May, 2016
# Classification; in the simplest case, let's simply take a look at
# the distribution of our global indicator:
hist(featureMatrix[,4],20); # it's multimodal and not too symmetric; go for median
criterion <- median(featureMatrix[,4]);
# And classify:
dataSet$Dangerous <- ifelse(featureMatrix[,4]>=criterion,T,F);
# Ok. You will never do this before you have a model that has actually *learned* the
# most adequate feature weights. This is an exercise only.
# ***Important***: have you seen the for loop above? Well...
# N e v e r d o t h a t.
dataSet$Dangerous <- NULL;](https://image.slidesharecdn.com/intrordatasciencesession4eng-160522213931/85/Introduction-to-R-for-Data-Science-Session-4-13-320.jpg)
![Vectorization
Intro to R for Data Science
Session 4: Control Flow
# Introduction to R for Data Science
# SESSION 4 :: 19 May, 2016
# In Data Science, you will be working with huge amounts of quantitative data.
# For loops are slow. But in vector programming languages like R...
# matrix computations are seriously fast.
# What you ***want to do*** is the following:
# Let's first isolate the features from the data.frame
featureMatrix <- as.matrix(dataSet[, c(1,4,2)]);
# Let's WEIGHT the features in accordance with the imposed preference order:
weigthsVector <- c(3,2,1); # mind the order of the columns in featureMatrix
# Feature weighting:
wF <- weigthsVector %*% t(featureMatrix);
# In R, t() is for: transpose
# In R, %*% is matrix multiplication](https://image.slidesharecdn.com/intrordatasciencesession4eng-160522213931/85/Introduction-to-R-for-Data-Science-Session-4-14-320.jpg)


This document provides an introduction to control flow in R, including for loops, if/else statements, and vectorization. It discusses how for loops can be slow in R and recommends using vectorized functions instead when possible. It provides examples of if/else, ifelse, while, repeat, and switch statements. It also emphasizes that matrix operations in R are very fast, and shows how to vectorize calculations rather than using for loops in order to efficiently classify US states based on crime rates.


![Introduction to R for Data Science :: Session 6 [Linear Regression in R]](https://cdn.slidesharecdn.com/ss_thumbnails/intrordatasciencesession6eng-160606173046-thumbnail.jpg?width=640&height=640&fit=bounds)

![Introduction to R for Data Science :: Session 5 [Data Structuring: Strings in R]](https://cdn.slidesharecdn.com/ss_thumbnails/intrordatasciencesession5eng-160529191417-thumbnail.jpg?width=640&height=640&fit=bounds)


![Uvod u R za Data Science :: Sesija 1 [Intro to R for Data Science :: Session 1]](https://cdn.slidesharecdn.com/ss_thumbnails/intrordatasciencesession1-160429163447-thumbnail.jpg?width=640&height=640&fit=bounds)


