Downloaded 29 times


![Precision
• Repeatability
– Standard deviation in analytical result of a sample analyzed on 1 day
by one analyst in one batch on 1 instrument
– estimation of the “best” variance of the analytical result produced
by a lab
•Reproducibility (within lab)
– Same as repeatability, but sample analyzed by several analysts on
different days, on several instruments
– estimation of the “real life” variance of the analytical result over a
longer period by that lab
•Repeatability < Reproducibility
– Experience: [reproducibility ~1.5 –2.5 X repeatability]](https://image.slidesharecdn.com/introductiontoproficiencytestingv2-191231132845/85/Introduction-to-proficiency-testing-4-320.jpg)
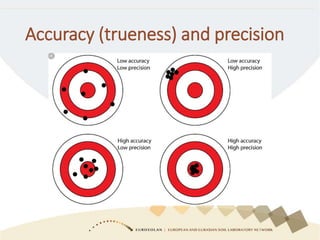
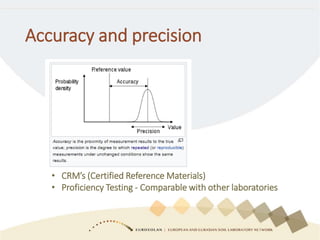
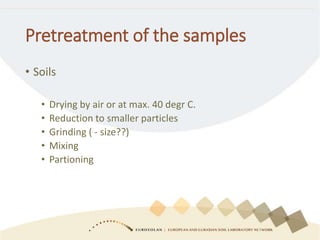
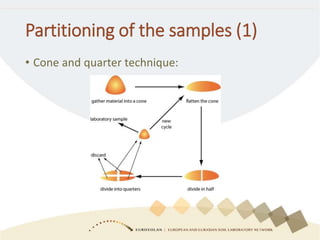
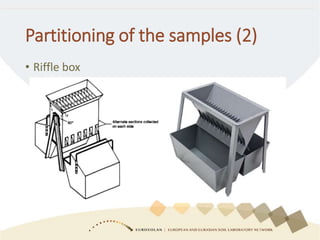
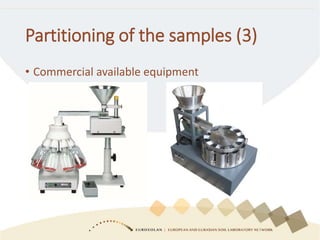


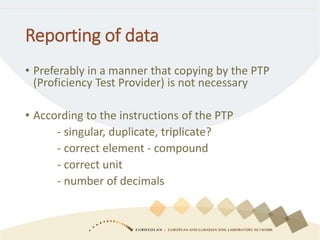
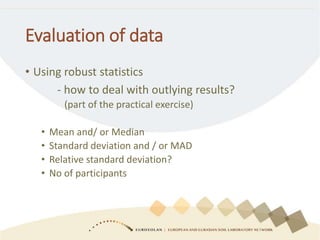
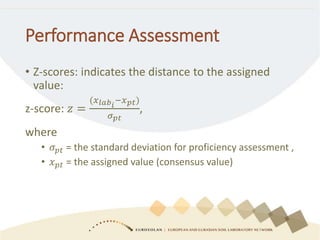
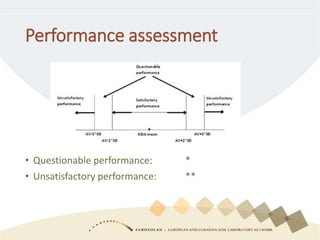


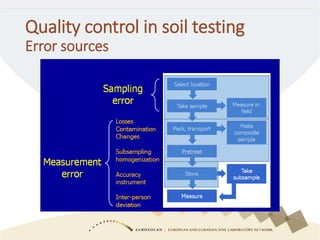
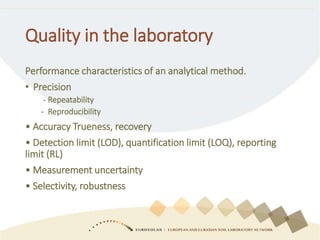
The document outlines the first meeting of the regional soil laboratory network in Eurasia and Europe, focusing on proficiency testing and quality control in soil analysis. It covers key concepts such as precision, accuracy, measurement uncertainty, and the importance of homogeneity in proficiency testing samples. Additionally, the document discusses methods for sample preparation, data reporting and evaluation, and performance assessment using z-scores.


