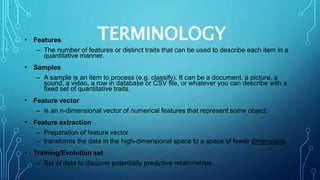
NAME : SHUBHAM SHIRKE
TOPIC : INTRODUCTION TO
MACHINE LEARNING
EMAIL ID :
SHUBHAMSHIRKE31@GMAIL.C
OM
AGENDA
• Introduction
• Basics
• Classification
• Clustering
• Regression
• Use-Cases
ABOUT
• subfield of Artificial Intelligence (AI)
• name is derived from the concept that it deals with
“construction and study of systems that can learn from data”
• can be seen as building blocks to make computers learn to behave more
intelligently
• It is a theoretical concept. There are various techniques with various
implementations.
TERMINOLOGY
• Features
– The number of features or distinct traits that can be used to describe each item in a
quantitative manner.
• Samples
– A sample is an item to process (e.g. classify). It can be a document, a picture, a
sound, a video, a row in database or CSV file, or whatever you can describe with a
fixed set of quantitative traits.
• Feature vector
– is an n-dimensional vector of numerical features that represent some object.
• Feature extraction
– Preparation of feature vector
– transforms the data in the high-dimensional space to a space of fewer dimensions.
• Training/Evolution set
– Set of data to discover potentially predictive relationships.
APPLE
(LEARNING AND TRAINING)
• Features : red Features : Sky blue Features : Green
• Type : fruit Type : Logo Type : fruit
• shape : etc. Shape : etc. Shape : etc.
WORKFLOW
SOFTWARE USED FOR MACHINE LEARNING
• Tensor Flow
• Shogun
• Apache Mahout
• Apache Spark Mllib
• Oryx 2
CATEGORIES
• Supervised Learning
• Unsupervised Learning
• Semi-Supervised Learning
• Reinforcement Learning
SUPERVISED LEARNING
• The correct classes of the training data are
known as
UNSUPERVISED LEARNING
• The correct classes of the training data are not known as
SEMI-SUPERVISED LEARNING
• A Mix of Supervised and Unsupervised learning
REINFORCEMENT LEARNING
• It allows the machine or software agent to learn its behavior based on feedback
from the environment
MACHINE LEARNING TECHNIQUES
TECHNIQUES
• classification: predict class from observations
• clustering: group observations into
•“meaningful” groups
• regression (prediction): predict value from observations
CLASSIFICATION
• Classify a document into a predefined category.
• Documents can be text, images • Popular one is Naive Bayes
Classifier.
• Steps:
– Step1 : Train the program (Building a Model) using a training set with a
category for e.g. sports, cricket, news,
– Classifier will compute probability for each word, the probability that it
makes a document belong to each of considered categories
– Step2 : Test with a test data set against this Model
• Clustering is the task of grouping a set of objects in such a way that objects in the same group
(called a cluster) are more similar to each other
• Objects are not predefined
• For e.g. these keywords
– “man’s shoe”
– “women’s shoe”
– “women’s t-shirt”
– “man’s t-shirt”
– can be cluster into 2 categories “shoe” and “t-shirt” or
• “man” and “women”
• Popular ones are K-means clustering and Hierarchical clustering
K-MEANS CLUSTERING
• partition n observations into k clusters in which each observation belongs to the cluster with the
nearest mean, serving as a prototype of the cluster. •
• http://pypr.sourceforge.net/kmeans.html
HIERARCHICAL CLUSTERING
• Method of cluster analysis which seeks to build a hierarchy of clusters.
• There can be two strategies
•– Agglomerative:
• This is a "bottom up" approach: each observation starts in its own cluster, and pairs of clusters are
merged as one moves up the hierarchy.
• Time complexity is O(n^3) – Divisive:
• This is a "top down" approach: all observations start in one cluster, and splits are performed recursively
as one moves down the hierarchy.
• Time complexity is O(2^n)
• http://en.wikipedia.org/wiki/Hierarchical_clustering
REGRESSION
• Is a measure of the relation between the mean value of one variable (e.g. output) and
corresponding values of other variables (e.g. time and cost)
• regression analysis is a statistical process for estimating the relationships among
variables.
• Regression means to predict the output value using training data.
• Popular one is Logistic regression
•(binary regression)
• http://en.wikipedia.org/wiki/Logistic_regression
•
USE-CASES (CONTD.)
• Text Summarization - Google News
• Rating a Review/Comment: Yelp
• Fraud detection : Credit card Providers
• Decision Making : e.g. Bank/Insurance sector
• Sentiment Analysis
• Speech Understanding – iPhone with Siri
• Face Detection – Facebook’s Photo tagging
•35

Introduction to Machine learning ppt

  • 1.
    NAME : SHUBHAMSHIRKE TOPIC : INTRODUCTION TO MACHINE LEARNING EMAIL ID : SHUBHAMSHIRKE31@GMAIL.C OM
  • 2.
    AGENDA • Introduction • Basics •Classification • Clustering • Regression • Use-Cases
  • 3.
    ABOUT • subfield ofArtificial Intelligence (AI) • name is derived from the concept that it deals with “construction and study of systems that can learn from data” • can be seen as building blocks to make computers learn to behave more intelligently • It is a theoretical concept. There are various techniques with various implementations.
  • 4.
    TERMINOLOGY • Features – Thenumber of features or distinct traits that can be used to describe each item in a quantitative manner. • Samples – A sample is an item to process (e.g. classify). It can be a document, a picture, a sound, a video, a row in database or CSV file, or whatever you can describe with a fixed set of quantitative traits. • Feature vector – is an n-dimensional vector of numerical features that represent some object. • Feature extraction – Preparation of feature vector – transforms the data in the high-dimensional space to a space of fewer dimensions. • Training/Evolution set – Set of data to discover potentially predictive relationships.
  • 5.
    APPLE (LEARNING AND TRAINING) •Features : red Features : Sky blue Features : Green • Type : fruit Type : Logo Type : fruit • shape : etc. Shape : etc. Shape : etc.
  • 6.
  • 7.
    SOFTWARE USED FORMACHINE LEARNING • Tensor Flow • Shogun • Apache Mahout • Apache Spark Mllib • Oryx 2
  • 8.
    CATEGORIES • Supervised Learning •Unsupervised Learning • Semi-Supervised Learning • Reinforcement Learning
  • 9.
    SUPERVISED LEARNING • Thecorrect classes of the training data are known as
  • 10.
    UNSUPERVISED LEARNING • Thecorrect classes of the training data are not known as
  • 11.
    SEMI-SUPERVISED LEARNING • AMix of Supervised and Unsupervised learning
  • 12.
    REINFORCEMENT LEARNING • Itallows the machine or software agent to learn its behavior based on feedback from the environment
  • 13.
    MACHINE LEARNING TECHNIQUES TECHNIQUES •classification: predict class from observations • clustering: group observations into •“meaningful” groups • regression (prediction): predict value from observations
  • 14.
    CLASSIFICATION • Classify adocument into a predefined category. • Documents can be text, images • Popular one is Naive Bayes Classifier. • Steps: – Step1 : Train the program (Building a Model) using a training set with a category for e.g. sports, cricket, news, – Classifier will compute probability for each word, the probability that it makes a document belong to each of considered categories – Step2 : Test with a test data set against this Model
  • 15.
    • Clustering isthe task of grouping a set of objects in such a way that objects in the same group (called a cluster) are more similar to each other • Objects are not predefined • For e.g. these keywords – “man’s shoe” – “women’s shoe” – “women’s t-shirt” – “man’s t-shirt” – can be cluster into 2 categories “shoe” and “t-shirt” or • “man” and “women” • Popular ones are K-means clustering and Hierarchical clustering
  • 16.
    K-MEANS CLUSTERING • partitionn observations into k clusters in which each observation belongs to the cluster with the nearest mean, serving as a prototype of the cluster. • • http://pypr.sourceforge.net/kmeans.html
  • 17.
    HIERARCHICAL CLUSTERING • Methodof cluster analysis which seeks to build a hierarchy of clusters. • There can be two strategies •– Agglomerative: • This is a "bottom up" approach: each observation starts in its own cluster, and pairs of clusters are merged as one moves up the hierarchy. • Time complexity is O(n^3) – Divisive: • This is a "top down" approach: all observations start in one cluster, and splits are performed recursively as one moves down the hierarchy. • Time complexity is O(2^n) • http://en.wikipedia.org/wiki/Hierarchical_clustering
  • 18.
    REGRESSION • Is ameasure of the relation between the mean value of one variable (e.g. output) and corresponding values of other variables (e.g. time and cost) • regression analysis is a statistical process for estimating the relationships among variables. • Regression means to predict the output value using training data. • Popular one is Logistic regression •(binary regression) • http://en.wikipedia.org/wiki/Logistic_regression •
  • 19.
    USE-CASES (CONTD.) • TextSummarization - Google News • Rating a Review/Comment: Yelp • Fraud detection : Credit card Providers • Decision Making : e.g. Bank/Insurance sector • Sentiment Analysis • Speech Understanding – iPhone with Siri • Face Detection – Facebook’s Photo tagging •35